Applying Language Modeling to Session Identification from Database Trace Logs Qingsong Yao, Xiangji Huang and Aijun An York University Toronto, Ontario, M3J 1P3, Canada
[email protected],
[email protected],
[email protected]
language models from different types of training data. Finally, we report experimental results that show the effectiveness of the language model based method for identifying sessions from the trace logs of an OLTP database application.
Abstract A database session is a sequence of requests presented to the database system by a user or an application to achieve a certain task. Session identification is an important step in discovering useful patterns from database trace logs. The discovered patterns can be used to improve the performance of database systems by prefetching predicted queries, rewriting the current query or conducting effective cache replacement. In this paper, we present an application of a new session identification method based on statistical language modeling to database trace logs. Several problems of the language modeling based method are revealed in the application, which include how to select values for the parameters of the language model, how to evaluate the accuracy of the session identification result and how to learn a language model without well-separated training data. All of these issues are important in the successful application of the language modeling based method for session identification. We propose solutions to these open issues. In particular, new methods for determining an entropy threshold and the order of the language model are proposed. New performance measures are presented to better evaluate the accuracy of the identified sessions. Furthermore, three types of learning methods, namely, supervised, semi-supervised and unsupervised learning, are introduced to learn Permission to copy without fee all or part of this material is granted provided that the copies are not made or distributed for direct commercial advantage, the VLDB copyright notice and the title of the publication and its date appear, and notice is given that copying is by permission of the Very Large Data Base Endowment. To copy otherwise, or to republish, requires a fee and/or special permission from the Endowment. Proceedings of the 30th VLDB Conference,
1
Introduction
The performance of a database system is influenced by the characteristics of its hardware and software components as well as of the workload it has to process [2]. The workload is a set of requests the system receives during a period of time. It reflects the query behavior of the database users. The analysis of the workload has played an important role in optimizing the performance of database systems. While most work on workload analysis is based on transactions recorded on the database trace logs, it has been brought into attention that analysis of taskoriented user sessions provides useful insight into the query behavior of the database users [12, 7]. A session is a sequence of queries issued by a user (or an application) to achieve a certain task. It consists of one or more database transactions, which are in turn a sequence of operations performed as a logical unit of work. Analysis of sessions allows us to discover highlevel patterns that stem from the structure of the task the user is solving. The discovered patterns can be used to predict incoming user queries based on the queries that the user has already issued. The prediction can be utilized in the semantic query caching technique to optimize database performance by prefetching predicted queries, rewriting current query and conducting effective cache replacement [12, 13, 14]. In order to find useful patterns in user sessions, it is necessary, as the first step, to group the queries on the database trace logs into sessions. A user may have a single session or multiple sessions during a period of time, depending on the number of tasks the user performs during that period of time. Only once these sessions have been identified, can common usage pat-
terns among sessions be discovered by statistical or data mining tools. The most commonly used session identification method is called timeout, in which a user session is defined as a sequence of requests from the same user such that no two consecutive requests are separated by an interval more than a predefined threshold. This session identification method suffers from the problem that it is difficult to set the time threshold. Different users may have different query behaviors, and their time intervals between sessions may be significantly different. Even for the same user, intervals between sessions may vary. Recently, a new session identification method based on statistical language models was proposed and used to detect session boundaries in Web logs [10]. The method does not rely on any time intervals when identifying session boundaries. Instead, it uses an information theoretic approach to identifying session boundaries dynamically by measuring the change of information in the sequence of requests. The method has been demonstrated to be more effective than the timeout and two other methods in discovering interesting association rules in a Web mining domain. However, the successful use of this method depends on how to select values for some parameters, such as the order of the language model and an entropy threshold, which is the minimum change of entropy between two consecutive requests. How to select suitable values for these parameters for a given data set remains open. In addition, the method was only used as an unsupervised learning method in [10] and was only evaluated on a Web log data set in which true sessions were not known. The evaluation was based on the number of interesting association rules generated from the identified sessions, which is an indirect evaluation of the accuracy of the session identification method. Better performance metrics are necessary to demonstrate the effectiveness of the method. In this paper, we present an application of the language modeling based session identification method to the trace logs of an OLTP database system. Our objective is to determine whether the language modeling method is effective for detecting the boundaries of user sessions in database applications. We also propose solutions to the open issues in the language modeling based method. To solve the parameter selection problem, we propose new methods for determining the entropy threshold and the order of the language model. In addition, new performance measures are proposed to better evaluate the accuracy of the identified sessions. The performance measures are used in the evaluation of the method and are also utilized in the parameter selection and tuning process. Furthermore, three types of learning methods, namely, supervised, semi-supervised and unsupervised learning, are introduced to learn language models. These learn-
ing methods are designed to suit the different characteristics of real log data sets. Finally, we present a performance evaluation, in which the language modeling based method is compared to the timeout method. The evaluation results show that the language modeling method in either supervised, unsupervised or semisupervised learning mode is significantly better than the standard timeout method. The paper is organized as follows. In Section 2, we describe the background of our application and the application data set. In Section 3, a complete picture of the language modeling based session identification method is presented. We describe the statistical formulation of language modeling, how to use the language modeling technique for session detection, new methods for automatic parameter selection, and performance measures. In Section 4, we present a performance evaluation of the language modeling based session identification method on our application data set. Other related work is described in Section 5. Finally, in Section 6, we summarize the contributions of this paper and discuss the impact of the work.
2 2.1
Application Background Motivation
The application presented in this paper is part of a large research project that investigates how data mining can be used for database query optimization. We particularly focus on how to discover and model user access patterns from database workloads and how to use the user access patterns for semantic query caching. Semantic query caching is a data caching technique that makes use of the cached query results to evaluate the incoming queries. Our work is based on the belief that the queries submitted by a client or an application are not random; they contain business meanings and may follow certain rules. Discovery of these rules will enable the prediction of incoming queries based on the queries that are already submitted. The prediction in turn enables effective query prefetching, query rewriting and cache replacement. We have proposed to use user access graphs to model the query behavior of a user or a group of users and suggested algorithms to use such information to predict queries, rewrite queries and select queries for caching [13, 14]. We currently work on automatic generation of user access graphs from database trace logs. In order to generate user access graphs, requests in the trace logs need to be grouped into sessions, each of which is a sequence of requests submitted by a user or an application to perform a task. Only after user sessions are obtained, can user access graphs be discovered by data mining algorithms. In other words, session identification is a prerequisite for discovering use access graphs.
Figure 1: Extracting user request sequence 2.2
Application Domain
To test our ideas in the project, we have been using a clinic OLTP application as a test bed. The clinic is a private physiotherapy clinic located in Toronto. It has five branches across the city. It provides services such as joint and spinal manipulation and mobilization, post-operative rehabilitation, personal exercise programs and exercise classes, massage and acupuncture. In each day, the client applications installed in the branches make connections to the center database server, which is Microsoft SQL Server 7.0. In each connection, a user may perform one or more tasks, such as checking in patients, making appointments, displaying treatment schedules, explaining treatment procedures and selling products. 2.3
Data Collection and Preprocessing
The log file is collected by using Microsoft SQL Profiler. The SQL Profiler can monitor all events that occur in the SQL Server database, and a user can define the events to be monitored manually. We use the SQL Profiler to collect all SQL queries submitted by the client application within a period of observation time. The log entry contains information about the corresponding SQL query, such as the query content (Sql), the beginning time (StartTime), the finishing time (EndTime) and the connection id (Spid). Not all the information in the log entry is relevant to the task of session identification. Thus, data preprocessing was conducted on the database traces. The following two steps were performed to preprocess the data:
1. identifying the users from each log entry, and 2. classifying and identifying user requests from the event log entry. In our application, a connection is made by a single user whose user id and password are submitted at the beginning of the connection. Thus, the requests from the connections that have the same user id belong to the same user. There are many different SQL queries in a given log file. Many of these queries have similar query formats. For example, queries “select name from profile where id=1” and “select name from profile where id=2” only differ in the value part, and they are the same kind of user request. Since our objective is to predict incoming queries for query optimization, it is necessary to generalize the query by ignoring the value difference among queries. We developed a program to replace the data values embedded in an SQL query with the wildcard character (% ). The modified SQL query is called an SQL template. By replacing each SQL query with its corresponding SQL template, we can obtain a collection of SQL templates. By replacing each SQL template with a label, we can obtain a sequence of request labels made by each user, which is the input of the session identification program. We call this step as request classification and identification step. Figure 1 shows an example of classifying and identifying user requests 1 . The collected data contain 18 connections, 8 users and 7244 events within a 10 hour observation time. For each user the requests are sorted according to the 1 Field
EndTime is not shown in the figure
connection id and StartTime. Clearly, in the request sequence of each user, the change of connection id is a session boundary. However, there is usually more than one session within a connection. Our task is to group the requests within one connection into sessions.
The quality of a given statistical language model can be measured by its empirical perplexity and entropy on a given corpus of text s [1], where the empirical perplexity of the model on s is defined as
2.4
and the empirical entropy of the model on s is
Session Example
Table 1 shows an instance of a session for displaying the treatment schedule for a patient. The session contains queries for checking the authority (30), checking whether the customer exists (9), retrieving the membership card information (10), retrieving the customer’s contact information (20), retrieving the customer’s treatment history (47), and retrieving the schedule information (49). Knowing the structure of the sessions can help predict, pre-fetch or rewrite queries for better performance. For example, all the queries in sequence 9,10,20 request information from table customer. If this sequence is found to be a frequent sequence, we can rewrite the first query to retrieve all the necessary information from table customer and put the result in a local cache. When the two other queries are submitted by the user, they can be answered from the cache.
3 3.1
Session Identification with Language Modeling Statistical Language Model
The original motivation for statistical language modeling comes from speech recognition, where the goal is to predict the probability of natural word sequences. Given a word sequence, s = w1 w2 ...wN , its probability can always be written using the probability chain rule as: P (s) = P (w1 )P (w2 |w1 )P (w3 |w1 w2 )... P (wN |w1 ...wN −1 ) =
N Y
P (wi |w1 ...wi−1 )
i=1
The simplest and most successful statistical language models have been n-gram language models. In n-gram language modeling, it is assumed that the probability of a word only depends on its at most n − 1 preceding words. Thus, the probability of a word sequence s becomes P (s)
=
N Y
P (wi |wi−n+1 ...wi−1 )
i=1
A statistical language model, then, is a specific choice of conditional probabilities for all possible n-grams: P (wi |wi−n+1 ...wi−1 ).
1
Perplexity(s) = P (s)− N
Entropy(s)
= log2 Perplexity(s) 1 = − log2 P (s) N That is, we would like the language model to place high probability on natural test sequences s, and hence obtain a small value of empirical perplexity or entropy. The key issue in statistical language modeling is how to estimate the n-gram probabilities from a given corpus of training data. A straightforward method for estimating n-gram probabilities uses the observed frequencies of word sequences in the training corpus as follows: #(wi−n+1 ...wi ) P (wi |wi−n+1 ...wi−1 ) = (1) #(wi−n+1 ...wi−1 ) where #(.) is the number of occurrences of a specified gram in the training corpus. Although one could attempt to use this simple n-gram model to capture long range dependencies in language, such a simple approach to estimation suffers from the sparse data problem. For instance, to train a trigram model with a vocabulary size of 20,000, there are 8 trillion free parameters to be estimated. However, any reasonable training set may only contain a sequence of a few million words. In general, using grams of length up to n entails estimating the probability of W n events, where W is the size of the word vocabulary. Because of the heavy tailed nature of language (i.e. Zipf’s law) one is likely to encounter novel n-grams that were never witnessed during training in a test corpus, and the probability for these unseen n-grams should clearly not be zero. Therefore, a mechanism for assigning nonzero probability to novel n-grams is a central and unavoidable issue in statistical language modeling. One standard approach to smoothing probability estimates to cope with the sparse data problem (and to cope with potentially missing n-grams) is to use some sort of back-off estimator as follows [11]. P (wi |wi−n+1 ...wi−1 ) Pˆ (wi |wi−n+1 ...wi−1 ), if #(wi−n+1 ...wi ) > 0 = β(wi−n+1 ...wi−1 ) × P (wi |wi−n+2 ...wi−1 ), otherwise
(2)
where discount #(wi−n+1 ...wi ) (3) Pˆ (wi |wi−n+1 ...wi−1 ) = #(wi−n+1 ...wi−1 )
Label
Statement
30 9 10 20 47
select select select select select check select
49
authority from employee where employee id =’1025’ count(*) as num from customer where cust num = ’1074’ card name from customer t1,member card t2 where 1.cust num = ’1074’ and t1.card id = t2.card id contact last,contact first from customer where cust num = ’1074’ t1.branch ,t2.* from record t1, treatment t2 where t1.contract no = t2.contract no and t1.cust id =’1074’ and in date = ’2002/03/04’ and t1.branch = ’scar’ top 10 contract no from treatment schedule where cust id = ’1074’ order by checkin date desc
Table 1: An instance of schedule display session is called discounted probability and β(wi−n+1 ...wi−1 ) is a normalization constant calculated to be
1−
β(wi−n+1 ...wi−1 ) = X Pˆ (x|wi−n+1 ...wi−1 )
x:#(wi−n+1 ...wi−1 x)>0
1−
X
Pˆ (x|wi−n+2 ...wi−1 )
(4)
x:#(wi−n+1 ...wi−1 x)>0
Different methods can be used for computing the discounted probability in Equation 3. Typical discounting techniques include absolute smoothing (ABS), Good-Turing smoothing (GT), linear smoothing (LIN) and Witten-Bell smoothing (WB) [4]. The objective of smoothing is to reserve a small amount of probability mass for unobserved events. Different discounting techniques have different assumption on how to reserve this probability mass. We use Witten-Bell smoothing in the experiments reported in this paper. In Witten-Bell discounting, the probability of a word wi given wi−n+1 ...wi−1 is calculated as: #(wi−n+1 ...wi ) Pˆ (wi |wi−n+1 ...wi−1 ) = α #(wi−n+1 ...wi−1 ) where α is defined differently as: α=1−
C #(wi−n+1 ...wi−1 ) + C
where C denotes the number of distinct words that can follow wi−n+1 ...wi−1 in the training data. 3.2
N-gram Based Session Identification
Although the original motivation of language modeling is to estimate the probability of naturally occurring word sequences, language modeling actually provides a general strategy for estimating the probability of any sequence—regardless of whether the basic units consist of words, characters, or any other arbitrary alphabet. In this sense, many problems can be formulated as a language modeling problem. In database applications, queries are issued sequentially in a particular order, similar to the word sequences that occur in a natural language. If we consider each query as a basic unit, like a word or character in natural language, we can then attempt to estimate the probability of query
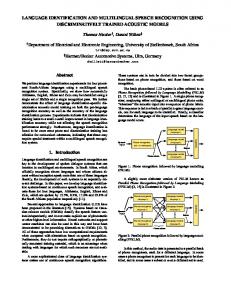
sequences using the same language modeling tools described above. The basic goal of session identification in a database application is to group sequential queries in a database trace log that are issued to achieve a certain task, and segment queries that are unrelated. Language modeling provides a simple, natural approach to segmenting these log sequences. Imagine a set of queries for a task that are frequently issued one after another. In this case, the entropy (or perplexity) of the sequence is low. However, when a new query is observed in the sequence that is not relevant to the original task (but in fact indicates a shift to a new task), the introduction of this new query causes an increase in the entropy of the sequence because it is rarely issued after the preceding sequence of queries. Such an entropy increase serves as a natural signal for session boundary detection. If the change in entropy passes a threshold, a session boundary could be placed before the new query. In other words, the uncertainty (which is measured by entropy) within a session should be roughly constant, allowing for a fixed level of variability within a topic. However, whenever the entropy increases beyond a threshold, this presents a clear signal that the user’s activity has changed to another topic. Thus, we should set a session boundary at the place where the entropy changes. Figure 2 shows the entropy evolution of a query sequence in one connection from our OLTP application, where the X-axis is the sequence represented by query ids, Y-axis is the entropy of the sequence from the first query to the current query, and the two curves are based on the n-gram models trained in the unsupervised and supervised modes (explained in Section 3.3), respectively. As one can see, the entropy changes radically at some points, although it remains stable in other places. This figure gives an intuition how entropy could be used for session boundary detection.
3.3
Supervised and Unsupervised Learning
The probabilities in an n-gram model come from the data it is trained on. This training data need to be carefully designed. If the training data is too specific to one task, the probabilities may be too narrow and not generalize well to other tasks. If the training data is too general or too small, the probabilities may not reflect the task or the domain efficiently. Good train-
5 Unsupervised Supervised 4.5
4
3.5
entropy
3
2.5
2
1.5
1
0.5
0 43 30 10 47 37 31 35 32 7 37 25 36 45 50 24 54 45 43 43 30 10 47 37 31 35 32 7 37 30 45 sequence
Figure 2: Entropy evolution in our web log dataset ing data should contain enough information about the observed application or user, i.e., the training data should reflects the dynamic behavior of the observed application or the users. There are three kinds of training data, separated training data, un-separated training data and partially separated training data . In separated training data, sessions have been identified and thus the training data set consists of a set of sessions. This is similar to the situation in computational linguistics where the punctuation symbols can separate an article into sentences. An n-gram model is trained on sentences instead of the whole article, in which the frequencies of inter-sentence words are set to 0. We refer to the n-gram learning method that is based on the separated training data as supervised learning method. In some situations, it is very difficult, if not impossible, to obtain a separated training data set. For example, log files for Web applications do not usually contain session boundaries. In this case, we can estimate request frequencies based on the un-separated data sequence, and the corresponding n-gram model contains both the inter-session and the intra-session request frequencies. We call this session detection method the unsupervised session detection method. In the ngram model trained by the unsupervised method, the difference between the inter-session and intra-session entropy changes is not as large as in the model derived from the supervised session detection method (as shown in Figure 1). Therefore, the unsupervised learning is more sensitive to the selection of parameters, such as the entropy threshold and the n-gram order. In a third type of situation, which is most common, the training data are partially separated. For example, in some database or Web applications, users are required to make a connection to the server and/or to log in with their user names and password. A login request is clearly the beginning of a session. However,
the user may conduct several tasks within one connection and most users do not log out after they finish their tasks. Therefore, the log data contain part of the boundary points and are thus partially separated by the boundary points. In this case, we can build an n-gram model by estimating the probabilities based on the partially separated training data. We refer to this method as semi-supervised learning method. In either unsupervised or semi-unsupervised learning, inter-session probabilities are over-estimated due to the use of unseparated or partially separated training data. However, assuming sessions are independent, these inter-session probabilities are usually much smaller than the estimated intra-session probabilities. Since sessions are identified by observing the entropy change in the data sequence, it is still reasonable to use the learned language model to identify sessions on a data sequence. However, to obtain the best values for n-gram model parameters, such as the order n and the entropy change threshold, a development set that contains completely separated sessions is needed. We will describe how to estimate the parameters later in this section. The development set can be obtained by taking a small portion of the training data and manually separating the data into sessions using domain knowledge. Since the development set is small, it is much easier to obtain than a large separated training data set. 3.4
Performance Measures
After an n-gram model is built over the training data, it can be used to divide an unseparated test sequence of requests into sessions. Performance measures are needed to evaluate the accuracy of the session detection. In this section, we propose to use two performance measures that have not been used in evaluation of session detection and discuss their correlations. One of the measures will be used in parameter selection for building n-gram models. The first measure is referred to as F-measure, which has been used in information retrieval to measure the retrieval performance. Suppose we know the true session boundaries in the test sequence. The precision of session detection is defined as the ratio of the number of the true session boundaries that are correctly detected to the total number of estimated boundaries. The recall of session detection is the hit-rate, which is the portion of the true session boundaries that are correctly detected. F-measure is defined as F-Measure =
2 ∗ P recision ∗ Recall P recision + Recall
A higher F-measure value means a better overall performance. The second measure is called cross entropy. For a set T of sequences {φ1 , ..., φm } and a smoothed n-gram model that have probabilities P (wi |wi−n+1 ...wi−1 ), we
3.5.1
Automatic Selection of Threshold
Threshold selection is a critical task of the language modeling based session boundary detection method. If the threshold is too large, many session boundaries are missed and the recall of the detection is low. On
0.4 0.2 Threshold(%) 0 20
0 12
90
70
10
30
50
0
Figure 3: Correlation between F-measure and cross entropy the other hand, a small threshold causes many nonboundary events to be mistreated as session boundaries, which results in low precisions. In both cases, the performance in term of F-Measure is low. To see how threshold selection is important, we compared the performances of the n-gram method based on different threshold values. The result is shown in Figure 4. In the experiment, the change in entropy is measured by the relative change in entropy values, defined as Entropy(s1 ) − Entropy(s0 ) Entropy(s0 ) where s0 is a sequence of requests and s1 contains s0 plus the next request following s0 in the test data sequence. Based on this definition, a threshold value of 0.20 means that if the change in entropy is over 20%, there is a boundary at the end of s0 . From Figure 4, we can observe that the performance of an n-gram model greatly depends on the threshold value. 0.9
F-Measure 2-gram
0.8 0.7
3-gram 4-gram
0.6
5-gram 6-gram 7-gram
0.5 0.4 0.3 0.2
80 10 0
60
40
20
16 18
Threshold(%)
0.1
12 14
Assuming the smoothing method is determined, there are two parameters in the language modeling based session detection method. One is the order of the ngram model, which is n. The other is the entropy change threshold used in segmenting the test sequence.
0.6
8 10
Parameter Selection
0.8
6
3.5
F-Measure Cross-Entropy
1
4
where P (φi ) can be calculated by using P (wi |wi−n+1 ...wi−1 ). The measure of cross-entropy is motivated by the well-known relation between prediction and compression. In particular, given a language model that assigns probability P (T ) to a set T, we can derive a compression algorithm that encodes T using − log2 P (T ) bits. The cross-entropy Hp (T ) of a model P (wi |wi−n+1 ...wi−1 ) on data T is defined as 1 Hp (T ) = − log2 P (T ), N where N is the number of events in T. This value can be interpreted as the average number of bits needed to encode each event in T by using the compression algorithm associated with model P (wi |wi−n+1 ...wi−1 ). A smaller cross-entry value means a better compression algorithm, and a better session separating model as well. Figure 3 shows the inverse correlation between F-measure and cross entropy. It depicts how the performance of the n-gram based session identification method, measured by both performance measures, changes with the value of the entropy threshold on a data set used in our application. An advantage of using cross entropy to measure the performance of an n-gram model for session detection is that we do not need to know the true session boundaries in test data to calculate the cross entropy. This feature makes it possible to make use of cross entropy as a performance measure on the test data set for adjusting the parameters of an n-gram model (see Section 3.5.2). However, the n-gram model should be trained in the supervised mode (i.e. trained on the separated data set) in order for cross entropy to be a reliable performance measure on test data. If the model is trained on an unseparated data set, the unseparated data set will have the smallest cross entropy, which results in failure in detecting any session boundaries.
1.2
0
P (φi ),
i=1
Value
2
P (T ) =
m Y
1.4
0
can calculate the probability of the set T as the product of the probabilities of all the sequences in T :
Figure 4: Performance change with different threshold values To achieve good performance, we propose an automatic method for choosing a threshold value for our language model session detection method. Suppose
that the test data sequence has m sessions and N events. After we estimate the entropy value of each sequence in the test data, we can calculate and sort the relative entropy difference values in decreasing order. If our language model can find all m-1 session boundaries correctly, then the corresponding relative entropy difference values will occupy the first m-1 positions in the sorted list. Thus, the mth value in the sorted list is the estimated threshold value. In practice, we may not know the actual value of m. However, if we know the average session length (avgLen), we can estimate m to be N/avgLen and thus choose the (N/avgLen)th value in the sorted list as the threshold value. For supervised learning, we can estimate the average session length from the training data. For unsupervised or semi-supervised learning, we can use the development set to estimate the average session length. Also, for different n-gram orders, the estimated threshold values are different. 3.5.2
Automatic Selection of N-gram Orders
Given a data set with average session length avgLen, we can choose an n-gram order between 1 and avgLen. The 1-gram method assumes that each event is independent, while the 2-gram model assumes that the current event only depends on the event just preceding it. We can also choose a larger n-gram order since it can use more history data. Figure 5 illustrates how the performance of an n-gram method changes with the order of the model on one of our test data sets. The result shows that for our application an n-gram model with an order between 2 and 8 is generally good, and the performance of the model with a lower order (from 2 to 5) is always better than that with a higher order (from 6 to 8). Since different data sets may achieve the best performance at different order values, an automatic method for order selection is necessary. We propose the following method to select the best n-gram order for a data set. The method treats supervised learning and unsupervised or semi-supervised learning differently. For supervised learning, we train a set of n-gram models with different n values, say from 2 to 8, on the training data set. We then test each model on the unseparated test data sequence with an entropy threshold selected using the automatic threshold selection method. The performance of each model on the test sequence is measured in terms of cross entropy. The model with the smallest cross entropy is selected. Cross entropy, instead of F-measure, is used as the performance measure in this process because it can be calculated without knowing the true boundaries in the test data sequence. For unsupervised or semi-supervised learning, a set of n-gram models with different n values is trained on the unseparated or partially separated training data. Then each model is tested on the development set. The
0.9
F-Measure
0.8 0.7 0.6 Threshold: 0.10 0.12 0.14 0.16 0.18
0.5 0.4 0.3 0.2
N-Gam Order 0.1 1
2
3
4
5
6
7
8
9
10
Figure 5: Performance change with different n–gram orders performance of each model on the development set is measured by F-measure. The model with the highest F-measure is chosen. Note that we cannot use the test data sequence and cross entropy to test the models as in supervised learning because the models are trained on the unseparated data and thus the unseparated test data sequence will have the smallest cross entropy. Using F-measure on the development set is more reliable in this situation.
4
Performance Evaluation
In this section, we evaluate our method for session identification by comparing the performance of the method to the performance of the timeout method. 4.1
The Data Sets
The data sets used in our experiments were based on the database trace logs described in Section 2. After the data preprocessing step (as described in Section 2.3), the data contain 18 sequences (each of which corresponds to a database connection) and 7,244 queries in total. In our experiments, we do not differentiate sequences in terms of users. Learning from the data set containing all the users allows us to learn the common behavior of the users. To give a complete picture of the performance of the n-gram based session identification method, we evaluate the method in all the three learning modes: supervised, unsupervised and semi-supervised learning. To evaluate the supervised learning method, we manually separated the data set into sessions according to domain knowledge with the help from a domain expert. This process is time-consuming, but the effort is worthwhile because it does not only allow us to train n-gram models with supervised learning, but also enables us to evaluate the results of session identification by comparing the identified sessions to the true sessions. We randomly selected four test data sets from the collected data set, referred to as D1 , D2 , D3 , and D4 .
0.9
Each test data set corresponds to one database connection. Characteristics of each test data set is shown in Table 2. Name D1 D2 D3 D4
Number of Events 677 441 816 1181
Number of Sessions 65 56 118 153
Threshold (s)
F-Measure
0.2 15
0.8
0.5 20
1 60
2 120
3 300
5 600
8 1200
10 1800
0.7 0.6
Average Session Length 10.4 7.9 6.9 7.7
0.5 0.4 0.3 0.2 0.1 0
D1
D2
D3
D4 Data Set
Table 2: Testing Data Sets
Figure 6: Comparison of timeout thresholds
For supervised learning, the four test data sets are taken out from the training data. For unsupervised or semi-supervised learning, we use the whole data set as the training data to calculate the probabilities in the n-gram model, and use D1 as the development set to tune parameters. The learned model are tested on D2 , D3 , and D4 . The training data for the unsupervised method consist of the 18 unseparated data sequences, corresponding to the 18 connections, respectively. For the semisupervised method, some boundary “words” are used to partially separate the training data sequences. In our application, the boundary words are user signin/sign-out and user authority checking, which were obtained by consulting the domain experts. However, in our data set, not all the sessions begin or end with a boundary word. The semi-supervised learning is thus most suitable for our application.
are then tested on other test data sets. Table 3 show the results in terms of the number of true sessions in each test data set, the number estimated sessions, the number of correct sessions in the estimated sessions, and the F-measure values. To evaluate our automatic threshold selection method, we compare the automatic selection method with a more exhaustive parameter selection method, in which a number of threshold values joined with a number of values for order n are tested on the development set and the parameter values that achieve the best performance on the development set are chosen. The F-measure values from the exhaustive method are shown under “Best n-gram” in Table 3. The “Average” F-measure in Table 3 is the average of F-measures resulting from the different parameter settings tested in the exhaustive method. We also list the best results from the timeout method. Note that the timeout thresholds that achieve the best timeout performance are different among the data sets. We can observe that the results from the automatic parameter selection method are close to the best n-gram results from the exhaustive method. For two of the test data sets, the automatic method is significantly better than the best timeout method.
4.2
Performance of Timeout Method
For the timeout method, we conducted experiments with a number of timeout thresholds, ranging from 0.2 second to 30 minutes. The results of these timeout methods in terms of F-Measure are shown in Figure 6. The results show that the best performance in term of F-measure is around 70%. The performance of the timeout method obviously depends on the timeout threshold. Different applications may have different best timeout thresholds. For the same application, the best threshold may also vary among different database connections or users. Even for the same user or connection, the interval between sessions can be different from time to time. In our particular application, a threshold value between 3 to 10 seconds leads to the best performance for the timeout method. This is different from Web applications where an optimal threshold is usually between 10 and 30 minutes [8, 3]. 4.3
Performance of Unsupervised N-gram Learning
For the unsupervised learning method, the whole data set is used as training data to estimate the probabilities in an n-gram model and D1 is used as the development set to tune the parameters. The trained model
4.4
Performance Learning
of
Supervised
N-gram
In the supervised n-gram based session detection method, the training data consist of well-separated sessions and the test data are not included in the training data. The results are shown in Table 4. It can be observed that the automatic parameter selection method performs almost the same as the exhaustive method and its performance is well above the average n-gram and the best timeout performance. 4.5
Performance of Semi-supervised N-gram Learning
In the semi-supervised learning method, the training data contain partially separated sessions, in which boundary words are used as session boundaries, but not all the session boundaries are identified. Similar to unsupervised learning, D1 is used as the development set to tune the parameters and the whole data set
Test Data D2 D3 D4
Number of Sessions True Estimated Correct 56 58 48 118 103 93 153 137 97
Auto 0.85 0.83 0.67
F-Measure Best n-gram Average 0.85 0.78 0.89 0.80 0.71 0.64
Best timeout 0.71 0.62 0.69
Table 3: The performance of the unsupervised method Test Data D1 D2 D3 D4
Number of Sessions True Estimated Correct 65 67 59 56 64 53 118 101 93 153 168 126
Auto 0.89 0.88 0.84 0.78
F-Measure Best n-gram Average 0.89 0.80 0.88 0.81 0.85 0.78 0.81 0.73
Best timeout 0.70 0.71 0.62 0.69
Table 4: The performance of the supervised method is used as training data to estimate the probabilities in an n-gram model. The results for the semi-supervised method are shown in Table 5.
0.95
4.6
0.75
TimeOut F-Measure
Unsupervised Supervised
0.9
Semi-Supervised
0.85 0.8
Comparison of All the Methods
In Figure 7, we compare all the methods in terms of Fmeasure. The results for the unsupervised, supervised and semi-supervised methods are the results from the automatic parameter selection method. The result for the timeout method on a data set is the best timeout result on that data set. Note that the timeout threshold for the best result may be different among the data sets. For example, the best timeout threshold for data set D1 is 5 seconds, while the one for D4 is 10 seconds. We can observe from the figure that the supervised learning method achieves the best results on all the test data sets; semi-supervised learning method is comparable to the unsupervised method on the first three data sets but is significantly better than the unsupervised method on data set D4 ; all the three n-gram methods are significantly better than the best timeout method (except on D4 the performance of the unsupervised method is slightly worse than that of the best timeout method). In general, we can say that, using the automatic parameter selection method, the n-gram based session identification method is significantly better than the timeout method, which has been the only method for database session identification.
5
Related Work
Several session identification methods have been reported in the literature, almost all of which are designed for identifying user sessions from Web logs. In Web applications, a session is defined as a sequence of requests made by a user for a single navigation purpose. The most common and simplest method for Web session identification is timeout. He and Goker [8] reported the results of experiments that used the timeout method on two sets of web logs. They concluded
0.7 0.65 0.6 0.55 0.5 D1
D2
D3
D4 Data Set
Figure 7: Comparison of All the Methods that a time range of 10 to 15 minutes was an optimal session interval threshold. Catledge and Pitkow [3] also reported the results of an experiment where a web browser was modified to record the time interval between user actions on the browser’s interface. One result was that the average time interval between two consecutive events by a user was 9.3 minutes. Assuming that the most statistically significant events occur within 1.5 standard deviations from the mean, 25.5 minutes was subsequently recommended as the threshold for session identification. However, the optimal timeout threshold clearly depends on the specific problem. Despite the application dependence of the optimal interval length, most commercial products use 30 minutes as a default timeout. The timeout method can be applied to both Web and database logs. According to [7], the timeout method is the only method provided by database vendors to keep track of sessions for electronic library database products. They reported that timeout values can vary widely between vendors, ranging from 7 to 30 minutes on average. Cooley et al. [6] proposed a method, called reference length, for Web transaction identification. The method uses histograms to analyze the time a user spends on Web pages and classifies the pages into content and auxiliary pages. A session boundary is detected whenever a content page is met. The problem with this method is that only one content page is included in
Test Data D2 D3 D4
Number of Sessions True Estimated Correct 56 53 47 118 122 98 153 150 116
Auto 0.86 0.82 0.77
F-Measure Best n-gram Average 0.88 0.80 0.88 0.80 0.78 0.70
Best timeout 0.71 0.62 0.69
Table 5: The performance of the semi-supervised method pervised, unsupervised, and semi-supervised, depending on the characteristics of the training data. If the training data consist of well-separated sessions, supervised learning can be used; otherwise, unsupervised or semi-supervised learning are used. This flexibility is an advantage of the language modeling method compared to other learning methods. In most real applications, boundary words do not exist or partially exist in the log data. Allowing “imperfect” training data makes the language modeling based method more applicable to real world problems. We have demonstrated that both unsupervised and semisupervised methods perform significantly better than the timeout method.
each session. This may not be a good model for real sessions since users may obviously look at more than one content page for a single retrieval purpose. In addition, this method can only be applied to Web logs. Another session identification method, referred to as maximal forward reference, is due to Chen et al. [5]. In this approach, each session is defined as the set of pages from the first page in a request sequence to the final page before a backward reference is made. A backward reference is naturally defined to be a page that has already occurred in the current session. Clearly, the method only applies to Web logs.
6
Conclusions
We have presented a language modeling based method for session identification and applied it to identify sessions from the workloads of an OLTP application. The paper makes the following contributions. 1. It presents a novel application that applies a new session identification method to the trace logs of a database system. The method is demonstrated to be significantly better than the standard timeout method for database session identification. 2. We propose solutions to the open issues in the original language modeling based session identification method. The issues were revealed when we first conducted the application. In particular, we propose a novel method for automatically selecting the entropy threshold and a method for automatically tuning the order of the n-gram model based on the data set. The performance of the proposed parameter selection method is demonstrated to be close to the best performance of the n-gram based method in which the parameters are selected through an exhaustive search and testing of a large number of combinations of parameter values. 3. New performance measures, namely F-measure and cross entropy, that have not been used to evaluate the performance of session identification, are proposed and used in our experiments. Previous work on language modeling based session identification indirectly evaluated the session identification results through the interestingness of the association rules discovered from the identification sessions [9, 10]. 4. We propose to use the language modeling method in any of three learning modes, namely, su-
The work presented in the paper has a broader impact on the database and data mining fields. Effective identification of user sessions enables us to discover useful user access patterns from the database workload. The discovered patterns can be used to predict incoming queries based on the queries already submitted, which can be used to improve the database performance by effective query prefetching, query rewriting and cache replacement. The improved session identification method can also be applied to Web logs to provide better, more accurate data for web log mining. The result of Web log mining can be used to improve Web design, to provide personalized Web service and to make personalized recommendations. Furthermore, effective session identification is important for compiling statistics on library electronic resource usage. This capability can offer potentially valuable information about how patrons make use of the library’s Web-accessible resources, which can result in significant change in the evaluation of library collections and user preferences. Session identification can also be valuable for OLAP applications. In the future, we plan to apply our session identification method to OLAP trace logs. We are also applying the method to DNA sequence analysis.
7
Acknowledgments
This work is supported by research grants from Communications and Information Technology Ontario (CITO) and the Natural Sciences and Engineering Research Council of Canada (NSERC).
References [1] Bahl, L., Jelinek, F. and Mercer, R.; (1983) A Maximum Likelihood Approach to Continuous Speech Recognition IEEE Transactions on Pattern Analysis and Machine Intelligence, 5(2), pp. 179-190. [2] Calzarossa, M. and Serazzi, G. Workload characterization: a survey. Proceedings of the IEEE, 81(8):1136-1150, August 1993. [3] Catledge, L. and Pitkow, J.; (1995) Characterizing Browsing Strategies in the World Wide Web, Proceedings of the 3rd International World Wide Web Conference. [4] Chen, S. and Goodman, J.; (1998) An Empirical Study of Smoothing Techniques for Language Modeling. Technical report, TR-10-98, Harvard University. [5] Chen, M.S., Park, J.S., and Yu, P.S., (1998) Efficient Data Mining for Path Traversal Patterns, IEEE Trans. on Knowledge and Data Engineering, Vol. 10, No. 2, pp. 209-221. [6] Cooley, R., Mobasher, B. and Srivastava, J. (1999) Data Preparation for Mining World Wide Web Browsing Patterns, Knowledge and Information Systems, Vol 1 (1). [7] Duy, J. and Vaughan, L.; (2003) Usage Data for Electronic Resources: A Comparison between Locally Collected and Vendor-Provided Statistics. The Journal of Academic Librarianship, Volume 29, Number 1, pages 16-22. [8] He, D. and Goker, A.; (2000) Detecting session boundaries from Web user logs, Proceedings of the 22nd Annual Colloquium on Information Retrieval Research. [9] Huang, X., Peng, F., An, A. and Schuurmans, D. (2003) Session Boundary Detection for Association Rule Learning Using N-Gram Language Models, Proceedings of the Sixteenth Canadian Conference on Artificial Intelligence (CAI-03), Halifax, Canada. 237-251. [10] Huang, X., Peng, F., An, A. and Schuurmans, D. (2004) Dynamic Web Log Session Identification with Statistical Language Model, to appear in Journal of the American Society for Information Science and Technology, Special Issue on Webometrics. [11] Katz, S.; (1987) Estimation of Probabilities from Sparse Data for the Language Model Component of a Speech Recognizer. IEEE Transactions on Acoustics, Speech and Signal Processing, 35(3). 400-401.
[12] Sapia, C. (2000) PROMISE: Predicting Query Behavior to Enable Predictive Caching Strategies for OLAP Systems, Proceedings of the Second International Conference on Data warehousing and Knowledge Discovery (DAWAK 2000), Greewich, UK. Springer Verlag, pp. 224-233. [13] Yao, Q. and An, A. (2003) Using User Access Patterns for Semantic Query Caching, Proceedings of the 14th International Conference on Database and Expert Systems Applications (DEXA’03), Prague, Czech Republic. 737-746. [14] Yao, Q. and An, A. Rewriting and Caching Queries by Using User Navigation Patterns, submitted for journal publication in 2004.