Acta Scientiarum http://www.uem.br/acta ISSN printed: 1806-2563 ISSN on-line: 1807-8664 Doi: 10.4025/actascitechnol.v36i3.21191
Applying regression models with skew-normal errors to the height of bedding plants of Stevia rebaudiana (Bert) Bertoni Terezinha Aparecida Guedes1*, Robson Marcelo Rossi1, Ana Beatriz Tozzo Martins1, Vanderly Janeiro1 and José Walter Pedroza Carneiro2 1
Departamento de Estatística, Universidade Estadual de Maringá, Av. Colombo, 5790, 87020-900, Maringá, Paraná, Brazil. 2Departamento de Agronomia, Universidade Estadual de Maringá, Maringá, Paraná, Brazil.*Author for correspondence. E-mail:
[email protected]
ABSTRACT. The experiment had the objective of fitting regression models to data of the height of the bedding plants cultivated in three multicellular Styrofoam trays with three different cell volumes. We proposed two types of models in the current experiment. First, we fit a model with normal errors and next a model with a skew-normal distribution of errors. The skew-normal regression was suitable for modelling both cases. First, when the model included the time covariate and next when the cell size covariate was part of the model. However, the value of the parameter for the multivariate model was very high, which is an indication that the skew-normal model is also not the best. Thus, we suggest further fitting using the skew regression model of t-Student. Keyword: skew-normal distribution, parameter estimation, regression with skew-normal errors.
Ajuste de modelos de regressão normal com erros assimétricos aplicados à altura de plantas de Stevia rebaudiana (Bert) Bertoni RESUMO. Este trabalho tem por objetivo ajustar modelos de regressão à dados de altura de plantas observados no tempo e cultivados em vasos de diferentes tamanhos. Dois tipos de modelos foram propostos, o modelo de regressão supondo normalidade dos erros e o modelo de regressão supondo erros com distribuição normal assimétrica. O modelo de regressão normal assimétrico mostrou-se mais adequado para a modelagem em duas situações, para o modelo somente com a covariável tempo e também, quando a covariável tamanho do vaso foi incluída no modelo. Todavia, o valor do parâmetro para o modelo multivariado foi muito grande, o que é um indicativo de que o modelo normal assimétrico também não seja o mais adequado. Nesta situação, sugere-se o modelo de regressão t-Student assimétrico. Palavras-chave: distribuição normal assimétrica, estimação de parâmetros, regressão com erros normais assimétricos.
Introduction Methods fitting skew-normal distribution were disseminated after Azzalini (1985) through a new class of skew-normal distribution, in which is also found the normal, although the first studies on the skew-normal distribution were reported by Roberts (1966), O´Hogan and Leonard (1976), Aigner et al. (1977), and Hill and Dixam (1982) decades before the proposition of Azzalini (1985). As the assumption of normal errors in linear regression is not satisfied in many data sets, the alternative has been the transformation of variables. However, transformation can make difficult the explanation of the experimental responses as argued by Azzalini and Capitanio (1999). Thus, this class of skew-normal distribution has been studied because of its robustness in parameter estimation of regression models without normal errors. Acta Scientiarum. Technology
Agronomically, the production of bedding plants of Stevia rebaudiana has been facing some constraints on the best stage of development necessary to allow the mechanical transplanting that requires a physical structure for using transplanting machinery as well as the determination of the best physiological development to impede early flowering at pre- and post-transplanting (CARNEIRO, 2007). The number of hours to induce the flowering stages is about 13 hours when the seedlings usually have four to five pairs of leaves (ZAIDAN et al., 1980). Stevia growers and practitioners under field conditions have difficulties in predict crop development. The early flowering of overgrown bedding plants reduces crop yield during the first growing period of the first growing season thereby reducing the net returns to Stevia growers in the crucial period of the crop establishment. Furthermore, the cell size of the Styrofoam trays Maringá, v. 36, n. 3, p. 463-468, July-Sept., 2014
Guedes et al.
464
also has influence on the time to flowering under field conditions. Thus, the determination of the best stage of development (CARNEIRO, 2007) is crucial for the success of crop establishment under field conditions where the bedding plant height is an important and complementary parameter during the early development of Stevia crops. The stages V2.i of the plant development indicates that bedding plants are growing under nursery conditions, and the letter i represents the number of nodes or pairs of opposite leaves with a length greater than 5 mm (CARNEIRO, 2007). The objective of the current experiment is to fit regression models to the height of bedding plants of Stevia rebaudiana (Bert) Bertoni growing in three types of Styrofoam trays with different cell volumes (CARNEIRO, 1990; CARNEIRO et al., 1997) during the stages V 2.i. Normal and skewnormal error assumption will be used to estimate the model parameters using maximum likelihood and Bayesian methods. Material and methods Material
The data set was collected from a glasshouse experiment carried out at the Iguatemi Research Station at the latitude of 23º25´S, longitude of 51º57´W, and 550 m altitude in the Universidade Estadual de Maringá, Northwestern Paraná State, Brazil. Pure germinating seeds of Stevia rebaudiana were sown on Styrofoam trays with inverted pyramid shape and cell volumes of 14, 35 and 112 cm3. These bedding plants were raised in the onfarm mixture of Dystrophic Red Latosol with 7% of laying hen manure (LHM). Previously, the fresh laying hen manure (LHM) was watered daily for 15 days on transparent plastic film for leaching the excess of salts and aerobic decomposition. Next, the manure was dried under sunlight and ground before amending the soil. Fluorescent daylight lamps (40W) were turned on to maintain the photoperiod above the 13 hours (THOMAS, 2006) and avoid the early flowering stages before the transplanting. The seedlings from every cell volume were daily pruned for two weeks to standardize the stages of development at the 15th day, because the Stevia seeds require about 10 days to complete the germination. The first harvest was carried out on the 15th day, when the seedlings had two pairs of leaves, or the V2.2 stage of development (CARNEIRO, 2007). Thereafter, the seedlings were harvested at 7 days intervals during a period of 57 days. The height of six bedding plants was measured using a professional steel ruler accurate to 1 mm. Acta Scientiarum. Technology
Methods Regression models with skew-normal errors
The fitting of statistical models using skewnormal regression is based on the definition of Azzalini (1985). Definition
A random variable Z has skew-normal distribution with the skew parameter if its density function is given by: f(z| λ )=2
(z) (λz), e z
(1)
where: (.) is the density function; (.) is the standard normal distribution with zero mean and variance 1. The designation of this distribution is Z ~ SN(λ) where λ controls the asymmetry. The expected value and the variance of Z are given by: E[Z] = cρ and Var[Z] = 1 - c2ρ2, in which c = 2 and ρ =
.
1 2
The density function given by equation (1) has mathematical properties that guarantee efficiency and quality of the statistical modelling as detailed by Azzalini (1985). The random variable Y is denoted by Y ~ SN(μ, σ2, λ) with the density function: f(y; μ, σ2, λ) =
2 y y , y, e e σ > 0 (2)
Considering a data set (y1, y2, ..., yn) with n independent observations from the variable Yi ~ SN(μi, σ2, λ), i = 1, 2, ..., n, where: Y depends on p covariables Xk, k = 1, 2, 3 ..., p, the relationship Y to Xk can be: Yi = β
p
0
βk x k εi , k = 1, 2, ..., p and i = 1, 2, ..., n k 1
(3)
where:
i ~ SN(0, σ2, λ). Therefore, i is a random variable with
location parameter zero (0) and scale σ2. Since E[ i ]= 2
σλ , for λ ≠ 0, consequently, the 1 λ2 Maringá, v. 36, n. 3, p. 463-468, July-Sept., 2014
465
Applying regression models with skew-normal errors p
estimate of Y, Yˆ ˆ 0 x kˆ k , has to be corrected k 1
to
ˆ ˆ x ˆ + 2 σλ . Y 0 k k 1 λ2 k 1 p
Thus,
the
parameter vector , σ and λ, or θ = (t,σ, λ), t = (0, 1, ..., p) ( p1 ) have to be estimated. Parameter estimation Maximum log likelihood method
The estimate of the parameter vector, θ = (t,σ, λ), should be carried out by maximum likelihood, which maximizes through numerical procedures, the logarithm of the likelihood function of the model (3) given by: n y X it n y X it log i (4) l(, , ) n log log i i 1 i 1
The estimation of maximum likelihood from the vector can be found by numerical methods that maximize the logarithm of the likelihood function given in (4). Bayesian method
Another estimation method is the Bayesian analysis where additional information about the parameters can be introduced by using a prior distribution as reported by Liseo and Loperfido (2006). The current experiment introduced noninformative prior distributions and the relationship Y to X was given by: Error model with normal distribution Yi =
p
β0 β k x k ε i , k 1
Yi ~ N( β
p
0
βk x k ,
2
);
k 1
Prior distribution
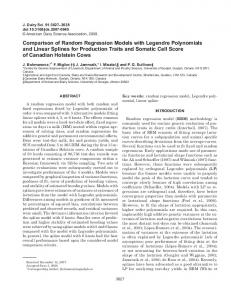
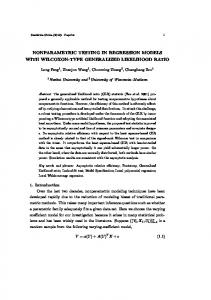
In Bayesian estimates we considered significant at 5% of probability the effects whose credibility intervals of the regression coefficients for a posterior means had no zero values. The posterior marginal distribution for all parameters was obtained by BRugs routine of the R software. The software generated 100,000 values using the MCMC chain (Monte Carlo Markov Chain), with a burn-in period of 10,000 initial values. Thereafter, through the jumps of 10 we selected a sample of 10,000 values. The chain convergence was verified by the CODA routine in the R software using the criterion of Heidelberger and Welch. Models as presented were applied to the data of bedding plant height (Yi), initially considering the covariate harvesting time (ti) and then including the covariate cell sizes (Vi) of the Styrofoam trays. Results and Discussion Hereafter, the current models will be nominated as uni- and multivariate, respectively. Figure 1 illustrates the scatter of height of these bedding plants during the harvesting time from all the different cell volumes. The three last harvesting of these bedding plants had a large scatter in the height as corroborated by data in Figures 3 and 4. These responses can be explained by the level of internode length of the overgrown seedlings. In the Figure 2, the growth responses over the harvesting time of the different cell volumes indicate taller plant grown in large cells. This figure shows that in larger cells some plants grow much more than others. This result may be explained by bedding plant physiological responses because of the container volume. 10
j ~ N(0, 106), j = 0, 1, 2; 2~ GI(103,103) Error model with skew-normal distribution
y β0 βk x k ; k 1
1 2
2;
prior distribution: , j ~ N(0, 106), j = 0, 1, 2; 2~ GI(103,103). In this model the 1´s method was applied because the parameter estimation consists of estimating the parameter of the probability distribution with skewed error using WinBUGS as detailed by Henze (1986). Acta Scientiarum. Technology
6
p
4
2
pi = 2 yi y yi y ;
Height (cm)
8
Yi ~ Bernoulli (pi);
0
10
20
30
40
50
60
Time (days)
Figure 1. Bedding plants height harvested at seven-day intervals from all the cell volumes of Styrofoam trays. Maringá, v. 36, n. 3, p. 463-468, July-Sept., 2014
466
Figure 2. Height of bedding plant from every cell volume of the Styrofoam trays (volumes of 14, 35 and 112 cm3).
Guedes et al.
Figure 5 shows that the largest discrepancy in the development of the bedding plants starts after the 36th day of growth at Styrofoam trays with cell volumes of 35 and 112 cm3. The explanation rests on the data description by a distribution with skewed tail than that found in the normal distribution. These results suggested that the models were based on the characteristics as indicated by fitting the uni- and multivariate models (Table 1). The best fitting either by the linear regression or using the linear multivariate regression, both evaluated by DIC criterion, was found applying the skewed-normal error distribution.
Figure 5. Profile of Stevia bedding plants growing in three different cell volumes of Styrofoam trays in every harvesting time. Figure 3. Profile of Stevia bedding plants growing in different cell volumes of Styrofoam trays and harvested in different times to investigate the seedling length.
Figure 4. Bedding plant height over harvesting time. Acta Scientiarum. Technology
The residual normality assumption from fitting regression models with normal errors was not satisfied as reported in the Figures 6 and 7. The regression model with univariate skewnormal error had a high positive value for the asymmetric parameter () meaning a positive asymmetry (Table 1). Based on the prediction intervals, the estimates of the parameter for both models are large and significant indicating asymmetric data. The most probable explanation is that height alone as seen in nursery stocks is not so good as the stages of development (CARNEIRO, 2007) because the competition for light and the container volume have strong influence on the individual development of the bedding plants. However, some authors have suggested for high values of () that the asymmetric t-Student model should have preference to the normal asymmetric. Maringá, v. 36, n. 3, p. 463-468, July-Sept., 2014
467
Applying regression models with skew-normal errors Table 1. Fitting of univariate and multivariate regression models. Model Regression Model with normal error DIC = 431.1 Regression Model with NA errors DIC = 388.7 Multivariate Regression model with normal errors DIC = 366.3 Multivariate Regression model with NA errors DIC = 347.3
Parameter
0 1 0 1 0 1 2 0 1 2
Estimate by maximum loglikelihood -1.4987 0.1257 1.4340 -0.7993 0.0619 11.3297 2.2614 -2.8468 0.1327 1.1613 1.0900 -3.0720 0.1104 0.8951 4.3891 1.6929
Mean -1.503 0.126 1.444 -2.600 0.059 19.770 2.321 -2.847 0.133 1.161 1.097 -3.066 0.109 0.902 5.872 1.764
Estimates by Bayesian method Standard Error MC p2.5% Deviation 0.3695 0.0050 -2.2240 0.0098 0.0001 0.1063 0.0941 0.0009 1.2740 0.2972 0.0089 -3.2480 0.0086 0.0031 0.0457 15.0100 0.8298 5.9360 0.1675 0.0044 2.0130 0.3176 0.0046 -3.4700 0.0075 0.0001 0.1181 0.1254 0.0013 0.9169 0.0740 0.0008 0.9667 0.4123 0.0160 -3.8750 0.0100 0.0004 0.0905 0.1271 0.0050 0.6582 3.1410 0.1945 2.4310 0.1593 0.0065 1.4780
K-S Test Median
p97.5%
-1.5000 0.1257 1.4390 -2.5730 0.0589 14.5400 2.3150 -2.8480 0.1328 1.1600 1.0930 -3.0540 0.1081 0.9019 4.9800 1.7570
-0.7715 0.1449 1.6410 -2.1160 0.0778 62.0500 2.6740 -2.1210 0.1476 1.4080 1.2580 -2.2820 0.1283 1.1570 14.8200 2.0950
p-value
2.2 10-16
1.4 10-6
2.2 10-16
0.1234
Figure 6. Residual distribution (left) and QQ-plot (right) from fitting the univariate model considering a normal error distribution.
Figure 7. Residual distribution (left) and QQ-plot (right) from fitting the multivariate model considering a normal error distribution. Acta Scientiarum. Technology
Maringá, v. 36, n. 3, p. 463-468, July-Sept., 2014
Guedes et al.
468
Conclusion Linear regression with normal error may be an alternative method to model the height of Stevia bedding plants growing in different cell volumes of Styrofoam trays during the stages V2.i. The multivariate model with skew-normal errors is more reliable than the model with normal errors because it improves the goodness of fit. The parameters of the models are similar for both methods of estimation except for the asymmetric parameter, which showed the greatest lack of data normality from the Bayesian method. References AIGNER, D.; LOVELL, C.; SCHMIDT, P. Formulation and estimation of stochastic frontier production function model. Journal of Econometrics, v. 6, n. 1, p. 21-37, 1977. AZZALINI, A. A class of distributions which includes the normal ones. Scandinavian Journal of Statistics, v. 12, n. 2, p. 171-178, 1985. AZZALINI, A.; CAPITANIO, A. Statistical applications of the multivariate skew-normal distribution. Journal of the Royal Statistical Society, Series B, v. 61, n. 3, p. 579-602, 1999. (Series B). CARNEIRO, J. W. P. Stevia rebaudiana (Bert) Bertoni: produção de sementes. Maringá: Fundação Universidade Estadual de Maringá, 1990. CARNEIRO, J. W. P.; MUNIZ, A. S.; GUEDES, T. A. Greenhouse bedding plant production of Stevia rebaudiana (Bert) Bertoni. Canadian Journal of Plant Science, v. 77, n. 3, p. 473-474, 1997. CARNEIRO, J.W.P. Stevia rebaudiana (Bert) Bertoni: stages of plant development. Canadian Journal of Plant Science, v. 87, n. 4, p. 861-865, 2007.
Acta Scientiarum. Technology
HENZE, N. A. probabilistic representation of the skew-normal distribution. Scandinavian Journal of Statistics, v. 13, n. 4, p. 271-275, 1986. HILL, M. A.; DIXAM, W. J. Robustess in real life: a study of clinical laboratory data. Biometrics, v. 38, n. 2, p. 377-396, 1982. LISEO, B.; LOPERFIDO, N. A note on reference priors for the scalar skew-normal distribution. Journal of Statistical Planning and Inference, v. 136, p. 373-389, 2006. O´HOGAN, A.; LEONARD, T. Bayes estimation subject to uncertainty about parameter constraints. Biometrika, v. 63, n. 1, p. 201-202, 1976. ROBERTS, C. A correlation model useful in the study of twins. Journal of the American Statistical Society, v. 61, n. 316, p. 1184-1190, 1966. THOMAS, B. Light signals and flowering. Journal Experimental Botany, v. 57, n. 13, p. 3387-3393, 2006. ZAIDAN, L. B. P.; DIETRICH, S.M.C.; FELIPPE, G.M. Effect of photoperiod on flowering and stevioside content in plants of Stevia rebaudiana Bertoni. Japanese Journal of Crop Science, v. 49, n. 4, p. 569-574, 1980.
Received on June 18, 2013. Accepted on January 13, 2014.
License information: This is an open-access article distributed under the terms of the Creative Commons Attribution License, which permits unrestricted use, distribution, and reproduction in any medium, provided the original work is properly cited.
Maringá, v. 36, n. 3, p. 463-468, July-Sept., 2014