Email: {tyltheng, ashlgoh, nataliepang, patriciawong} @ntu.edu.sg. *Centre for ... Email: {aseplim, aszhliu, yinming} @ntu.edu.sg. Mailing Address for Reprint ...... At the time of the evaluation however, a critical mass of resources had not yet.
Theng, Y.L., Goh, D.H., Lim, E.P., Liu, Z., Ming, Y., Pang, N.L.S., and Wong, P.B. (2005). Applying scenario-based design and claims analysis to the design of a digital library of geography examination resources. Information Processing and Management, 41(1), 23-40.
Applying Scenario-Based Design and Claims Analysis to the Design of a Digital Library of Geography Examination Resources
Yin-Leng Theng, Dion Hoe-Lian Goh, *Ee-Peng Lim *Zehua Liu, *Ming Yin, Natalie Lee-San Pang and Patricia Bao-Bao Wong
Division of Information Studies School of Communication and Information Nanyang Technological University 31, Nanyang Link, Singapore 637718 Tel. No. : (065) 6790-5834 Fax No. : (065) 6791-5214 Email: {tyltheng, ashlgoh, nataliepang, patriciawong} @ntu.edu.sg
*Centre for Advanced Information Systems School of Computer Engineering Nanyang Technological University Nanyang Avenue, Singapore 639798 Tel. No. : (065) 6790-4802 Fax No. : (065) 6792 6559 Email: {aseplim, aszhliu, yinming} @ntu.edu.sg
Mailing Address for Reprint Yin-Leng Theng Division of Information Studies School of Communication and Information Nanyang Technological University 31, Nanyang Link, Singapore 637718
Acknowledgements The authors would like to thank the students at Yio Chu Kang Secondary School for their participation and ideas. The project is partially supported by the SingAREN 21 research grant M48020004. An earlier version of the paper was presented at the 5th International Conference on Asian Digital Libraries held in Singapore, December 11-14, 2002, and published in the conference proceedings by Springer-Verlag.
2
Abstract
This paper describes the application of Carroll’s Scenario-based Design and Claims Analysis as a means of refinement to the initial design of a digital library of geographical resources (GeogDL) to prepare Singapore students to take a national examination in geography. GeogDL is built on top of G-Portal, a digital library providing services over geospatial and georeferenced Web content. Beyond improving the initial design of GeogDL, a main contribution of the paper is making explicit the use of Carroll’s strong theory-based but undercapitalized Scenario-based Design and Claims Analysis that inspired recommendations for the refinement of GeogDL. The paper concludes with an overview of the implementation of some of the recommendations identified in the study to address “usability” and “usefulness” design issues in GeogDL, and discusses implications of the findings in relation to geospatial digital libraries in general.
Keywords Geospatial digital libraries, Scenario-based Design, Claims Analysis, usability, usefulness.
3
1
GeogDL : Design Philosophy and Initial Design Choices
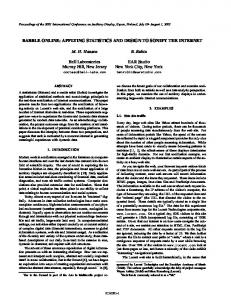
GeogDL (Chua et al., 2002) is a Web-based digital library application containing past-year examination questions and solutions supplemented with additional geographical content. GeogDL is built above GPortal (Lim et al., 2002), a digital library providing services over geospatial and georeferenced Web content. In GeogDL, past-year examination questions (with their solutions) are created as separate G-Portal projects, which are user-defined collections of related resources. Resources within projects are further organized into layers which allow finer-grained organization of content. Each project consists of Web resources, at least one of which contains the solution to the question. Other resources contain information on related topics and are used as supplementary material for further exploration. Resources may be further organized into layers depending on the needs of the teacher. For example, the solution to an equatorial region question could appear as a resource in a layer while a separate layer might contain supplementary vegetation resources found in equatorial climates. In the initial version of GeogDL (see Figure 1), examination questions are first accessed through the classification interface that organizes questions by year. Upon selection of a question, the associated project, its resources, and the corresponding map are loaded. Currently, resources are divided into three categories: question, solution and supplementary resources, each of which is accessible separately via the classification interface.
Insert Figure 1
2
The Study
We wanted to design GeogDL with and for students taking a Singapore national examination in geography, the Singapore-Cambridge GCE Ordinary Level (Subject 2232) level geography examination (see http://www.moe.edu.sg/exams/syllabus/2232.pdf, retrieved May 28, 2003), with a strong underpinning of user-centred design rationale. 4
This paper reports a study conducted on GeogDL by engaging a group of intergenerational partners involving designers, secondary school students and usability-trained evaluators for the purposes of reinforcing and/or refining the initial design of GeogDL using Carroll’s Scenario-based Design and Claims Analysis (Carroll, 2000). The paper focuses on the re-design decisions and tradeoffs made to improve the initial design of GeogDL, a follow-up of the study described in (Theng et al., 2002). In order that the methods and findings of the study provide a background for the design issues and decisions made in this paper, we also will provide a brief description of the study as reported in (Theng et al., 2002). Beyond summarizing the design of GeogDL, a main contribution of the paper is making explicit the use of Scenario-based Design and Claims Analysis that inspired recommendations for the refinement of the initial design of GeogDL. The remainder of this paper discusses the implications of the findings in relation to design and implementation issues for GeogDL as well as geospatial digital libraries (DLs) in general.
2.1
Scenario-based Design and Claims Analysis
Our study was inspired by Carroll’s work on the task-artifact cycle, and on user-centred strategies such as Scenario-based Design and Claims Analysis (Carroll, 2000). The task-artifact cycle explains why design is never completely “done”. At the start of any software development, tasks help articulate requirements to build artifacts, but designed artifacts create possibilities (and limitations) that redefine tasks. Hence, managing the task-artifact cycle is not a linear endeavour with starting and ending points (Carroll, 2000). There will always be a further development, a subsequent version, a re-design, a new technology development context. The design scenarios at one point in time are the requirements scenarios at the next point in time. Carroll (2000) stresses the importance of maintaining a continuous focus on situations of and consequences for human work and activity to promote learning about the structure and dynamics of problem domains, thus seeing usage situations from different perspectives, and managing tradeoffs to reach usable and effective design outcomes. Claims Analysis was later developed by Carroll (2000) to enlarge the scope of the Scenario-based Design approach to provide for more detailed and focused reasoning. Norman’s influential model of 5
interaction (Norman, 1988) is used as a framework in Claims Analysis for questioning the user’s stages of action when interacting with a system in terms of goals, planning, execution, interpretation and evaluation.
2.2
Experimental Protocol
We engaged a group of intergenerational partners involving secondary school students, designers and usability-trained evaluators. The concept of intergenerational partnership is that design partners of varying ages, needs, expectations and experience negotiate design decisions, and is especially crucial in systems designed for children and teenagers (e.g., Druin et al., 2002; Theng et al., 2002). One of the challenges of this kind of partnership is for children/teenage users to trust adult designers to listen to their contributions. Druin et al. (2002) found that this kind of idea-elaboration process takes time to develop, but they found it to be extremely important to work towards in a design partnership, and hence towards a better design that would cater to the needs of the prospective children/teenage users.
Brainstorming session among usability-trained evaluators and designers Four usability-trained evaluators were involved in the study. Two of the evaluators were Masters of Information Studies students at Nanyang Technological University (NTU, Singapore) who had completed a course on Human-Computer Interaction (HCI) with a working knowledge on Scenario-based Design and Claims Analysis. The other two evaluators were lecturers at NTU who taught HCI and Systems Analysis/Design, respectively. Since there is little literature available on the practicalities of applying Claims Analysis to evaluate and improve the usability of DLs (Keith et al., 2002), the evaluators met for a brainstorming session prior to the sessions with the student design partners to make and agree upon the procedures in carrying out Claims Analysis (Carroll, 2000).
Identifying possible goals or scenarios of use of GeogDL To situate Claims Analysis within the context of use, the session began with the evaluators identifying the possible goals or scenarios of use that prospective users might have when using GeogDL.
6
Ellington et al. (1995) propose four basic factors to match the natural learning processes of humans, and thus ensure the successful learning experiences of learners by: (F1) making learners want to learn; (F2) incorporating sufficient activities to help learners experience learning by doing; (F3) providing sufficient channels of feedback to learners; and (F4) enabling learners to digest and relate what they have learned to the real world. Since the main goal of GeogDL is to help students prepare or revise for the GCE ‘O’ level geography examination, the following sub-goals were postulated to provide the possible scenarios of use with the inclusion of the four basic factors proposed by Ellington et al. (1995) for successful learning experiences of learners: •
Goal #1: Practice/revision on multiple-choice (MCQs), short structured and essay-type questions. Model answers and hints to tackle these questions also should be provided (applying F2). Feedback should be provided (applying F3).
•
Goal #2: Trends analysis. The idea is to give information on when and what questions are being asked over the years. This would help students identify trends in the types of questions asked and the topics covered. This may increase their motivation to want to learn (applying F1).
•
Goal #3: Mock exam. This would help students better manage their time in answering questions. To make it fun, a scoring system could be incorporated for MCQs (applying F4), while hints/model answers could be provided for structured and essay questions (applying F3).
•
Goal #4: Related links and resources. This could include related topics, teachers’ recommendations, etc., thus showing relationships of concepts, and linking concepts to the real world (applying F4). To protect against potential distortion of the scenarios, the above four sub-goals or scenarios of use
were validated with the two designers of GeogDL. Designer 1 was in charge of the architecture of GPortal, while Designer 2 was in charge of populating GeogDL with geography examination resources. At the time of carrying out this study, only Goals #1 and #2 were implemented. Goals #3 and #4 are currently being implemented. Therefore, for the purpose of this study, we were only interested to examine GeogDL in terms of Goals #1 and #2. In identifying the scenarios of use with good coverage
7
and minimal bias, we made use of the participatory design approach where prospective users were involved as design partners.
Sessions with student design partners A group of eight secondary students (ages 13 – 15 years), consisting of four boys and four girls, were invited as design partners. The boys (denoted as S1 to S4) were 13 – 14 years old, and were generally more confident Web users than the girls. They rated themselves as intermediate to advanced users, spending a considerable amount of time everyday on the Web, ranging between two and six hours, playing games, emailing or chatting with friends. Except for S2, all believed that their searching/browsing skills are commensurate with their usage of the Web. S2, though a self-believed advanced Web user, thought of himself a novice in searching/browsing on the Web. The boys rated themselves as novice or intermediate in terms of library searching/browsing skills. Although the girls were one year older than the boys, they were comparatively less confident Web users. The reason, according to a teacher of the school, was that the girls did not have the benefits of being introduced to simple HTML/XML programming in the revised lower secondary curriculum. The girls (denoted as S5 – S8) rated themselves as novice or intermediate users of the Web. They used the Web mainly for emailing or chatting with friends. Except S5 who rated herself “intermediate”, the rest of the girls rated themselves novices and commented that their searching/browsing skills were “poor”. Similar to the boys, library searching/browsing skills were not good, ranging from novice to intermediate. The purpose of the session was to reinforce the initial design and/or gain insights from what the student design partners said they wanted or what they wanted, as a means of refinement of the initial design. The session with the four girls was held in the morning while the session with the four boys in the afternoon, each lasting approximately two hours. Every student was assigned to one usability evaluator, and they were asked to carry out a Claims Analysis on either Goals #1 or #2.
8
The session was divided into three parts. Part 1 began with getting to know the students in terms of their experience with Web-based interfaces, searching/browsing skills and study habits. The interview session ended with a discussion on the possible scenarios of use for students preparing for the GCE ‘O’ level geography examination. Part 1 lasted approximately forty-five minutes. The evaluators stepped through GeogDL with the students responding to the stages of actions when interacting with GeogDL in Part 2 of the session. They were asked to identify the positive outcomes as well as negative consequences of the features provided in GeogDL in supporting either Goals #1 or #2. Part 2 also lasted approximately forty-five minutes. In Part 3, all four students together with the four evaluators congregated for a focus group discussion. The purpose was to confirm and/or refine the four goals identified by the evaluators described earlier, and brainstorm, if any, other goals that students might have when preparing/revising for GCE ‘O’ level geography examination. 2.3
Findings and Analyses
Since we were interested in how users complete a task successfully, we made use of the method “questioning stages of actions” to elicit claims about the design of GeogDL. In this method, theories of human activity were thought to be effective in facilitating systematic questioning. Based on Norman’s execution-evaluation cycle, Carroll (2000) developed a set of questions as a heuristic for comprehensively interrogating the tradeoffs implicit in scenarios. We modified the original set of questions designed by Carroll (2000) to make them specific to the goals in question and also in simpler English so that the student designers could understand the questions. For example, the original question “How does the artifact evoke goals in the user?” was modified to reflect Goal #2 (Trend analysis), and was changed to “How does the system (screen) help you to decide what to do to analyse trends or spot questions?”
Capturing and analyzing students’ responses The students performed iterative walkthroughs of the system together with the respective evaluators to achieve Goals #1 or #2. This was done by questioning stages of actions in Norman’s executionevaluation model of task completion broadly divided into three phases: 9
•
Before executing an action. This phase intends to prompt claims on the design before users perform an action. Two stages of users’ actions that address formation of goals (Stage 1a) and planning (Stage 1b) are involved. A total of seven questions were used to prompt claims.
•
When executing an action. This phase (Stage 2) obtains claims by questioning users on how well the system helps them to perform the action. We used two questions instead of the original three in Carroll’s set because we felt that one of the questions was redundant.
•
After executing an action. Two stages (Stage 3a and 3b) prompt users to interpret system’s response and evaluate the system’s effectiveness in helping to complete a goal. We appended to the original list questions that address also Nielsen’s well-established design heuristic (Nielsen, 1994). A total of twelve questions were asked. For each scenario of use, evaluators helped the students to step through the above five stages by
framing their goals (Goals #1 or #2 in our study), taking action, interpreting the consequences of their actions, and evaluating action consequences with respect to the instigating goals. Owing to space constraints, we are not able to show all eight students’ responses to the twenty-one questions for all the five stages. As an illustration, Table 1 shows S6’s comments in response to the three questions asked in the Goal Stage (Stage 1a) for Goal #2 (Trends analysis). Columns 2 and 3 record S6’s claims, highlighting positive consequences or negative consequences/risks, respectively. The rest of the students’ responses were constructed in this manner. Insert Table 1
Analyzing design consequences Since students’ comments were made in response to the design of GeogDL where the method of operation was not fully predictable, and where the students were not completely novices in the use of Web-based interactive systems, we turned to the following well-accepted design heuristics to categorize students’ comments (e.g., Preece et al., 1994). We made these assumptions: students’ comments with positive consequences suggest compliance with the design heuristics (see Table 1, Column 2); while comments with negative consequences/risks indicate violation of design heuristics (see Table 1, Column 3). 10
By categorizing all eight students’ comments in this manner, a list of claims with positive outcomes in relation to design heuristics was generated (see Table 2). Table 3 shows combined students’ comments on the negative consequences/risks violating design heuristics, obtained from similar tables like Table 1. Unless properly dealt with, negative consequences/risks could potentially affect usability of a system (Carroll, 2000). Section 3 discusses recommendations made to GeogDL to eliminate or at least alleviate the negative consequences or risks imposed by these current features that might hinder the completion of Goals #1 and 2. Section 4 describes the implementation of recommendations of GeogDL to address the “usability” and “usefulness” design issues. Insert Table 2 Insert Table 3
3
From Analysis to Recommendations for Refinement of Initial Design
In this section, we identified areas for refinement grouped according to violations against the following design heuristics (see Table 3): 1. Diagnosis and recovery from error. Students’ Comments: Comments such as “don’t know what to do or how to proceed” were common. Recommendations: An examination of GeogDL showed that no error messages were provided. Error messages should be clear, indicating precisely the problem, and constructively suggesting a solution. 2. Visibility of system status. Students’ Comments: “I’m not sure if I have completed my goal”; etc. Recommendations: The system should always keep users informed of what is going on through appropriate feedback within reasonable time. The student was not sure whether she had already accomplished the goal. She expected something different and not just a question with a phrase to signify the types of questions asked. 3. Match between system and real world.
11
Students’ Comments: “I’m not sure what to do”; “lack of a legend on the map, which failed to provide linkages to topics”; “mouse-over text is also missing to provide context to potential mouse clicks”; etc. Recommendations: Real-world conventions should be followed, making information appear in a natural and logical order. Instead of a map-based interface only, a list of questions could be created as a point of access to GeogDL. The map should not be the main window. There could be graphical representations of occurrences of questions, and information should be organized by topic. A legend should be provided on the map. 4. Control and freedom for users. Students’ Comments: “Lack of a clear map between different features in the system (e.g., questions and relationship to map)”; “don’t know how to exit”; etc. Recommendations: Users often choose system functions by mistake. They need a clearly marked “emergency exit” to leave the unwanted state without having to go through an extended dialogue. Perhaps an explorer-like presentation to organize different information and content could be implemented in GeogDL. Users would be familiar with its use, and also be able to tell at a glance, the relationships between different functions in GeogDL. 5. Consistency and standards. Students’ Comments: “Links are not designed using Web formats” Recommendations: Users should not have to wonder whether different words, situations, or actions mean the same thing. Platform convention should be followed. It is recommended that GeogDL be designed using the standards of the Web – as it is perceived by the users that GeogDL is a Webbased system (using Internet Explorer to access the system). Icons and taxonomy used also should be that of the Microsoft Windows environment to increase acceptance and familiarity. 6. Recognition rather than recall. Students’ Comments: “I don’t know how to start using GeogDL”; etc. Recommendations: Objects, actions and options should be made visible. The user should not have to remember information from one part of the dialogue to another. Instructions for use of the system 12
should be visible or easily retrievable whenever appropriate. Students were unable to identify with the newness of the geospatial-like interface in GeogDL. Perhaps a virtual tour of the system would be useful, which also can be supported with careful implementation and training. 7. Flexibility and efficiency of use. Students’ Comments: “There is a lack of instructions and explanatory notes to help me to navigate”; “No indication that it is the final screen. Found the question window by mistake”; “Overlapping windows causes confusion”; etc. Recommendations: Help could be provided to users by giving instructions and explanatory notes. GeogDL also should provide feedback to users when the final screen has been reached by providing ‘previous’ or ‘next’ buttons. Interface should be re-designed such that windows are neatly arranged to make GeogDL more efficient and flexible to use. 8. Minimalist design. Students’ Comments: “Too many windows opened, causes confusion”; etc. Recommendations: Dialogues should not contain information which is irrelevant or rarely needed. Every extra unit of information in a dialogue competes with the relevant units of information and diminishes their relative visibility. Design could be improved by integrating certain functions together in one window. 9. Speak the user’s language. Students’ Comments: “I don’t understand what windows ‘layers’ do”; etc. Recommendations: System should speak the user’s language with words, phrases and concepts familiar to the user, rather than using system-oriented terms. “Legend” could be used instead since this term is familiar to geography students used to reading maps and atlases. 10. Help and documentation. Students’ Comments: “There is a lack of help and documentation”; etc. Recommendations: Even though it is better if the system can be used without documentation, it may be necessary to provide help and documentation. Any such information should be easy to search, focused on the user’s task, listing concrete steps to be carried out, and not be too large. A virtual tour
13
of the whole system could aid users’ exploration and familiarization with the system. A help mascot, as suggested by the students, could monitor and guide users’ actions. 11. Provide shortcuts. Students’ Comments: “No shortcuts available for more experienced users”; etc. Recommendations: The features that make a system easy to learn such as verbose dialogues and few entry fields on display are often cumbersome to experienced users. Clever shortcuts, unseen by novice users, often may be included in a system that caters to both experienced and inexperienced users. Shortcut buttons/quick jump menus could be designed for experienced users. 12. Links to related concepts. Students’ Comments: “No references are made to the map”; “Climate identification on map is not related to similar topics, questions, and has no references to links”; “No other links from the questions exist, to also prompt for further exploration”; etc. Recommendations: To help users achieve a successful learning experience, not only should information appear in a natural and logical order, but inter-connectivity between concepts also should be captured. Perhaps there should be links and references to the map. The map interface also should tell users ‘where’ they are. This is to allow users to see in an organized fashion the organization and taxonomy of the GeogDL map. A suggested list of related links from each section for further exploration by users could be created. Also, links should be provided to the model solutions of questions, and to tips from teachers in answering such questions/similar questions; etc.
4
On-Going Work: Implementation of Recommendations
Knowing where in GeogDL users run into problems, or the kinds of problems users are likely to encounter, gives a good indication of what needs to be changed, and how to make it better in the next version. Failure to do so will render designers incapable of substantiating claims of improvements in system development (Lindgaard, 1994). Since design guidelines are primarily employed in system and interface evaluation (Henniger, Haynes and Reith, 1995), this paper describes a study involving Scenariobased Design and Claims Analysis to address system and interface issues in GeogDL to identify “usefulness and usability” problems. 14
The division between usefulness and usability is blurred owing to differing views held by researchers. The majority of usability studies focus on user performance in terms of learnability, throughput and users’ attitudes because they are the easiest characteristics to measure (Preece et al., 1993; Shackel, 1991; etc.). However, Landauer (1995) argues that although these measurements, commonly referred to as usability metrics, are intended to measure the ease of use of a system, in reality it is difficult to pinpoint if the failure is due to it being “hard to use because it isn’t useful?” or “is it useless because it is hard to use?”. Booth (1989) suggests that because users only use systems if they match their goals, the measurement of how good a system is, should reflect both its usability and usefulness. Lingaard (1994) strongly disagrees that unlike usability, it is impossible to quantify the usefulness of a system, in terms of the extent of coverage of users’ tasks supported by the system. This is contentious but this paper makes a distinction between usability and usefulness. A system is “useful” if it covers adequately the range of tasks it intends to support. A system is “usable” in relation to user’s performance in the specific tasks supported by the system, and the user’s attitude towards the system. This is on-going work for us implementing modifications to the initial design of GeogDL. In the following sections, we describe our efforts implementing refinements to the initial design, in terms of “usefulness” and “usability”. In Section 5.1, we address the “usefulness” issues. In refining the goals, we made slight modifications to the GeogDL architecture as described in Section 5.2. Section 5.3 highlights the modifications made to address the “usability” issues identified in the study.
4.1
Addressing “Usefulness” Issues
As for usefulness, we agree with Lingaard (1994) that its attainment is measured in reference to system specifications and not only on user performance testing. In this preliminary study, we evaluated GeogDL’s usefulness by brainstorming with subjects and confirming the goals of GeogDL as a DL of geographical resources to prepare Singapore students to take a national examination in geography. Following subjects’ reinforcement of the four goals of GeogDL (see Section 2.2.1), the designers of GeogDL further enhanced the functionality of GeogDL by making the specifications of the goals more 15
focused, catering to the needs of the prospective users. At the point of writing, only Goals #1 and #2 were being enhanced. Goal #1 : Practice/Revision The practice and review module (see Figure 2) developed in GeogDL allows users to attempt individual questions, review answers and peruse related supplementary content. These are retrieved by the browse and search service. Using this service, students can either browse a hierarchically organized list of questions modeled after the geography syllabus or perform fielded searches on the metadata database. As students interact with these modules, access to each question is logged into the question statistics database which keeps track of overall usage patterns much like Web server access logs. This database also maintains distribution data for individual topic areas. Insert Figure 2
Goal #2 : Trend Analysis Although trend analysis is sometimes frowned upon by teachers, it is much loved by students as a revision aid. In essence, trend analysis involves sifting through past-year examination questions to determine the likely questions (or topic areas) that will appear in the current examination. It is not surprising then that students in the study overwhelmingly voted to have this feature included in GeogDL. GeogDL’s trend analysis tool (see Figure 3) provides statistics on topic areas that appear within a userspecified range of years. These are generated using metadata associated with each examination question. Topic areas are based on the geography syllabus and users have various options for viewing their trends. For example, users may either choose a coarse-grained distribution display (for example, number of questions appearing under the “natural vegetation” category) or a finer-grained display (for example, questions appearing under the “vegetation types” sub-category in “natural vegetation”). The display also shows the distribution of the type of questions (multiple-choice or essay) that appear under a particular category or sub-category. Selection of a particular category or sub-category will cause GeogDL to retrieve and display the associated questions together with their answers and supplementary content. Insert Figure 3
16
4.2
Refinement of the GeogDL Architecture
Figure 4 shows the revised GeogDL architecture (see Figure 4) with the creation of two new components to realize Goals #1 and #2 : (1) resource and metadata tool consisting of the “question database” and “metadata database”; and (2) question statistics database. The question database stores examination resources (questions, answers and supplementary content) while the metadata database stores metadata for these resources. The question statistics database provides statistics on questions that are repeated across previous examination papers. Insert Figure 4
4.3
Addressing “Usability” Issues
With regard to usability, Scenario-based Design and Claims Analysis were employed to interrogate design claims for positive and negative consequences, classified with established design heuristics to cover categories of usability defects, for example, screen design, terminology and system information, system capabilities and user control, navigation, and completing tasks. In this section, we described the twelve areas of refinement to GeogDL addressing violations against the following design heuristics as mentioned in Section 3. 1. Recommendation #1 : Diagnosis and recovery from error The initial design of GeogDL provided an unstructured environment where users explored for resources using the map-based interface. Problems arose because users found this mode of interaction unfamiliar, resulting in situations where no relevant resources were retrieved. Since unfamiliarity is technically not an error, users were frustrated because the system did not provide any indication of why this problem occurred nor how to resolve it. In the new version of GeogDL (see Figure 2), users locate resources of interest using more familiar modes of interaction. Nevertheless, errors may still occur and appropriate messages have been introduced to help users recover from them. For example, if a query results in zero hits, the system might suggest that different query terms be used. 2. Recommendation #2 : Visibility of system status
17
This issue is related to Recommendation #1. As discussed, the unfamiliar mode of interaction caused confusion in some users resulting in uncertainty over the successful completion of their goals. The lack of error messages displayed during the course of users’ interaction with the system probably compounded this problem as well. With the re-design of GeogDL, users are more likely to see feedback that indicates the success or failure of a goal. In the practice/review module (see Figure 5), users are immediately able to see the results of their queries for examination resources. In the trend analysis module, feedback is provided via the display of distribution data as users manipulate the module’s resource selection controls (see Figure 5). 3. Recommendation #3 : Match between system and real world Revisiting a familiar theme, users were unsure of what to do because they were not used to interacting with a map. The main point of access to GeogDL is no longer the map-based interface. The interface to GeogDL now resembles a traditional GUI application that most users are familiar with. Access to examination resources is done though manipulating familiar controls such as buttons, check boxes, text fields, and list boxes (see Figure 5). The map is a secondary point of access for users to explore content related to examination resources. 4. Recommendation #4 : Control and freedom for users GeogDL’s map-based interface provided an unstructured environment for exploration of examination resources. Users were unaccustomed to this level of freedom and often ended up “lost” in the map or “stuck” within one of the many overlapping windows. These problems have been partially addressed through the judicious use of windows. Specifically, most user interactions now occur within a single window that organizes content using tabs and split panes (see Figure 5). Overlapping windows are used only for messages and dialogs boxes. A single point of access allows users to recover more quickly from dead-ends and unwanted paths.
Insert Figure 5
5. Recommendation #5 : Consistency and standards 18
Although GeogDL is not a Web-based application, many users perceived it as such because being a Java applet, it is accessible through a Web browser. Consequently, users were observed to be confused and even frustrated when their expectations for GeogDL as a Web application were not met. This problem has been addressed by the re-design of GeogDL to sport a more traditional GUI look-and-feel. Further, Web standards are followed where necessary. For example, when displaying resource content in GeogDL, links to related resources look and behave like Web links. 6. Recommendation #6 : Recognition rather than recall Users found it difficult to identify with GeogDL due to the newness of the map-based interface. This made it difficult for them to interact with the system. This issue has been addressed with GeogDL’s interface re-design (see Recommendations #3 and #5). 7. Recommendation #7 : Flexibility and efficiency of use Participants in the study used an early prototype of GeogDL which focused more on functionality than on usability. As a result, documentation and help facilities were not available. This, together with issues related to multiple overlapping windows and an unfamiliar map interface, made many users comment that a help system was necessary. Several steps have been taken. Firstly, GeogDL now provides a single point of access using a traditional GUI with fewer overlapping windows (see Recommendations #3 and #4). Online help is also available and is accessed from the Help menu (see Figure 6). In the current design, documentation is HTML-based and users follow links to locate relevant topics. Accelerators, unseen by the novice users, also are provided to speed up the interaction for expert users. The system thus caters to both inexperienced and experienced users.
Insert Figure 6
8. Recommendation #8 : Minimalist design The initial version of GeogDL had numerous overlapping windows which resulted in confusion among many users. Recommendation #4 addresses this problem. 9. Recommendation #9 : Speak the user’s language 19
Users were unsure of the meanings of many GeogDL system-oriented terms such as “projects”, “layers” and even “metadata” – terms that were carried over from G-Portal. Such terms were not congruent with users’ expectations of a digital library of geography examination resources. In the new version, GeogDL is no longer based on G-Portal’s map-based interface. The re-design also has ensured that concepts and terms more commonly used by GeogDL’s target user group are used. For example, the primary mode of access of examination questions is no longer through spatial attributes but by year and/or topic. The concepts of “projects” and “layers” are hidden from users, who now simply interact with “questions”, “answers” and “related resources”. 10. Recommendation #10 : Help and documentation Although GeogDL has been re-designed to offer more familiar modes of interaction, a comprehensive help system would nevertheless be beneficial especially for novice users. Recommendation #7 deals with this issue. 11. Recommendation #11 : Provide shortcuts Some of the common tasks in the initial version of GeogDL required multiple steps, prompting users to request shortcuts. For example, viewing an examination questions required a user to select the resource on the map or classification interface, view its associated metadata and from that window, locate the URL of the resource, select and then view its content. Although these steps might have been logical to G-Portal users where viewing metadata is an important activity, GeogDL users thought otherwise, and wanted a quicker way to view resource content. In the new version of GeogDL, users view a resource’s content rather than its metadata when it is selected. Toolbars and accelerators provide quick shortcuts to GeogDL’s modules. Finally, common tasks such a browsing and searching are just a mouse-click away. Figure 7 highlights some of these improvements.
Insert Figure 7
12. Recommendation #12 : Links to related concepts One of the original goals of GeogDL was to create a digital library where examination questions, answers and related supplementary resources are linked to provide a rich information environment 20
for users to explore. At the time of the evaluation however, a critical mass of resources had not yet been established, leading some users to comment that they could not see the value of links. In addition, the use of the map as the primary mode of interaction meant that questions without spatial attributes could not be linked easily. With GeogDL’s new design, linking between resources is made simpler because the focus is now on textual and graphical content rather than on a map. This is similar to the Web model of browsing and following links which users are more accustomed to. Where necessary however, GeogDL supports the map-based mode of interaction for resources that have spatial attributes. For example, in a question on climate and vegetation, the map could display regions with various climate types while the resources within each region would describe the characteristics of the vegetation found there (see Figure 8).
Insert Figure 8
5
Related Work
GeogDL shares similar goals with digital libraries providing access to geospatial content. These include systems such as Georep (Proulx, Bedard, Letourneau, Martel, 1996) and the Spatial Document Locator System (Orendorf and Kacmar, 1996) both of which provide basic search and retrieval services of geospatial data over the World Wide Web. More recent projects include the Alexandria Digital Library (ADL) (Smith, 1996), its successor the Alexandria Digital Earth Prototype System (ADEPT) (Smith, Janee, Frew, and Coleman, 2001), the Digital Library for Earth System Education (DLESE) (Sumner and Dawe, 2001) and Earthscape (Columbia Earthscape, 2003). ADL's goal was to build a distributed digital library accessible over the Internet for geographically referenced materials including maps, satellite images, etc., and their associated metadata. ADEPT builds upon ADL and supports the creation of personalised digital libraries of geospatial information (called “learning spaces”), and investigating their utility in post-secondary science education (Coleman, Smith, Buchel, and Mayer, 2001). Like ADEPT, DLESE focuses on education and contains online education resources targeted at various educational levels in earth system science education. A notable difference is that the contents of the digital library relies on users' contribution of resources which may include maps, 21
simulations, lesson plans, data sets, etc. Similarly, Earthscape provides a collection of online resources on the earth sciences classified into four categories: teaching (e.g., lesson plans); learning (e.g., readings and links); policy; and research. Earthscape, however, differs from DLESE and GeogDL in that it is subscription-based with its resources obtained after review by an editorial board consisting of scholars in the discipline. Another major difference between our work and education-oriented digital libraries such as ADEPT is that we aim to promote learning through a “bottom-up” approach in which we first assist students with examination revision, and then provide related concepts for them to investigate, allowing students to draw associations between various geographical issues and developing their reasoning skills. Hence, GeogDL is being designed to ensure “usefulness” as reinforced by student design partners in the study to relate to the four goals of providing students with: (1) practice/revision; (2) analysis of trends in examination questions; (3) samples of mock examination papers; and (4) useful links to related topics.
6
Conclusions and On-Going Work
This paper described the engagement of intergenerational partners and the novel use of Scenario-based Design and Claims Analysis as a means of refinement to the initial design of the GeogDL prototype. The initial work has created useful findings to refine and implement changes to the initial design of the GeogDL prototype. It also showed that through a process of aggregation, a team of eight design partners could produce a comprehensive, rich set of data, of which we presented only some of the findings in this paper. Compared to other forms of usability evaluation, say Heuristic Evaluation, Claims Analysis is powerful and more strongly theory-based. In our study, we showed how usability problems could be detected by analyzing claims made by users stepping through stages of actions in Norman’s executionevaluation cycle model of task completion. Claims sharpen the understanding of relationships that may only be suggested by the scenarios themselves (Carroll, 2000), highlighting just how GeogDL in use can afford actions, suggest explanations, signal progress and highlight problems for refinement. Enumerating typical and critical use scenarios characterizes the scope of an artifact’s actual use or the anticipated use of an artifact still in design (Carroll, 2000). The students reinforced the relevance of 22
the four goals identified by the evaluators to achieve the main goal of preparing/revising for GCE ‘O’ level geography examination. As suggested in Carroll’s task-artifact cycle hypothesis, the GeogDL artifact also provided a platform for students to add on/modify the goals of GeogDL. Because the scenarios provided a working representation for exploring and altering the design, the students also saw GeogDL not only as an examination resource DL, but also as an interactive teaching aid. Unlike other usability evaluations, Claims Analysis situated in context of use together with the emphasis to generate likely scenarios making evaluators focus not only on problems but also on solutions. However, Carroll’s Claims Analysis is not intuitive to use since the questions to prompt claims are quite difficult to understand, and using it well requires a competent level of “craft skills”. More can be done to make Scenario-based Design and Claims Analysis practical and easy to use. Work on GeogDL continues. We are in the process of implementing Goals #3 and #4. Future studies involve repeating this work with other age groups and control for factors such as Web skills, gender and study habits/preferences.
Acknowledgements The authors would like to thank the students at Yio Chu Kang Secondary School for their participation
and ideas. The project is partially supported by the SingAREN 21 research grant M48020004.
References Booth, P. (1989). An Introduction to Human-Computer Interaction. Hillsdale, NJ: Lawrence Erlbaum & Associates. Carroll, J. (2000). Making Use: Scenario-based Design of Human-Computer Interactions. Cambridge, Mass.: MIT Press. Chua, L.H., Goh, D., Lim, E.P., Liu, Z., Ang, R. (2002). A Digital Library For Geography Examination Resources. In Marchionini, G. & Hersh, W. (Eds.), Proceedings of the Second ACM+IEEE Joint Conference on Digital Libraries, pp. 115-116. Portland, Oregon, USA.
23
Coleman, A., Smith, T., Buchel, O. and Mayer, R. (2001). Learning Spaces in Digital Libraries. In Proceedings of Fifth European Conference on Research and Advanced Technology for Digital Libraries, pp. 251-262, Berlin: Springer. Darmstadt, Germany. Columbia Earthscape. Retrieved May 28, 2003 from http://www.earthscape.org. Druin, A., Bederson, B., Hourcade, J.P., Sherman, L., Revelle, G., Platner, M., and Wong, S. (2001). Designing a Digital Library for Young Children: An Intergenerational Partnership. In Fox, E. and Borgman, C. (Eds.), Proceedings of First ACM/IEEE-CS Joint Conference on Digital Libraries, pp. 398 – 405. Virginia, USA. Ellington, H., Percival, F. and Race, P. (1995). Handbook of Educational Technology. London, UK: Kogan Page. Geography: Singapore-Cambridge GCE Ordinary Level (Subject 2232). Retrieved May 28, 2003 from http://www.moe.edu.sg/exams/syllabus/2232.pdf. Henninger, S., Haynes, K. and Reith, M. (1995). A Framework for Developing Experience-Based Usability Guidelines. In DIS’96 Symposium on Designing Interactive Systems: Processes, Practices, Methods and Techniques, pp. 43-53. Amsterdam, The Netherlands. Keith, S., Blandford, A., Fields, B. and Theng, Y.L. (2002). An Investigation into the Application of Claims Analysis to Evaluate Usability of a Digital Library Interface. In Fox, E. and Borgman, C. (Eds.), Workshop Proceedings on “Usability of Digital Libraries” of Second ACM/IEEE Joint Conference on Digital Libraries. Portland, Oregon, USA. Landauer, T. (1995). The Trouble with Computers: Usefulness, Usability and Productivity. Cambridge, Mass.: MIT Press. Lingaard, G. (1994). Usability Testing and System Evaluation: A Guide for Designing Useful Computer Systems. London, UK: Chapman and Hall. Lim, E.P., Goh, D., Liu, Z., Ng, W.K., Khoo, C., Higgins, S.E. G-Portal (2002). A Map-based Digital Library for Distributed Geospatial and Georeferenced Resources. In Marchionini, G. & Hersh, W. (Eds.), Proceedings of the Second ACM+IEEE Joint Conference on Digital Libraries, pp. 351-358. Portland, Oregon, USA. 24
Nielsen, J. (1994). Usability Engineering. San Francisco, USA: Morgan Kaufmann, Norman, D. (1988). The Psychology of Everyday Things. USA: Basic Books. Orendorf, J. and Kacmar, C. (1996). A Spatial Approach to Organizing and Locating Digital Libraries and their Content. In Proceedings of the First ACM Conference on Digital Libraries, pp.83-89, ACM Press. Preece, J., Rogers, Y., Sharp, H., Benyon, D., Holland, S. and Carey, T. (1994). Human-Computer Interaction. Essex, UK: Addison-Wesley. Proulx, M., Bedard, Y., Letourneau, F. and Martel, C. (1996). GEOREP: A WWW Customizable Georeferenced Digital Library for Spatial Data. D-Lib Magazine. December 1996. Retrieved February 4, 2004, from http://www.dlib.org/dlib/december96/canada/12proulx.html. Shackel, B. (1991). Usability – Context, Framework, Definition, Design and Evaluation. In Shackel, B. and Richardson, S. (Eds.), Human Factors for Information Usability. New York, USA: Cambridge University Press, pp. 21 -37. Theng, Y.L., Mohd-Nasir, N., Buchanan, G., Fields, B., Thimbleby, H. and Cassidy, N. (2001). Dynamic Digital Libraries for Children. In Fox, E. and Borgman, C. (Eds.), Proceedings of First ACM/IEEECS Joint Conference on Digital Libraries, pp. 406 – 415. Virginia, USA. Theng, Y.L. Goh, H.L., Lim, E.P., Liu, Z., Pang, L.S., Wong, B.B. and Chua, L.H. (2002). Intergenerational Partnerships in the Design of a Digital Library of Geography Examination Resources. In Lim, E.P., Foo, S., Khoo, C., Chen, H., Fox, E., Urs, S. and Constantino, T. (Eds.), Proceedings of the 5th International Conference on Asian Digital Libraries, ICADL2002, LNCS 2555, pp. 427-439. Springer-Verlag. Singapore. Smith, T. (1996). A Digital Library for Geographically Referenced Materials. IEEE Computer, 29(5), pp.54-60. Washington, DC. Smith, T., Janee, G., Frew, J. and Coleman, A. (2001). The Alexandria Digital Earth ProtoType system. In Proceedings of the First ACM/IEEE Joint Conference on Digital Libraries, pp.118-119. Virginia, USA.
25
Sumner, T. and Dawe, M. (2001). Looking at digital library usability from a reuse perspective. In Proceedings of the First ACM/IEEE Joint Conference on Digital Libraries, pp.416-425. Virginia, USA.
26
Vitae Yin-Leng Theng Dr. Theng is an Assistant Professor in the Division of Information Studies at the School of Communication and Information (Nanyang Technological University, Singapore). Her research interests include Human-Computer Interaction, user interface design, web, digital libraries, education and technologies.
Dion Hoe-Lian Goh Dr. Goh is an Assistant Professor in the Division of Information Studies at the School of Communication and Information (Nanyang Technological University, Singapore). His research interests are in digital library applications, information retrieval, use of information technology in education, Internet and Webbased information systems.
Ee-Peng Lim Dr. Lim is an Associate Professor heading the Division of Information Systems at the School of Computer Engineering (Nanyang Technological University, Singapore). His research interests include web and data mining, web data extraction, digital libraries and mobile data management. Dr. Lim is the Principal Investigator of the SingAREN project (M48020004) which has funded this study.
Zehua Liu and Yin Ming Mr. Liu and Mr. Yin are Project Officers for the SingAREN project (M48020004). Both are Masters students at the School of Computer Engineering.
Natalie Lee-San Pang and Patricia Bao-Bao Wong Ms Pang and Wong are Masters students at the School of Communication and Information.
27
Figure Legends
Classification interface
Resource information window
Examination question
Map-based interface
Figure 1. Initial interface of GeogDL
Search UI
Map-based interface
Search results
Figure 2. GeogDL’s “Practice/Revision” tool – Goal #1
28
Selection controls
Distribution of examination questions
Figure 3. GeogDL’s trend analysis tool - Goal #2
Figure 4. GeogDL’s revised architecture
29
Search and browse tabs
Search UI with multiple options
Examination question
Search status report
Search results
Figure 5. Some of the recommendations for improving the interface addressing the violations against design heuristics “visibility of system status”, “flexibility and efficiency of use” & “minimalist design”
Figure 6. GeogDL’s help system
30
Easily accessible search and browse features
Tool bar for commonly used features
Focus on examination resources rather than metadata
Figure 7. Shortcuts in GeogDL
Climate and vegetation question in GeogDL Climate and vegetation question in G-Portal
Figure 8. Links to related concepts via G-Portal
31
Table Legends Table 1. Stage 1a (Goal Stage): Student S6’s Comments for Goal #2 – Trends Analysis Stage Stage 1a: Goal Stage Questions to prompt: 1. How does the system (screen) help you to decide what to do? 2. How does the system (screen) help you to want to analyse trends or spot questions? 3. How does the system (screen) suggest that spotting questions is: - simple or difficult? - appropriate or inappropriate?
Positive Consequences
Negative Consequences
Comments: Statement on the occurrence of the question in the past years helps me to get a vague idea of the question’s frequency. Compliance - Feature: Linking of related concepts
Comments: No references to the map. Violation - Feature: Linking of related concepts Comments: I have no idea how to use statement of occurrence to spot question. Violation - Feature: Match between system and real world Comments: Too many windows opened which causes confusion. Violation - Feature: Minimalist design
Table 2. Desirable – Features with Positive Consequences No. 1
Features
4 5 6 7
Diagnosis and recovery from errors Visibility of systems status Match between system and real world Control and freedom for users Consistency and standards Recognition rather than recall Flexibility and efficiency of use
8 9 10 11 12
Minimalist design Speak the users’ language Help and documentation Provide shortcuts Links to related concepts
2 3
Positive Consequences Boys Girls S1 S2 S3 S4 S5 S6 S7 S8 Not applicable since students did not encounter errors in their interactions. 1a 1a 1b, 2 3a 2, 3a 2 3a 3a 1a, 1b 1a, 1b 3a 1b
3a 3a
3a
3a 1b 1b, 2, 3a
2 1a
2
3b 3b
1a, 3a 1a
32
Table 3. Undesirable - Features with negative consequences No. 1
Features
Negative Consequences Boys Girls S1 S2 S3 S4 S5 S6 S7 S8 Not applicable since students did not enter errors in their interactions. 1b 1b 3b 2, 3b 1a 1a 3b 1a, 3a 1b, 3b 1a
4 5 6 7
Diagnosis and recovery from errors Visibility of systems status Match between system and real world Control and freedom for users Consistency and standards Recognition rather than recall Flexibility and efficiency of use
8
Minimalist design
9
Speak the users’ language
1b
10 11
Help and documentation Provide shortcuts
1b
12
Links to related concepts
2 3
1a
1a
1a
1a
3a, 3b 3a, 3b 3a, 3b 3b 3b 1a, 2, 1a, 1b, 1a, 1b, 3b 2, 3a, 3b 3b 1a, 1b 1a, 3b 1b, 3b
1b 2, 3b 2, 3b 1b
3a, 3b 3b 2 1a, 1b, 1a, 1b, 2b, 3b 2b, 3b 1a
1a
1a
1a, 1b, 3a, 3b 1b 3b 3b 3b 2 3b 3b 3b
1b
1b
3a, 3b 1a, 1b, 1a, 1b, 1a, 3a 3a, 3b 3a, 3b
33