Department of Design, Brunel University, Runnymede Campus, Egham, Surrey TW20 0JZ, UK. Abstract. This paper reports on the first test of the Product Ideas ...
Applying structured methods to Eco-innovation. An evaluation of the Product Ideas Tree diagram E. Jones, N. A. Stanton and D. Harrison Department of Design, Brunel University, Runnymede Campus, Egham, Surrey TW20 0JZ, UK
Abstract This paper reports on the first test of the Product Ideas Tree diagram (PIT): a structured method aimed to help Ecoinnovation. The PIT diagram structures ideas output from chaotic idea generating sessions. This study compared four ways of conducting an Eco-innovation workshop. The results show that structured methods help Eco-innovation by improving the constructive communication between the participants. Further development of the PIT diagram promises to contribute several new approaches to sustainable product and process design. Author Keywords: innovation; creativity; design tools; eco-design; teamwork Eco-innovation is one of several approaches towards sustainable product design, which aims to provide customer and business value whilst significantly decreasing environmental impact[1]. Eco-innovation aims to develop new products and processes, which meet the needs of customers in the most Eco-efficient way. Sustainable product design is one part of a global movement towards sustainable development, which is driven by the realisation that society cannot continue current modes of production and consumption without serious ecological damage. One commonly quoted definition of sustainable development is ‘development which meets the needs of a current generation without compromising the ability of a future generation to meet their needs’[2]. Sustainable product design requires the balancing of economic, environmental, ethical and social issues in product design and development. Sustainable product design requires creativity, innovation and the participation of many different actors such as policy makers, business strategists, managers, designers, engineers, marketing managers and consumers. Successful Eco-innovation relies upon the collaboration between these stakeholders. Business strategies that include sustainable product design can improve a company's competitive advantage by supporting expansion into new markets, through the launch of new products with environmental attributes which consumers desire. Philips, for example, launched a range of ‘green products’ in 1998[3] and has had corporate environmental commitment since 1987 when they issued their first environmental policy. They have long regarded environmental care as a business opportunity, where the corporate ‘Green Image’ is of great value to the company both externally and internally [4]. Such an environmentally proactive company may also benefit financially from the optimisation of production processes, reduced material and energy use, and reduced waste generation. In sustainable product design a discussion is emerging that focuses on the integration of environmental considerations into product development, taking account of the different environmental issues and concerns at different stages in the product development process[5]. Eco-innovation considers environmental aspects of the product at the early stages of the product development process, such as the strategic product planning stage or the new concept development stage. A number of tools and methodologies have been developed to support the process of Eco-innovation. Streamlined environmental design tools such as the Life-cycle Design Strategy (LiDS) wheel[6] and the Eco-compass [7] condense environmental information into a visual map that displays the comparative environmental merits of new design options against the original design. Other tools such as the Philips STRETCH methodology [8] are specifically designed to support Eco-innovation at the early stages of the product development process. The STRETCH methodology consists of five steps, which help identify the most promising environmental opportunities. The STRETCH methodology aims to incorporate environmental aspects into the company's business strategy and helps anticipate future environmental opportunities and threats earlier. None of the existing Eco-innovation methodologies focus specifically on the idea generation process. The LiDS wheel and Eco-compass can provide key-starting points to structure brainstorming sessions for Eco-innovations, however, their main use is as tools to assess the environmental merits of new product concepts. The STRETCH methodology prescribes brainstorming sessions at various stages, however, it does not describe the idea generation process specifically.
In order to get the most out of the idea generation process, the activity and the outcomes need to be structured. Tassoul conducted a case study, generating radical concepts for clean textiles in the context of sustainable development[9]. He suggests that it is not easy to summarise the outcomes from such creativity workshops and states the need for frameworks to help cluster results from workshops. Much work has been done on the activity of idea generation, and many techniques have been developed and established such as: Brainstorming[10], Lateral thinking[11], and Synectics[12]. These techniques generally increase the productivity of participants by controlling the direction and quality of their thoughts [13]. However, relatively little emphasis has been made on structuring the outcomes from these techniques. Osborne suggests appointing a secretary to take down and consecutively number all ideas during a session. De Bono[14] discusses different methods of capturing ideas during the idea generation process. He states the need to extract and record the output systematically. He uses a checklist to group the ideas and proposes another classification technique to formalise different types of output. Hanks [15] acknowledges the importance of all participants being able to see the recorded ideas simultaneously during the session. He states that new ideas will be expressed as a result of being able to see the relationships between the ideas captured already. Mind mapping[16] is one technique that can be used to structure the outcomes from creative sessions. Tony Buzan developed Mind maps as a way to generate and record ideas. They are diagrammatic representations of ideas, where all ideas are recorded as they radiate out from a clearly defined central idea that is clearly defined. Mind maps are now a wellestablished technique and can be used as a powerful graphic representation of the outcomes from creative sessions.
1. Problem statement In general, idea generation within Eco-innovation uses brainstorming techniques similar to those used in conventional product development practice. However, in Eco-innovation the objectives and the key-starting points for brainstorming sessions emphasise improvement in product environmental performance and success in Eco-innovation relies on the collaboration between different stakeholders. Relatively little research has been done on the idea generation process within Eco-innovation. To research and advance idea generation processes in Eco-innovation, a new tool has been developed, the Product Ideas Tree (PIT) diagram[17]. The PIT diagram helps structure idea generation activities and the outcomes from them. The PIT diagram is a specific tool that aims to overcome some of the communication problems between the different stakeholders at the early stages of the Eco-innovation process. These communication problems are similar to those published in a recent study [18]. This paper introduces the PIT diagram and reports on a pilot study of its use where the participants were asked to generate ideas for improving domestic dishwashing. The main aim of the experiment was to assist in the development of the PIT diagram as well as providing insights into better ways of testing such a recording tool. Previous research shows the merits of conducting formal evaluation studies into design tools[19]. These studies are able to offer qualitative insights into the ease with which methods are used as well as quantitative data on the performance of methods for comparative analyses.
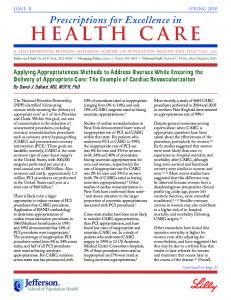
2. Introduction to the PIT diagram The PIT diagram is a novel method for clustering Eco-innovation ideas and documenting them clearly. The PIT diagram structures ideas output from chaotic brainstorming sessions by mapping these ideas onto a surface. The PIT diagram combines: some key-starting points for Eco-innovation, a hierarchical structure for ideas, and the Mind mapping technique to produce valuable documentation in the form of maps. Figure 1 shows a schematic of the PIT diagram with pointers explaining the way it is intended to be used. Also shown are the key-starting points for Eco-innovation used in this experiment.
Figure 1. Schematic of PIT diagram with ‘pointers’ showing intended use Owen[20] developed a hierarchical, clustering information structure that enabled design teams to represent the information needed in team synthesis sessions, but did not report research on optimising the output from such team sessions. The PIT diagram is different from any existing idea recording or ‘mapping’ technique because the ideals are simultaneously clustered according to some key-starting points for Eco-innovation and also placed within a hierarchical structure. Figure 2 shows an example of the PIT diagram used in a creative session, which was part of previous developmental research[21].
Figure 2. Example of the PIT diagram from an Eco-innovation workshop It was therefore hypothesised that the use of the PIT diagram in a creative session would produce more ideas (H1), more environmentally relevant ideas (H2) and would help facilitate such a creative session (H3). These three will be treated as separate research questions for the purposes of data analysis and interpretation.
3. Methods 3.1. Participants The 20 participants with mean age of 21 years were unpaid volunteers recruited from the final years of the following degree courses: Industrial Design (BSc), Industrial Design Engineering (BSc), Product Design (BSc), and Industrial Design and Technology (BA). These courses all have several core modules in common and in the final year the selected options determine the design specialisation for each of the students.
3.2. Experiment design 3.2.1. Independent variables The aim of this pilot study was to test the PIT diagram, for which purpose we broke the PIT diagram down into the two main elements: the radial recording method and the key-starting points for Eco-innovation. Manipulated were these two betweensubject factors: (1) the recording method (radial recording method and no method); and (2) the key-starting points (keystarting points for Eco-innovation and no key-starting points). Table 1 shows how these two factors were crossed yielding the four experimental conditions.
Table 1. The conditions allocated to the four groups
3.2.2. Dependent variables To test the three parts of the hypothesis the following dependant variables were selected for each part. Use of the PIT diagram produces more ideas (H1). Initial ideas (A): the number of ideas generated in first 15 min of the test, as recorded on the post-it notes. Expanded ideas (B): the number of ideas generated in last 15 min of the test, as recorded in felt-tip pens on the large recording sheet directly. Use of the PIT diagram will produce more environmentally relevant ideas (H2). Environmentally relevant ideas: the proportion of the total ideas generated (A)+(B) which were judged by two environmental design experts to be environmentally relevant with or without possible rebound effects. Use of the PIT diagram will facilitate the sessions and make them more constructive (H3). From video recordings of all the groups, the authors made general observations on key actions and approaches during the sessions. From the same recordings the last activity of the session (expanding the ideas for 15 min) was examined. Four different types of interactions were identified as the categories for analysis. The number of constructive, analytical, destructive interactions and queries in the session were counted. 3.2.3. Explanation of terms Radial recording method: a method for recording ideas on a surface that links ideas and simultaneously places them in a hierarchical structure. Key-starting points for Eco-innovation: the key-starting points (or brainstorm prompts) that were distilled from LiDS wheel and Eco-compass. These key-starting points were provided on two levels, as the headings and sub headings show below. Product manufacture Reducing the amount of material in the product Reducing the number of parts in the product Reducing the number of different materials in the product Product usage Reduce water usage Reduce energy usage Reduce detergent usage End-of-life Extend the product life, design for longer life Re-use the components, design for upgradability
Recycle materials, design for ease of separation Function redesign Redesigning the activity of washing dishes Redesigning the ‘dishwashing’ system Environmentally relevant ideas: ideas that show potential to reduce the environmental impact of the product or system throughout its life cycle: from materials extraction, through production processes, packaging and transport, product use, to end-of-life disposal. Environmental impact: detrimental effects related to the use of materials and energy and release of substances into the environment. Rebound effect: where an (potential) environmental improvement at one stage of the product life cycle has a detrimental effect at another stage of the product life cycle. Constructive interactions: all interactions that lead to new ideas output or build on existing ideas leading to new ideas. Analytical interactions: all interactions that were constructive but did not lead directly to new ideas output, these included activities such as information summaries. Destructive interactions: all interactions that slowed down the flow of new ideas output, these included activities where the participants failed to reach consensus or disagreed. Queries: all interactions where the participants queried the methods, task or instructions, this also included all time keeping and hurrying along.
3.3. Procedure 3.3.1. Recruitment The 20 final year students taking part in this experiment were recruited by personal invitation one week before the workshop was held. 3.3.2. Warm up session and grouping The participants were divided randomly into four groups. To check the uniformity of design skills and design interests between each of the groups the following two analyses were undertaken. For the first analysis, a profile of the participants' different final year options was undertaken. The authors grouped these options as humanistic options and technological options. Humanistic options were context, graphics and design-related studies. Technological options were all the science or technology options. The groups' profiles of design skills were made up by the total number of technological and humanistic final year options chosen by the members of each group. The second analysis doubled up as the warm-up exercise for the session. Each participant was given 10 min to select two pictures from a large bank of different magazines that would depict their design interests. The participants were subsequently divided into the four groups and asked to paste together their pictures on a board. The authors counted the pictures on these boards and grouped them in the following categories: Nature (nature or natural products), Society (social comment or human activity), Architecture (atmospheric interior or social comment) and Technology (cars, high-tech products or highly styled products). The boards provided a profile of each of the groups' design interests. An example of such a board is shown in Figure 3.
Figure 3. Example picture board from warm-up exercise
Table 2 summarises the outcomes from these two analyses and highlights the number of participants in each group with Environmentally Sensitive Design (ESD) as a final year option. The authors were satisfied that the groups were adequately homogenous for this experiment. Table 2. Summary of design skills and interests
3.3.3. Communal briefing After the warm-up exercise, the groups were briefed communally on the task, the ideas outputs expected, the timing of the different activities within the session, the idea-recording techniques expected at each stage, the operation of the video cameras and timekeeping required. The task was to generate as many and diverse ideas for improving domestic dishwashing. It was emphasised that the workshop was about recording the way the ideas were generated. The participants were asked to generate as many and diverse ideas as possible and not to criticise ideas or eliminate any ideas. The participants were introduced to some general facts about dishwashing and the dishwasher. Throughout the session they were free to generate ideas on the product (the dishwasher) or the activity level (dishwashing). Each group had a copy of these general facts in their separate session rooms. The participants were asked to record their ideas throughout the sessions by writing each idea as a single phrase statement. They were asked to avoid compound ideas statements (multiple ideas presented as one idea), by splitting such ideas into several single phrase statements. If ideas were sketched they were asked to translate those drawings into single phrase statements. Each group had a copy of these idea-recording guidelines in their separate session rooms. The participants were briefed on the basic session programme for the four 15 min activities. The activities and the idearecording techniques expected at each stage were described as follows:
Self-briefing, 15 min. The participants were told that each group would have slightly different instructions to follow for the session. They would be provided with two overheads and one page of accompanying text. One participant would need to volunteer to project these overheads and read the text out. Individual brainstorm initial ideas, 15 min. The participants were told that the next activity was to individually brainstorm initial ideas. They were asked not to discuss ideas with each other but to record all idea statements on separate post-it notes. Group discussion sorting ideas, 15 min. The participants were asked to bring together all the post-it notes, create categories to group all the ideas and subsequently place their grouped post-it notes on the large sheet of paper. They were then asked to identify the most interesting areas on the large sheet to explore further in the next part of the session. Group brainstorm expanding ideas, 15 min. The participants were asked to work together to generate ideas that would expand the interesting areas identified. One participant would use felt-tip pen to record all these ideas directly onto the large sheet of paper. Finally, the participants were briefed on the operation of the video camera and told to start the recording as soon as they entered their separate session rooms. They were asked to appoint a timekeeper to ensure that the basic program schedule was maintained and any deviation from the schedule would be recorded. 3.3.4. Group-self briefing and conduct of the activity In their session rooms the groups received two of four different instructional overheads and an accompanying text to read. These described the methods that each group was expected to employ. Table 3 shows which of the four overheads each group received in accordance with the four experimental conditions. Table 3. Overheads provided for self-briefing
Classical brainstorming. The rules of ‘classical brainstorming’[10] were taken as the ‘no recording method’ because all groups were expected to abide by these basic rules during the session. The basic rules are to suspend all criticism, encourage freewheeling and desire a large quantity of ideas. Radial recording. For the groups using the radial recording method the first part of their session was identical to the other groups. However, in the second part of the session they were expected to mark their idea headings on the inner ring of their large sheet of paper which had been pre-marked with four rings. Ideas closest to the inner ring should be more general and ideas on the outer ring should be more concrete. In the final part of the session they were asked to expand the interesting areas on the sheet by using each idea to generate several spin-off ideas and by working around the circle to bring their attention to all areas on the sheet. Eco-starting points. The groups that were provided with the Eco-starting points were asked to consider those starting points as design directions whilst generating ideas, but were asked not to rule out other idea directions. This was done to ensure that all groups would feel the same degree of freedom to produce ideas. The authors thereby tried to ensure that the total ideas count (A) would not be affected negatively by providing these key-starting points. The key-starting points provided are listed in Section 3.2.3. Placebo. The placebo was an activity designed to occupy the groups that were not briefed with Eco-starting points. This activity would take roughly the same amount of time, but would not influence the group's behaviour. These groups were simply put in ‘un-prepared’ rooms and asked to arrange their furniture and hang their recording sheet on a convenient wall. 3.3.5. De-briefing For the de-briefing session the groups came together with their ideas output. This enabled each group to compare their efforts if they wished. Each group was asked how they felt their sessions had gone and this informal feedback was recorded.
3.4. Equipment
2
All groups had the following equipment: post-it notes, pens, felt-tip pens, a large sheet of paper (1.5×1.5 m ), the dishwashing fact sheet, the task sheet, a video camera, a stop watch, an overhead projector, two overhead slides and accompanying text. (noE,R) and (E,R) had four pre-marked rings on their large sheet of paper. (E,noR) and (E,R) also had Eco-starting points on pieces of card and blue tack to attach these to the large sheet of paper.
3.5. Data analysis 3.5.1. Use of the PIT diagram produces more ideas (H1) Initial ideas (A) were counted from the number of post-it notes produced. Expanded ideas (B) were counted from ideas that were written in felt-tip pen on the large sheet. Many of these ideas (B) were restatements of initial ideas and only few were genuinely new ideas. Therefore, the ideas (B) were separated into two groups: restatements of initial ideas (B1) and genuinely new ideas (B2). 3.5.2. Use of the PIT diagram will produce more environmentally relevant ideas (H2) Two environmental design experts categorised all the ideas statements (A)+(B), they had to judge the statements to be either environmentally relevant ideas (with or without possible rebound effects) or ideas which were environmentally irrelevant or detrimental. An inter-observer reliability check was performed which revealed a moderate, and statistically significant, correlation between the two environmental design experts (rho=0.47, p