Applying visual programming methods for parametric bridge modelling and generation of model variations Ali Ismail1, Yaseen Srewil1 and Md. Saiful Abedin2 1
Institut für Bauinformatik, Technische Universität Dresden Nürnbergerstr. 31a 01062 Dresden. E-mail:
[email protected] ,
[email protected] 2 hkc Architekten-Ingenieur Consult GmbH, Brückenweg 5 18146 Rostock. E-mail:
[email protected]
The design of infrastructure projects like complex bridges is challenging task for planners and engineers. The traditional design and modeling process for bridge models needs a large number of repetitive design processes and a lot of manual work for each model variation or design modification. The integration of visual programming language (VPL) methods and Building Information Modeling (BIM) software enables automated repetitive design process and simplify the generation of model variations especially in the primary design phase, for example to check the design effectiveness for wind analysis. This paper presents in details a workflow for geometry parameterized bridges modeling with help of VPL tools and study cases to generate bridge model variations. It gives also a brief overview about the semantic enrichment of generated models based on the IFC standard. Keywords: Visual programming VP; Parametric bridge modeling; BIM Annotation; Semantic enrichment; Dynamo.
Introduction In today’s infrastructure construction field, the design process includes a large number of repetitive processes during the complex design procedure. The application of visual programming methods can be considered as a great potential for large number of similar task in bridge design process and parametric model variations of the bridge, to optimize the bridge alignment and orientation to fit in the surrounding environment. Here, the term of “parametric” refers to the relationships among all elements of the model that enable coordination, variation and change management. While semantic data refers to the classification of model elements, assigning attributes and defining relationships between model elements. The visual design methods enables users to design a process rather just objects, it allows the designer to find new solutions and step beyond the limitations of traditional CAD/BIM software and 3D modelers. In fact, the distinction between parametric and non-parametric models is basically in the geometry and rules. Parametric models have explicit rules and implicit geometry, and in reverse the non-parametric models. Changing a rule or constraint, or modifying a part of the model itself, has implications for the entire model. The rules, relationships and constraints among model’s parts determine the geometry (Mackenzie, 2013). This research aims to deal with challenges for bridge design in the early phase of design focusing on the work flow to optimize the bridge performance due to wind loads. It proposes a workflow and parametric visual templates for typical bridge types that is more intuitive and efficient for generation of model variation. Next, the semantic quality of 3D generated models can be improved and linked with specific domain information from various domains
28. Forum Bauinformatik 2016 19.–21. September 2016, Leibniz Universität Hannover
focusing on bridge models based on the IFC standards and the under development extension IFC-BRIDGE. The main target of this research is to optimize the bridge design in the primary design phase for a better wind analysis performance. The prototype implementation is mainly based on the open source code tool “Dynamo” and the BIM authoring software “Autodesk Revit”.
Related work Although, visual programming (VP) paradigm is relatively new in AEC industry, it is a very promising tool to solve variation problems in this domain (Tedeschi, 2014). This paradigm is used successfully for simplification of building models query like the BIMcarft filter tool for personal at construction site (Wülfing et al. 2014). Also Ritter et al (2015) investigated the fundamental of visual programming and evaluated its possible application in AEC industry. Several CAD and 3D software vendors have developed visual tools which are based on node diagrams to make scripting more accessible to user with limited programming skills. For bridge modeling, VP design tools have been represented and demonstrated in several articles and tutorials videos. A feasible study is proposed by Langwich (2016) demonstrates an example for bridge modeling according to German bridge standards and requirements with Revit and the visual design tool Dynamo. Singer D. (2015) presented the application of knowledge-based engineering and VP methods in methods in early stages of bridge design. Other applications demonstrate how to extract bridge alignment data to Revit from Autodesk Civil3D and use Dynamo for bridge detailed modeling and comparing alternative of bridge model (Stark 2015, Younghwi 2016).
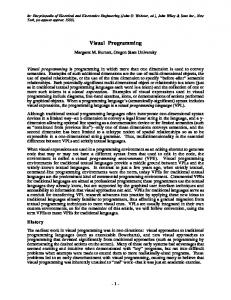
Modeling a detailed bridge model using visual programming In this section we present a workflow to generate bridge design model variations using visual programming methods with the help of visual programming tool Dynamo. The most important advantage of this method is the automation of modeling process, the possibility to replace model elements with different level of details and change the geometry parameters in consistent way, using advanced modeling concepts like form-finding algorithms and NURBS curves for complex geometry which satisfy a set of geometric and logical constraints. It saves a lot of manual modeling time and automates as well as the process of linking external data source (AutoCAD Civil 3D, excel etc.) for creating variable profiles and the bridge alignments. Figure 1 depicts the main steps for creating a parametric and bridge model variations and equipped this models with necessary semantic data based on IFC standard. The result is a BIM enrichment semantic model which can be driven into diverse applications like structural analysis or CFD wind analysis.
2
28. Forum m Bauinformaatik 2016 19.–211. September 2016, 2 Leibniz Universität H Hannover
Figgure 1 A generiic workflow forr modeling a paarametric and seemantic enrichm ment of bridge m models
Stud dy case 1: Brridge modelling using Dyynamo and Autodesk Revit R Dynaamo is an oppen source to ool, which caan be used standalone s orr as extension on inside Autoodesk Revit. Itt enables desig gners to applyy computation nal design and automation pprocesses throuugh a node-baased visual prrogramming iinterface with hout need to write w a lot off code. It givess the designeer the added advantage off being able to leverage computationaal design workkflows within the context of o a BIM envvironment. Users U can creaate node-basedd design definnitions for creeating, positioning, and vvisualizing geeometry. The visual progrramming frameework lets thee user create unique u system ms and relation nships and exp pand how BIM M can be used to drive desiggn ideation (w www.dynamobbim.org). Whille designing a bridge, somee issues must be considered d. Nowadays the key challlenges of the bbridge designn in Germany y are not thee economic aspects a but du ue to alignme ment, the compplex geometryy at curved alignment, a at longitudinal inclination, skewed s substr tructures, variaable bottom eddges etc.(Stark k, 2015). In thiis study case, Dynamo is used u only to aassist in the co onstruction off bridge route.. Easy to underrstand workfllow of visual programmingg and step ressults at the saame time motitivates to know w how the vissual programm ming can be integrated with w Revit to smooth s and aautomate workkflows of briddge design. Th his approach is carried outt based on thee adaptive fam milies to create the bridge model m in Revit. Bridge crosss-section can be correctly placed p along tthe route and ssweep volumee elements can n be created ussing “Create Form” F Revit functionality. fu The uuse of adaptivve families carrries certain addvantages, succh as: They can be oriented to o vertical direection at the pllacement. Start and end can be prrecisely defineed. 3
28. Forum m Bauinformaatik 2016 19.–211. September 2016, 2 Leibniz Universität H Hannover
Figu ure 2 Workflow w for alignment creation
The modeling proocess starts with w defining tthe input parrameters of po oint coordinat ates from excell to import thee alignment daata. The superrstructure solid d is modeled in i the followinng steps: 11. Alignmennt creation: The T modelingg process starrts with align nment creationn of the bridge. The alignment is basically a line of certaiin points and elevation. Heere it has been creaated arbitrarily y in Dynamo creating a cu urve and extraacting points X, Y, Z coordinattes along the curve. c The cooordination off main horizon ntal alignmennt can be also impoorted from oth her GIS and innfrastructure design d tools lik ke Autodesk C Civil 3D. Dynamo Later thesse alignment point p co-ordinnates can be read r as excel data input in D and impoorted in metricc generic adapptive Revit fam mily template. Above the w workflow shows hoow excel sprreadsheet cann be integratted with Dynamo and R Revit for parametriic data manipu ulation. 22. Creating bridge b cross- section: Afterr creating the alignment thee next step is tto define the bridgee cross-section n for superstruucture and sub bstructure. Th he bridge crosss section shape hass been created d as single poiint adaptive faamily based. Single S point iss used to create adaaptive family that they cann be positioned along the direction d of aliignment. The orienntation parameeter of the adaaptive point is set to “Globaal (Z) then Hosst (XY). 33. Placing bridge b cross-section along tthe alignmentt: The alignm ment path in R Revit has been diviided into certaain segments. Adaptive sup perstructure cross-section c iis placed on the seggment point of o the alignmeent. The bridg ge superstructu ure forms thenn created for wholee curve path by y “Repeat” annd “Create Forrm” function in i Revit. 44. Creating bridge superrstructure voiid: The void form has beeen created ssimilarly placing adaptive a cavitty family crosss-section alo ong the segmeental point annd using “Create Form” F tool in Revit. R 55. Bridge modeling: m Thee creation of complex bridge superstru ucture from th the basic adaptive cross-section shows how the adaptivee families can n be used foor bridge modelingg. Similarly ad daptive railingg, adaptive abu utment has beeen created annd placed with supeerstructure to complete c the bbridge modeliing in Revit.
4
28. Forum m Bauinformaatik 2016 19.–211. September 2016, 2 Leibniz Universität H Hannover
Fiigure 3 Study-ccase modeling phases p
Stud dy case 2: Brridge modelling using Dyynamo as sttandalone to ool The second study case presentss a fully Visuual Programm ming Languagee (VPL) apprroach for the ggeometric moddeling of arch bridge. VPL allows creatin ng geometry relationships r bbased on rules and logic. The T bridge geometries slabb, railing, pierr modelled ass surface withh certain thickkness with thee help of nodees in Dynamoo visual programming. The geometry par arameters can bbe modified acccordingly by the adjustmennt of the inputt parameter vaalues. The m modeling proccess of arch brridge is descriibed below in n sub-process and a the corressponding impleementation is shown. 1. S Specifying thee start and en nd station of thhe bridge: Th he basic geometric modelinng begins w with the definnition of the brridge arch lenngth and radiu us. The road leength is consiidered as tthe tangent too the vertex of o the arch (F igure 4). Three independen nt points reprresenting sstart, vertex of arch and end d of the bridg e are defined.. These pointss are manipulaated later tto succeeding parts to comp plete the modeeling. 2. C Creating archh column sup pport: The veertical arch column c has been b created at equal ddistance on thhe arch. Each column is geenerated as a function, join ning line betw ween the ccurve points on o arch and in ntersecting pooints on tangen nt road length h. The columnn form is m modeled by trranslating the column line iin parallel dirrection and loffting the crosss-section bbetween linees to certain n thickness. Dynamo nodes “Line.By yStartPointEnndPoint”, ““Geometry.Trranslate” and “Surface.ByL Loft” used in this t operation. The input paarameter ffor the numbeer of columns can be expliciitly set by “In nteger Slider” node. n
5
28. Forum m Bauinformaatik 2016 19.–211. September 2016, 2 Leibniz Universität H Hannover
Figu ure 4 Start and eend station of th he bridge
Figure 5 Archh column creatiion
3.
4.
C Creating roadd surface: The road surface is created as same as arch h column geom metry by ttranslating thee tangent of the arch in thhe direction of o width and lofting insidde of the ssurface. The surface s thickneess parameterr can be contro olled by “Num mber Slider” nnode. C Creating railinng: To compllete the geom metry of the brridge, we neeed to create raailing on bboth side of thhe roadway. To T limit the raailing start and end point frrom the bridgee length, tthe tangent cuurve has been trim by “Curvve.TrimByParrameter”. Tran nslating the triim curve iin vertical diirection, manipulating both th curves into o certain seg gments and aafter that iintersection points p are joiined through the node “L Line.ByStartP PointandEndPooint”. A sseries of planees created acrross the line ccurve by “Currve.PlaneatParrameter” to addjust the ggeometry according to thee curve profilee. Generating g series of cirrcle on all pllanes the ccurve path sw weep as solid circular shapee. Finally, usiing the node “Geometry.Trranslate” tthe created geometry is mirrrored on the oother side of th he road.
6
28. Forum m Bauinformaatik 2016 19.–211. September 2016, 2 Leibniz Universität H Hannover
Figure 6 Roadd surface creatiion
Figure 7 R Railing creation
mo. Bridge mo odeled in Dynnamo can Figurre 8 shows thee arch bridge model generaated in Dynam be im mported in Revvit as generic model.
Figu ure 8 Arch bridgge modeled in Dynamo D
Bridgge modeled inn Dynamo can n be importedd in Revit as generic g modell. Dynamo Pluug-in for Roboot Structural Analysis/Reac A t Structures hhelps to createe parametric and complex sstructural framees models in Dynamo, then n bring it to A Autodesk Rob bot Structural Analysis or A Autodesk Reacct Structures foor simulation, and review thhe analysis ressults. Dynamo The geometry moodeled in dynaamo can be ttransformed in nto mesh geo ometry using D packaage “Mesh Tooolkit”. Mesh hes are most flexible form m of geometry in the compuutational desiggn. The Mesh geometry can n be exported direct as COL LLADA format. It can optim imize the proceess of the geometric model first pushed iinto Revit and d converting into IFC. Afteer that an IfcOppenShell converter tool needs n to makke this IFC model m as CO OLLADA forrmat. To exchaange standardd information through multiimodal metho od, COLLADA A format is nneeded to link tthe data modeel for semanticc enrichment. Therefore stu udy and judgm ment should bee carried out too see the feasiibility of the process p directlly exporting th he model from m Dynamo to oother 3D formats.
Stud dy case 3: Work W flow off a long span n bridge mod del with Dyn namo In thhis modeling approach a we created a Dyn ynamo script that t enables designer d to geenerate a long span bridge model m from Revit R family ddirectly in the project envirronment follow wing the bridgge alignment. As excel can be consideredd as managem ment of buildin ng informationn, in this area Dynamo equiipped to paraametric data m manipulation of o the model. To create thhe bridge modeel first Revit families f for superstructure,, substructure, abutment etc. loaded in th the Revit 7
28. Forum m Bauinformaatik 2016 19.–211. September 2016, 2 Leibniz Universität H Hannover
projeect template. The T parametrric variation oof geometry can c be easily created and changed throuugh the Dynam mo script. 1. Crreation of briddge superstructture The m modeling proocess begins with w the bridgge alignment creation from m excel data ppoint coordinnates. The woorkflow for crreating the allignment is saame as study case 1. Dynaamo can create alignment im mporting X, Y, Y Z co-ordinaates directly frrom excel. The superstructure form of th he bridge cann be created along the allignment curvve using Dynaamo node “StrructuralFramin ng.BeamByCuurve” and witth the help of superstructuree family. This node will searrch for loaded d Revit familyy in the project.
Figuree 9 Creation oof bridge superrstructure 2. Paarametric variaation of supersstructure Based on the parrameters defin ned on the R Revit family, the parameteers can be coontrolled throuugh Dynamo node “Elemeent.SetParameeterByname”. The variable parameterss for the crosss-section suchh as width, thicckness, heightt of the supersstructure data can be assignned from excell through thiis node. Run nning the Dyynamo script can generatee variable seection of superrstructure. Figgure 10 showss how excel aand Dynamo can c be equipped to create fr free form geom metry in Revit.. Segment Length, (m)
Segment (ma)
0 7,25 5 12,25 5 17,25 5 22,25 5 27,25 5 32,25 5 37,25 5 42,25 5 47,25 5 52,25 5 57,25 5 62,25 5 67,00 0 71,75 5 76,25 5 80,50 0 84,75 5 88,75 5
Length Height of Super‐Height to Top parameter structure, h(m)) Flange, h1(m) 0 0,02 0,03 0,05 0,06 0,07 0,09 0,10 0,12 0,13 0,14 0,16 0,17 0,18 0,20 0,21 0,22 0,23 0,24
4 4 4 4 4 4 4,01 1 4,1 1 4,25 5 4,47 7 4,75 5 5,1 1 5,51 1 5,95 5 6,45 5 6,97 7 7,5 5 8,07 7 8,64 4
0,5 0,5 0,5 0,5 0,5 0,5 0,5 0,5 0,5 0,5 0,5 0,5 0,5 0,55 0,5 0,5 0,5 0,5 0,5
Height to Bottom Bottom Flange 2(m) Thickness t(m) Flange, h2 3,7 3,7 3,7 3,7 3,7 3,7 3,51 3,58 3,7 3,88 4,12 4,44 4,81 5,18 5,62 6,07 6,54 7,05 7,57
0,3 0,3 0,3 0,3 0,3 0,3 0,5 0,52 0,55 0,59 0,63 0,66 0,7 0,77 0,83 0,9 0,96 1,02 1,07
d
h t
8
28. Forum m Bauinformaatik 2016 19.–211. September 2016, 2 Leibniz Universität H Hannover
Figure 10 Extract Superstruccture parameterrs from Excel fiile
3. Pieer creation As thhe bridge has different span n length, firstt pier location ns on the align nment are deteermined. Usingg Dynamo noode “Point.By yCartesianCooordinates” and d connect it to t “Line.BySttartPoint DirecctionalLength” node two vertical v lines aare drawn. Th hese 2 lines represent r as thhe curve path for pier and similarly s as th he superstructuure, piers have been created d using Dynam mo node “StruucturalFramingg.BeamByCurrve”.
Figure 111 Pier creation
4. Plaacing the abuttment At thhe beginning and a end of thee bridge alignm ment abutmen nt are placed. The T points forr placing the abbutment family are determined from thee start and end d points of thee curve. After loading, the abutment faamily can be b placed aat the pointts with the aid of thhe node “Fam milyInstance.B ByPoint”. Thee abutment paarameters wid dth, wall thicckness, heightt can be contrrolled througgh Dynamo node. The w width of thee abutment is chosen fr from the superrstructure widdth to act parametric toggether with superstructure s e. Orientationn of the abutm ment can be directed to the bridge alignm ment by the no ode “FamilyInstance.Set Rootation”.
9
28. Forum m Bauinformaatik 2016 19.–211. September 2016, 2 Leibniz Universität H Hannover
Figurre 12 Loading aand placing the abutment
Sem mantic data enrichment e of o 3D modells So fa far the 3D geeometry modeel of the briddge using VP P with Dynam mo is generatted. The resultting model has h a comprrehensive geoometric repreesentation. However, it hhas poor semaantic informatiion (classificaation of elemeents, attributes). To handle this issue andd get the ultim mate potential of using the BIM B models for different data d exchangee scenarios duuring the consttruction life cycle, c an ann notation tool ““BIM-Annotaator” with thee help of a rreference databbase for classiification and standard attrib ibutes of typiccal bridge eleements was deeveloped (Ismaail et al 2016). Here, BIM-A Annotator is uused for: Collaboraative online data enrichm ment tool by y adding, ed diting and exxtending information to original model. A consisstent annotatio on process bby using a reeference dataabase (accessiible and searchablle) for classificcation and staandard attributtes of typical bridge b elemennt. In a rrich semantic model each element in the model should d donate a very specific com mponent. This means, it shoould be assign ned to a speciific class and described with a set of prredefined propeerties and relaations with other elementss. The result will be a virttual 3D bridgge model whichh consists of components such as piers , beams and abutments and hence partiial views and sspecific inform mation can be extracted throough filtering and semantic reasoning. For tthis purpose, all IFC classses including extra classess of the IFC-Bridge extenssion and standdard property sets of IFC model m have bbeen integrateed into a referrence databasse. BIMAnnootator allows the user to assign classes of elements, edit, delete and a add new property sets, define and orrganize group p of objects hhierarchically and assign atttributes to thhem. The semaantic data which are entered d through the BIM-Annotattor can be exp ported in XML L format with an additionall XML-Link model, m which links the sem mantic information with 3D D objects (Figuure 13).
10
28. Forum m Bauinformaatik 2016 19.–211. September 2016, 2 Leibniz Universität H Hannover
Figure 13 BIM M-Annotator daata flow and system s architecture Figurre 14 shows thhe process of assigning a new w class and usee of the new added a propertyy set tempplate of a bridgge segment paart element. (URL L http://150.2554.208.60:300 00/projects/1/ddocuments/7)
Figure 14 Change the class and add new w properties of a bridge segmen nt part element
11
28. Forum Bauinformatik 2016 19.–21. September 2016, Leibniz Universität Hannover
Conclusion and future work In this paper we presented a workflow and study cases to generate bridge model variations based on the visual programming approach and the semantic enrichment of these models based on the IFC standard. Bridges are modeled using Dynamo standalone and as extension inside Revit. First, Dynamo plugin for Revit has been used to create the alignment and the bridge is fully modeled in Revit from adaptive families. Limitation of Revit with the Civil Structures plugin are bridge definition, substructure (supports, abutments etc.) from the templates are freely modifiable, but not all bridge types can be modeled. Here, the users have less choice to create complex shape of bridge geometry through this plug in. The second study case shows the possibilities for the designer to model the bridge from scratch fully standalone in Dynamo visual programming workspace. The parameters such as adjustment of dimensions, insertion or movement of components can be managed automatically through nodes in Dynamo. The last study case offers parametric bridge modeling and variation in Revit through visual programming script. Finally, the bridge model can be driven into the BIM Annotator tool to improve the semantic quality of bridge models and link specific domain information from various domains with focus on bridge models based on the IFC standards. Acknowledgements The work presented in this paper was enabled by the financial support of the European Commission in the Eurostars research projects SE-LAB (E!7521) and BridgeCloud (E!7987). This support is herewith gratefully acknowledged.
References Langwich O., (2016) “Bridge modeling” Revit Structure Magazine 2016 URL: http://www.autocadmagazin.de/sites/default/files/magazine-pdf/acm_2016-01_archiv_reduziert.pdf Ismail, A., Srewil, Y., Scherer, R. and Mansperger, T. (2016) “Semantic Enrichment and Multimodel Data Exchange Approach for CFD Analysis of Bridges”. In: 23rd International Workshop: European Group for Intelligent Computing in Engineering (EG-ICE), Krakow, Poland, Jun. 29th – Jul. 1st, Mackenzie, Dean (2013) ”Parametric Infrastructure Design”. In: Lightweight Structures Association of Australia (LSAA) Conference. Auckland, Nov. 13-15 2013 Matthias Stark (2015) AutoDesk univeristy: “REVITalize Bridge Design” online: http://au.autodesk.com/au-online/classes-on-demand/class-catalog/2015/revit-for-construction/ci11198 Singer, D. (2015) Einsatz wissensbasierter Methoden in frühen Phasen des Brückenentwurfs In: Proceedings of the 27th Forum Bauinformatik, Aachen, Germany Tedeschi Arturo, (2014) “AAD Algorithms-aided Design: Parametric Strategies Using Grasshopper”, Le Penseur Publisher. Page 27 Younghwi Kim (2016) “Bridge Modeling using Dynamo” video tutorial URL: https://www.youtube.com/watch?v=LgaySpdjljA Ritter, F., Preidel, C, Singer, D. and Kaufmann, Stefan (2015), Visuelle Programmiersprachen im Bauwesen - Stand der Technik und aktuelle Entwicklungen. In: 27. Forum Bauinformatik, Aachen, Germany Wülfing, A., Windisch, R., Scherer, R. J. (2014), A visual BIM query language. In 10th European Conference on Product & Process Modelling, edited by A. Mahdavi, Bob Martens, and R. J. Scherer, 157–64: CRC Press.
12