International Journal of Research and Development in Pharmacy and Life Sciences Available online at http//www.ijrdpl.com October - November, 2014, Vol. 3, No.6, pp 1300-1303 ISSN (P): 2393-932X, ISSN (E): 2278-0238
Research Article APPROACH FOR QUANTITATIVE ESTIMATION OF EPROSARTAN MESYLATE BY UV SPECTROPHOTOMETER Rewar S*1, Bansal B K1, Singh C J2, Sharma A K2 1.
Department of pharmaceutics, Arya College of pharmacy, Jaipur – 302028, Rajasthan
2.
Department of pharmacology, Arya College of pharmacy, Jaipur – 302028, Rajasthan
*Corresponding Author: Email
[email protected]
(Received: July 27, 2014; Accepted: September 22, 2014) ABSTRACT Eprosartan Mesylate is an angiotensin II receptor (AT1) antagonist. Eprosartan Mesylate is an effective, well tolerated and potent pure competitive antagonist of the AT1 receptor and hence there has been significant research on broad range of analytical and detection techniques that could be useful in its estimation in formulations and biological matrices. A simple, sensitive and accurate UV spectrometric method has been developed for the determination of eprosartan Mesylate in raw material and experimental tablets. Beer’s law was obeyed in the concentration range 2-3µgmL-1 for the drug (=233nm) with an apparent molar absorptivity and sandell sensitivity of 2.8×10⁴Lmol-1cm-1 and0.01854µgcm-2/0.001A, respectively. The limit of detection and quantitation were calculated to be 0.3623 and 1.098 µg mL-1, respectively. Results were validated statistically according to ICH guidelines. Validation of the method yielded good result in the concerning range (2-30µg mL-1), linearity (r2 = 0.9998), precision and accuracy. The excipients present in the experimental tablet did not interfere with the method. Keywords: Eprosartan Mesylate, Beer’s Law, UV Spectrophotometry, Quantitative estimation.
INTRODUCTION
clearance being hepatic and the remainder of its systemic
During the past decade, ambulatory blood pressure (BP)
clearance is renal in origin
measurements have been consistently used in the evaluation
BP by selectively blocking the AT1 receptor as well as by
of new classes of antihypertensive drugs.
blockade of the presynaptic AT1 receptors with a resultant
[1,2]
.Such has been
[5, 6].
Eprosartan Mesylate reduces
the case with a number of the older therapeutic drug classes,
diminution in sympathetic nerve activity
such as the angiotensin converting enzyme inhibitors or the
this study was to formally evaluate the efficacy of
calcium channel blockers.
More recently, this technology
Eprosartan Mesylate administered once daily using both
has been applied to the study of the BP-lowering effects of
clinic and the more sensitive modality of 24-h ambulatory BP
the angiotensin II receptor blockers (ARB).
monitoring.
Eprosartan Mesylate is a nonphenyl, nontetrazole angiotensin
Eprosartan Mesylate is a novel angiotensin receptor
receptor blocker highly specific for the AT1 receptor
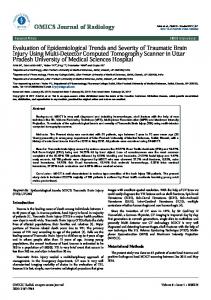
antangonist with chemical name IUPAC: (E)-2-Butyl – (1-P-
[3]
[4].
After
[7].
The purpose of
oral ingestion of Eprosartan Mesylate, peak plasma
carboxy
concentrations are reached within 2 h and the plasma half-
methane sulfonate. Its molecular weight is 520.61832
life is 5 to 9 h. Eprosartan Mesylate is not significantly
[g/mol] with molecular formula C24H28N2O7S2
benzyl)-α-2-
thenylimidazole-5-acrylic
acid
[8].
metabolized and approximately 70% of its systemic ©SRDE Group, All Rights Reserved.
Int. J. Res. Dev. Pharm. L. Sci.
1300
Rewar S . et. al., October - November, 2014, 3(6), 1300-1303
reagent blank. The absorbance of each solution at 233 nm against methanol as blank. A calibration curve was prepared by plotting absorbance versus concentration. Estimation of Eprosartan in Tablets: For the analysis of the drug in bulk, accurately weighed 10 mg sample was dissolved in 100 mL methanol in a volumetric flask. After suitable dilution, the absorbance of final sample was recorded against the blank at 233nm. For the analysis of dosage form, twenty tablets of eprosartan Mesylate (300mg) were ground to fine powder and mixed thoroughly. A quantity of powder equivalent to 10 mg of the drug was transferred to 100 mL volumetric flask and dissolved in Fig. 1: Chemical structure of Eprosartan Mesylate
about 40 ml methanol. The insoluble excipients were separated by filtration through whatman filter paper (No.
Literature survey reveals few analytical methods for the
41). After suitable dilution, the absorbance was recorded
determination of Eprosartan Mesylate in pharmaceutical
against the blank at 233nm.
preparations and biological fluids, viz. Spectrophotometry and HPLC
[10].
UV Spectroscopy
[11, 12],
HPLC
[13, 14]
[9],
methods
Recovery studies: The accuracy of the proposed method was confirmed by
are reported for simultaneous estimation of dosage form.
recovery studies. To the pre analyzed formulation a known
MATERIALS AND METHODS
amount of raw material was added and it can be analyzed
Chemicals:
by proposed method. Recovery studies were performed by
Eprosartan reference substance was obtained from Life care
adding known amount of Eprosartan Mesylate reference
Laboratories Pvt. Ltd. Hyderabad (India). The solvent used
substance (20, 40, 60 and 80 µg) to the fixed amount of
for the experiment was methanol (SD Fine Chem. Ltd.
drug in the tablet powder equivalent to 100 µg. Then the
Mumbai). All chemicals were used as obtained without further
procedure was followed as per the analysis of formulation.
purification.
The amount of each drug recovered was calculated.
Instrument:
Statistical analysis of the data was done by simple linear
A double beam UV-VIS spectrophotometer (Systronics India
regression.
Limited UV-VIS Spectrometer-2203) was employed for
RESULTS AND DISCUSSION:
spectrophotometric measurements.
Eprosartan
Preparation of Standard Stock solution:
spectrophotometric method both in raw material and in
The stock solution of Eprosartan was prepared by dissolving
tablet as a pharmaceutical formulation. The method was
accurately 10 mg of drug in 0.1N methanol in a 10 ml
validated according to the guidelines of International
volumetric flask to obtain a concentration of 1000 μg/ml.
Conference Harmonisation (ICH) [15, 16]. The drug showed
From this solution, 2.5 ml was taken and diluted with
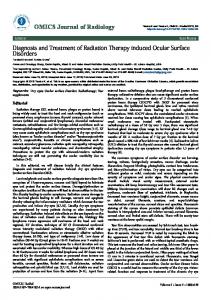
maximum absorption at 233 nm in methanol. A standard
methanol in a 25 ml volumetric flask to prepare a working
calibration curve of the drug was constructed by plotting
standard solution (100μg/ml).
absorbance versus concentration (Figure 2). The linear
Calibration curve:
regression
Aliquots (0.2, 0.4, 0.6, and 0.8 up to 3mL) of working
Y=0.0532X+0.0054 (Y = absorbance, X = concentration in
standard solution were transferred into series of 10 mL
µg mL-1) with correlation coefficient of 0.9998. Beer’s law
volumetric flasks and diluted by methanol to give the
was obeyed over the concentration range of 2-30 µg mL-1
concentration of 2-30µg mL-1. The above solutions were
with apparent molar absorptivity and sandell sensitivity of
Mesylate
equation
was
was
analyzed
calculated
by
UV
to
be
scanned over the range of 400 nm to 200 nm against ©SRDE Group, All Rights Reserved.
Int. J. Res. Dev. Pharm. L. Sci.
1301
Rewar S . et. al., October - November, 2014, 3(6), 1300-1303
Fig. 2: Calibration curve of Eprosartan Mesylate against methanol as blank.
2.8 ×10⁴ L.mol-1cm-1 and 0.01854 µg cm-2/0.001A,
CONCLUSION:
respectively. The limits of detection and limit of quantitation
The method is very simple, sensitive, accurate, precise and
were calculated to be 0.3623 and 1.098 µg mL-1,
rapid. Since no UV spectrophotometric method is reported
respectively.
a
for Eprosartan Mesylate from bulk and pharmaceutical
correlation coefficient (r) of 0.9998 indicates a good
formulation, the present method may be useful for routine
linearity between absorbance and concentration in the range
quality control test and analysis of Eprosartan Mesylate from
of 2-30 µg mL-1
bulk as well as tablet.
The low value of % relative standard deviation (RSD =
REFERENCES 1. Myers MG: Ambulatory blood pressure monitoring in the assessment of antihypertensive therapy. Blood Press Monit 1999; 4:185–188. 2. Coats AJS, Radaelli A, Clark SJ, Conway J, Sleight P: The influence of ambulatory blood pressure monitoring on the design and interpretation of trials in hypertension. J Hypertens 1992; 10:385–391. 3. Ruddy TD, Fodor JG: Nisoldipine CC and lisinopril alone or in combination for treatment of mild to moderate systemic hypertension: Canadian Nisoldipine CC Hypertension Trial Group. Cardiovasc Drugs Ther 1997; 11:581–590. 4. White WB, McCabe EJ, Mansoor GA: Comparison of office and ambulatory blood pressure measurements to assess the angiotensin II receptor antagonist eprosartan. Blood Press Monit 1996; 1:45–51. 5. McClellan KJ, Balfour JA: Eprosartan. Drugs 1998; 55:713–718. 6. Sica DA, Hollenberg N: The renal profile of eprosartan, a novel AT1-receptor antagonist. Pharmacotherapy 1999; 19:86S–94S. 7. Ohlstein EH, Brooks DP, Feuerstein GZ, Ruffolo RR Jr: Inhibition of sympathetic outflow by the angiotensin II receptor antagonist eprosartan, but not by losartan, valsartan or irbesartan: relationship to differences in
The
linear
regression
equation
with
0.309, n=7) of intra-day assay and inter day assay (%RSD = 1.11, n=5) confirm the high degree of precision of the proposed method. The interference of excipients used in the formulation was studied. The assay result of tablets obtained by the proposed method was found to be 99.83±0.740%. Low value of standard deviation indicates the method to be precise. The
observed
concentrations
of
Eprosartan Mesylate
reference substance in the tablets were not significantly different from the stated concentration by student’s t test, P= 0.05 (99.02%, n=6). To evaluate the validity and accuracy the recovery studies were carried out. The percentage recovery (98.60±0.725, n=4) indicates the accuracy of the method and absence of interference of excipients present in the formulation. The ANOVA analysis showed there is no significant difference (Fstat value < tabulated F Value at P=0.05) among the assay result obtained in three different days at different times as compared to reported capillary zone electrophoretic method [17].
©SRDE Group, All Rights Reserved.
Int. J. Res. Dev. Pharm. L. Sci.
1302
Rewar S . et. al., October - November, 2014, 3(6), 1300-1303
8. 9.
10.
11.
12.
13.
14.
15.
prejunctional angiotensin II receptor blockade. Pharmacology 1997; 55:244–251. The Merck Index, 14th edition, Merck Research Laboratories, (Monograph #3635), 621(2006). Kamila MM, Mondal N, Ghosh LK (2008) Spectrophotometric Determination of Eprosartan Mesylate in Raw Material and Experimental Tablets. Indian Journal of Chemical Technology 15: 194-196. Kumar P, Ramulu S (2010) Stability Indicating RP-HPLC Method for Determination of Eprosartan in Pure and Pharmaceutical Formulation. International Journal of Pharmaceutical Sciences Review and Research 4: 5459. Hemke AT, Bhure MV, Chouhan KS, Gupta KR, Wadodkar SG (2010) UV spectrophotometric determination of hydrochlorthiazide and olmesartan medoxomil in pharmaceutical formulation. European Journal of Chemistry 7: 1156-1161. Ferreiros N, Iriarte G, Alonso RM, Jimenez RM and Ortiz E, J.Chromatogr. A, 1119(1 – 2), 2006, 309 – 314. Gupta Y, Shrivastava A, Duggal D, Patel A, Agrawal S (2009) A new RPHPLC method for simultaneous estimation of nebivolol hydrochloride and hydrochlorthiazide in dosage forms. Pharmaceutical Analysis 1: 264-269. M. T. Raju, S. Gurrala, Developmet and Validation of HPLC-UV Method for the Estimation of Eprosartan in Human Plasma, Int. J. Pharmaceut. Pharmaceut. Sci., 3(2), 58-61 (2011). ICH guidelines Q2A. Text on validation of analytical procedures: Methodology. In the proceedings of International Conference on Harmonization, Geneva, March 1994, pp 1 – 5.
16. ICH guidelines Q2B. Text on Validation of analytical procedures: Methodology in the proceedings of International Conference on Harmonization, Geneva, March, 1996, pp. 1 – 8. 17. Hillaert S and Van den Bossche, J. Pharm.Biomed.Anal., 31, 2003, 329 – 339.
How to cite your article: Rewar S., Bansal B. K., Singh C. J., Sharma A. K.., “Approach for quantitative estimation of eprosartan mesylate by U.V. spectrophotometer”, Int. J. Res. Dev. Pharm. L. Sci., 2014, 3(6), pp. 1300-1303. ©SRDE Group, All Rights Reserved.
Int. J. Res. Dev. Pharm. L. Sci.
1303