Research Article www.acsami.org
Appropriate Size of Magnetic Nanoparticles for Various Bioapplications in Cancer Diagnostics and Therapy Xiaomeng Guo,† Zhe Wu,‡ Wei Li,† Zuhua Wang,† Qingpo Li,† Fenfen Kong,† Hanbo Zhang,† Xiuliang Zhu,§ Yiping P. Du,∥ Yi Jin,*,⊥ Yongzhong Du,† and Jian You*,† †
College of Pharmaceutical Sciences, Zhejiang University, 866 Yuhangtang Road, Hangzhou, Zhejiang 310058, P. R. China Center for Brain Imaging Science and Technology, Department of Biomedical Engineering, Zhejiang University, 38 Zheda Road, Hangzhou, Zhejiang 310027, P. R. China § Department of Radiology, The Second Affiliated Hospital, Zhejiang University School of Medicine, 88 Jiefang Road, Hang Zhou, Zhejiang 310009, P. R. China ∥ School of Biomedical Engineering, Shanghai Jiao Tong University, 800 Dongchuan Road, Shanghai 200240, P. R. China ⊥ National Pharmaceutical Engineering Center for Solid Preparation in Chinese Herbal Medicine, Jiangxi University of Traditional Chinese Medicine, Nanchang, Jiangxi 330006, P. R. China ‡
S Supporting Information *
ABSTRACT: The development of multifunctional nanoparticles has attracted increasing attention. The versatility of nanoparticles largely depends on their physiochemical properties (especially size). However, the optimized size range may be different for the bioapplications of each function associated with multifunctional nanoparticles. It is important to investigate every optimized size range to ascertain which size enables the best function of the nanoparticles before deciding their final size. In this work, we synthesized a series of monodisperse Fe3O4 nanoparticles with identical surface properties ranging in size from 60 to 310 nm and systematically investigated their biobehavior and application. Our data indicate that compared to their large counterparts, small Fe3O4 nanoparticles exhibited greater cellular internalization and deeper penetration into multicellular spheroids, thus enabling a higher photothermal ablation efficacy in vitro. Interestingly, larger Fe3O4 nanoparticles showed greater accumulation in tumors, thereby inducing more efficient tumor growth inhibition. In addition, 120 nm may be the optimal diameter of Fe3O4 nanoparticles for magnetic resonance imaging and photoacoustic tomography in vitro. However, more efficient in vivo imaging mediated by Fe3O4 nanoparticles will predominantly depend on their high accumulation. Our work presents a different appropriate size range for each biofunction of Fe3O4 nanoparticles, which could be a valuable reference for future nanoparticle design. KEYWORDS: nanoparticle size, Fe3O4 nanoparticles, magnetic resonance imaging, photoacoustic tomography, photothermal therapy
1. INTRODUCTION Nanomedicine has offered new strategies for cancer treatment resulting from the unique advantages of nanoparticles over small molecules. The intrinsic optical, thermal, electrical, or magnetic properties of the nanoparticles can be utilized for imaging or therapeutic purposes. Interest in constructing multifunctional nanoparticles has recently grown rapidly. Nanoparticles can be utilized for simultaneous delivery of therapeutic agents to the tumor area, real-time tracking of their biodistribution and fate in vivo, and evaluation of the therapeutic efficacy.1−7 Multifunctional bioapplications of the nanoparticles largely depends on their physiochemical properties (particularly particle size).8−14 For example, liposomes of 100 nm in diameter and albumin particles of 130 nm in diameter were more © 2016 American Chemical Society
efficient at delivering doxorubicin and paclitaxel to the tumor site and significantly reduced the side effects of the drugs by prolonging their circulation time and altering their biodistribution.15,16 The optimized size range may be different for the bioapplication of each function associated with multifunctional nanoparticles. For example, it was reported that 16 nm gold nanoparticles were successful as a lysosomal imaging nanoprobe,17 while 2 nm gold nanoparticles, among those in the 2−15 nm size range, exhibited the best ability to penetrate into Received: October 31, 2015 Accepted: January 12, 2016 Published: January 12, 2016 3092
DOI: 10.1021/acsami.5b10352 ACS Appl. Mater. Interfaces 2016, 8, 3092−3106
Research Article
ACS Applied Materials & Interfaces
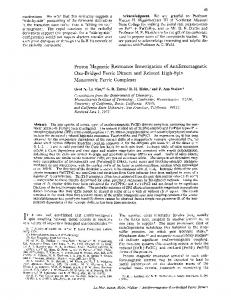
Figure 1. Characterization of Fe3O4-60, Fe3O4-120, Fe3O4-200, and Fe3O4-310 nanoparticles. (A) TEM images of the Fe3O4 nanoparticles. Scale bar, 200 nm. (B) XRD graphs of the synthesized Fe3O4 nanoparticles of different sizes. (C) Spectrum of the nanoparticles at wavelengths between 400 and 1000 nm and corresponding photographs of the Fe3O4 nanoparticles dispersed in pure water.
tumor tissue.,14 It is difficult to best optimize each function simultaneously for multifunctional nanoparticles of a fixed size. The optimized size of the multifunctional nanoparticles should be chosen based on the greatest ability to perform each function. Therefore, it is necessary to investigate every optimized size range for each function of the nanoparticles before making a decision regarding size. Unfortunately, few studies have focused on studying every appropriate size range for each biofunction of multifunctional nanoparticles ahead and then choosing the final size. Iron oxide nanoparticles, which have been widely used in biomedical research, have multiple functions, such as molecular imaging, drug delivery, magnetic targeting, and photothermal therapy.18−22 The effect of size on the bioapplications of iron oxide nanoparticles has been often reported but only limited in the field of magnetic resonance imaging (MRI), and the investigated size was also limited to a narrow range (4−12 nm).23,24 An investigation of iron oxide nanoparticles over a larger size range and of the size effect on diverse biofunctional applications is needed. In this study, we first synthesized a series of monodisperse Fe3O4 nanoparticles with similar surface properties over a wide size range. We focused on nanoparticles with diameters of 60, 120, and 200 nm, which covers the typical size range, as well as on those with a diameter of 310 nm, which is close to the pore cutoff size range (400−600 nm) of systemic nanomaterials for extravasation from tumor vasculature.25 Thus, a distinctly wider size range of iron oxide nanoparticles was considered in our work compared to that examined in previous studies. The effect of nanoparticle size on various biobehaviors and functions, including cellular uptake, biodistribution, tumor tissue penetration, MRI, photoacoustic tomography (PAT) and photothermal therapy, was investigated in detail.
amount of materials used are listed in Table S1. Different sized nanoparticles could be obtained mainly by adjusting the FeCl3 concentration and reaction time. Transmission electron microscopy (TEM) images showed that all of the nanoparticles possessed a regular spherical shape (Figure 1A). The diameters of the nanoparticles are listed in Table S2. The average size of the four types of Fe3O4 nanoparticles determined by dynamic light scattering (DLS) (Figure S1A) was slightly larger than that determined by TEM, which could be due to the effect of a hydration layer covering the nanoparticle surface during DLS measurements. The zeta potential of the four types of nanoparticles ranged from −26.1 to −31.1 eV (Figure S1B); this parameter did not vary significantly due to the nearly identical chemical components of the different nanoparticles. Diffractograms obtained by X-ray diffraction (XRD) are presented in Figure S2 (standard Fe3O4) and Figure 1B (different sized Fe3O4 nanoparticles). The position and relative intensity of all characteristic diffraction peaks of the representative Fe3O4 nanoparticles (Fe3O4-60) closely matched those of the standard Fe3O4 nanoparticles (Figure S3), indicating the successful synthesis of the nanoparticles. An aqueous suspension of the nanoparticles showed a broad and continuous absorption spectrum over wavelengths ranging from 400 to 1000 nm (Figure 1C), and the intensity increased with increasing nanoparticle concentration (Figure S4A). The absorbance intensity of the nanoparticles in the near-infrared (NIR) region (808 nm) was linearly correlated with the particle concentration (Figure S4B). Furthermore, all Fe3O4 nanoparticles were well dispersed in water and stable for more than three months without any aggregation. These results indicated that despite their different sizes, the four types of Fe3O4 nanoparticles demonstrated similar physicochemical properties. 2.2. Cytotoxicity. The toxicity of the Fe3O4 nanoparticles was assessed using an assay based on the MTT method. The results demonstrated that exposure to Fe3O4 nanoparticles at concentrations ranging from 0 to 2000 μg/mL for 24 or 48 h induced very little toxicity in MCF-7 and HeLa cells (Figure S5). The cell viability at 48 h was reached approximately 60%, even at a nanoparticle concentration of 2000 μg/mL. As for normal cells, the different sized Fe3O4 nanoparticles also exhibited low toxicity to HUVEC or L929 cells (Figure S6). These results suggested the good biocompatibility of the four types of Fe3O4 nanoparticles.
2. RESULTS 2.1. Properties of Fe3O4 Nanoparticles of Four Sizes. Four types of Fe3O4 nanoparticles measuring 60−310 nm (denoted Fe3O4-60, Fe3O4-120, Fe3O4-200, and Fe3O4-310) were synthesized using a modified solvothermal reaction at 200 °C by reduction of FeCl3 with ethylene glycol in the presence of sodium acetate as an alkali source and trisodium citrate as an electrostatic stabilizer. The reaction parameters and 3093
DOI: 10.1021/acsami.5b10352 ACS Appl. Mater. Interfaces 2016, 8, 3092−3106
Research Article
ACS Applied Materials & Interfaces 2.3. Labeling of Fe3O4 Nanoparticles by Fluorescent Probe. To study the uptake or penetration of different sized Fe3O4 nanoparticles in cells or tumor, fluorescent 6-courmarin, and ICG was used to label and track the localization and quality of the nanoparticles. After a mixture of fluorescent dye and Fe3O4 nanoparticles, the nanoparticles were centrifuged and the precipitate was washed with PBS (pH 7.4). The washing cycle was repeated until the supernatant became colorless. We found that less than 10% labeled fluorescent molecules were released from the nanoparticles in 10 h when the nanoparticles were suspended in PBS (pH 7.4) at 37 °C. As a result, the fluorescent probe was employed for tracking our nanoparticles. The amount of dye molecules was adjusted to ensure of the commensurable drug loading efficiency for the four types of nanoparticles. The drug loading efficiency of the 6-coumarin and ICG for the four types of nanoparticles was 5.8% and 4.2%, respectively. In addition, because the dye molecules may separate from nanoparticles after a long time in vivo, we used other methods (inductively coupled plasma mass spectrometry, ICP-MS) to identify the accuracy of the results of experiments involving fluorescent nanoparticles. 2.4. Uptake of Fe3O4 Nanoparticles by Monolayer Cells. The cellular uptake of the Fe3O4 nanoparticles by MCF-7 and HeLa cells was examined over a short period (0−4 h, Figures S7 and S8) and a long period (0−48 h, Figure 2A and 2B), respectively. After 0.5 h of incubation with the four types of Fe3O4 nanoparticles, weak fluorescence was observed in the cytoplasm of both cell lines (Figure S7). The average fluorescence intensity in the cells increased with the incubation time. For example, the geometric mean of fluorescence in MCF-7 cells increased from 16.7 to 43.7 as the incubation period with 6-coumarin-labeled Fe3O4-60 nanoparticles increased from 0.5 to 4 h (Figure S8). The results were similar for Fe3O4-120, Fe3O4-200, and Fe3O4-310 nanoparticles. Interestingly, the average florescence in the two cell lines after incubation with the four types of Fe3O4 nanoparticles increased from 0.5 to 24 h and then clearly decreased from 24 to 48 h (Figure 2A). For example, the geometric mean of fluorescence in MCF-7 cells incubated with Fe3O4-60 nanoparticles was 1.9 and 23.1 for incubation times of 0.5 and 24 h, respectively, but this value decreased to 11.4 at 48 h (Figure 2C). Thus, it appeared that 24 h of incubation induced the greatest cellular internalization of the nanoparticles (Figure 2C and S8). The average florescence intensities observed intensities in MCF-7 cells at 24 h after incubation with Fe3O4-60 nanoparticles were 1.7-, 1.9-, and 5.2-fold higher than those observed for the Fe3O4-120, Fe3O4-200, and Fe3O4-310 nanoparticles, respectively, indicating that the Fe3O4-60 nanoparticles exhibited the greatest capacity for cellular internalization. TEM imaging demonstrated that all four types of Fe3O4 nanoparticles were located in the cytoplasm after 24 h of incubation (Figure 2D). The Fe content was measured using ICP-MS after the incubating of the cells with the nanoparticles for 24 h, and similar trends indicating that smaller Fe3O4 nanoparticles exhibited greater cellular internalization were obtained (Figure 2E). 2.5. Photothermal Effect in Vitro. To evaluate the photothermal conversion ability of the nanoparticles, we monitored the temperature change of nanoparticle suspensions under continuous NIR laser irradiation (808 nm, 1.5 W/cm2, 10 min). All of the nanoparticle suspensions exhibited a similar rise in temperature (from 25 °C to nearly 70 °C in 5 min), whereas the temperature of PBS remained nearly constant (Figure 3A). No significant difference in the photothermal
conversion ability of Fe3O4 nanoparticles mearsuring 60−310 nm in diameter was observed under the same conditions. The temperature change was also observed to be dependent on the nanoparticle concentration (Figure S9). At temperatures above those that cause hyperthermia (42−47 °C), cancer cells can be selectively destroyed due to their reduced heat tolerance relative to that of normal cells.26 In this work, a NIR irradiation power of 1.5 W/cm2 was used for all experiments, unless specified otherwise, to achieve the ∼15 °C rise in temperature required to destroy cancer cells within minutes. Then, the ability of different sized Fe3O4 nanoparticles to ablate cancer cells via the photothermal effect in vitro was investigated using fluorescence microscopy after staining cells with calcein AM (for live cells) and EthD-1 (for dead cells) (Figures 3B and S10). Significant death of MCF-7 and HeLa cell death was observed after incubation with the four types of Fe3O4 nanoparticles and NIR laser irradiation (808 nm, 1.5 W/cm2, 3 min) because of the photothermal effect. As a control, NIR laser irradiation alone under the above-mentioned condition induced barely any cell death. Small Fe3O4 nanoparticles clearly caused more death of both cell lines. These results indicated that small Fe3O4 nanoparticles showed a greater capability for photothermal ablation of monolayer cells. Because the photothermal conversion efficiencies of the four types of Fe3O4 nanoparticles were similar at the same nanoparticle concentration (Figure 3A), the higher photothermal ablation ability of small Fe3O4 nanoparticles could be attributed to their greater cellular internalization, which produced a higher intracellular nanoparticle concentration (Figure 2). Cell viability upon NIR laser irradiation was also investigated via an MTT assay (Figure 3C). For example, the MCF-7 cell survival percentages after treatment with for Fe3O460, Fe3O4-120, Fe3O4-200, or Fe3O4-310 were 50.9 ± 1.8%, 65.6 ± 3.6%, 70.8 ± 4.2%, and 81.4 ± 4.9%, respectively, at 24 h after irradiation. NIR laser irradiation alone did not induce significant cell death. These results further confirmed that small Fe3O4 nanoparticles exhibited a high photothermal ablation efficacy in cells due to their high cellular uptake, which was consistent with the cellular uptake observed by fluorescence microscopy (Figures 3B and S10). 2.6. Penetration of Fe3O4 Nanoparticles into Multicellular Spheroids. Multicellular tumor spheroids, one of the most widely used three-dimensional (3D) culture systems, have been shown to have many advantages over two-dimensional (2D) culture systems for cancer research because they more closely approximate in many aspects of the pathophysiological conditions of human tumor tissue.27 After incubation with 6-coumarin-labeled Fe3O4 nanoparticles for 24 h, individual MCF-7 cell spheroids were imaged in every 10 μm sections of tissue from the top to the middle using two-photon microscopy, and 3D images of the spheroids were reconstructed using Imaris software (Bitplane AG, Zurich, Switzerland). The results revealed that Fe3O4-60, Fe3O4-120, Fe3O4-200 and Fe3O4-310 penetrated the spheroids to depths of approximately 83.5, 69.7, 42.6, and 35.6 μm, respectively, based on the fluorescent intensity measured in each section. Small Fe3O4 nanoparticles clearly penetrated deeper into the spheroids than did large Fe3O4 nanoparticles (Figure 3D). 2.7. Photothermal Ablation of Multicellular Spheroids. We further investigated the photothermal ablation efficacy of different sized Fe3O4 nanoparticles after NIR laser irradiation (808 nm, 1.5 W/cm2, 3 min), MCF-7 cell spheroids, an in vitro tumor model. The spheroids in the control group 3094
DOI: 10.1021/acsami.5b10352 ACS Appl. Mater. Interfaces 2016, 8, 3092−3106
Research Article
ACS Applied Materials & Interfaces
Figure 2. Cellular internalization of Fe3O4-60, Fe3O4-120, Fe3O4-200, and Fe3O4-310 nanoparticles by MCF-7 and HeLa monolayer cells. (A) Confocal laser scanning microscopy images of MCF-7 and HeLa cells after 1, 4, 12, 24, and 48 h of incubation at 37 °C with different nanoparticles (green). Nuclei were stained with Hoechst 33258 (blue). Scale bar, 100 μm. (B) Flow cytometry analysis of MCF-7 and HeLa cells after 1, 4, 12, 24, and 48 h of incubation at 37 °C with different nanoparticles. (C) Fluorescence intensity of MCF-7 and HeLa cells after incubation for different time periods with nanoparticles. (D) TEM images of MCF-7 cells treated with 50 μg/mL Fe3O4 nanoparticles for 24 h. Boxed regions are enlarged in the adjacent panels. (E) Quantitative ICP-MS measurements of Fe3O4 nanoparticles uptake by MCF-7 and HeLa cells treated as described for panel D. All of the data are represented as the average ± SD.
layers of the spheroids were efficiently killed due to the photothermal ablation effect of the internalized Fe3O4 nanoparticles, which was mediated by NIR laser irradiation. Furthermore, we investigated the apoptosis-inducing effect of photothermal ablation (Figure S11). The cellular apoptosis percentages for spheroids treated with Fe3O4-60, Fe3O4-120, Fe3O4-200, or Fe3O4-310 under NIR laser irradiation (74.97%, 65.61%, 54.98%, and 34.57%, respectively) were significantly greater than the percentage observed in the absence of treatment. The higher cellular apoptosis percentage for spheroids treated with small Fe3O4 nanoparticles under NIR laser irradiation
(no treatment) were tightly organized and grew continuously throughout the entire experimental period. However, the growth of the spheroids in all the nanoparticle-treated groups was clearly suppressed (Figure 3E). On day 9, the average spheroid diameters of the Fe3O4-60-, Fe3O4-120-, Fe3O4-200-, and Fe3O4-310-treated groups were 61.87%, 68.18%, 76.26%, and 85.86%, respectively, compared to the spheroid diameter of the control group (Figure 3F). The deep penetration and high cellular uptake of Fe3O4-60 may largely explain why these particles demonstrated the best inhibitory effect against the spheroids. The diameter of the spheroids was markedly smaller on day 9 relative to day 1, suggesting that the cells in the outer 3095
DOI: 10.1021/acsami.5b10352 ACS Appl. Mater. Interfaces 2016, 8, 3092−3106
Research Article
ACS Applied Materials & Interfaces
Figure 3. Photothermal ablation effect of nanoparticle suspensions on cells in vitro. Penetration and photothermal ablation effect of different sized Fe3O4 nanoparticles (50 μg/mL) into multicellular tumor spheroids. (A) Plots of temperatures as a function of irradiation time for Fe3O4-60, Fe3O4-120, Fe3O4-200, and Fe3O4-310 nanoparticles suspensions. The concentration of each suspension was the same. The laser power density was 1.5 W/cm2 for 3 min. (B) Photothermal ablation of MCF-7 cells with different sized nanoparticles. NIR laser was delivered at an output power of 1.5 W/cm2 for 3 min. Cells were stained with calcein AM (green) and EthD-1 (red) to visualize of live and dead cells, respectively. Scale bar, 100 μm. (C) Quantified data obtained from MTT assays of cells exposed to the same procedure in (B) and Figure S8. (D) 3D images (right panel) of MCF-7 spheroids after incubation with different Fe3O4 nanoparticles for 24 h. The representative confocal images (left panel) were taken every 10 μm section from the top to the middle of a spheroid, and the 3D image was reconstructed using Imaris software. (E) Growth inhibition assay in MCF-7 spheroids. Representative images of spheroids treated with four types of nanoparticles. The spheroids were irradiated with an 808 nm laser after incubation for 24 h (laser density: 1.5W/cm2 for 3 min). Spheroids were cultured in RPMI 1640 medium (with only laser irradiation) as a control; representative images of spheroids observed using an inverted microscope on days 0, 1, 3, 5, 7, and 9 are shown. Scale bar, 300 μm. (F) The diameter change histograms of spheroids after treatment with different Fe3O4 nanoparticles and laser irradiation. The nanoparticle concentration in each well was 50 μg/mL. Spheroids treated only with the laser treatment served as the control (n = 3). All of the data are represented as the average ± SD; the data were analyzed by one-way ANOVA (0.01 < *P ≤ 0.05; **P ≤ 0.01;).
The results indicated that the nanoparticles were mainly accumulated in the liver, spleen, kidney, and tumor. The intratumoral amounts (represented as the fluorescence intensity) of Fe3O4-60, Fe3O4-120, Fe3O4-200, and Fe3O4-31 was 33.4 ± 1.8, 44.4 ± 11.0, 49.3 ± 5.2, and 38.3 ± 5.2, respectively, at 2 h and increased to 36.9 ± 4.4, 61.9 ± 3.2, 120.7 ± 9.1, and 237.9 ± 7.5, respectively, at 48 h postinjection (Figure 4B). Interestingly, large Fe3O4 nanoparticles induced showed greater accumulation in tumors in vivo than did small nanoparticles; this was in contrast to the trend observed fornanoparticle penetration of and uptake by multicellular spheroids, which served as an in vitro tumor model. Fe3O4-310 showed the best tumor retention and induced the brightest
should also be attributed to their deeper penetration and greater cellular uptake of the nanoparticles. 2.8. Biodistribution of Fe3O4 Nanoparticles. The realtime biodistribution of Fe3O4 nanoparticles was investigated using an in vivo fluorescence imaging system. Mice were imaged at various time points after intravenous injection of ICG-labeled different sized Fe3O4 nanoparticles. Over time, all the fluorescence signals increased in the tumors, and the fluorescence intensities were maintained for less than 2 days (Figure 4A). The fluorescence images of major organs and tumors at 2, 4, 8, 12, 24, and 48 h after injection were gathered (the image of 48 h was represented in Figure S13), and the fluorescence intensity in various tissues was quantitated (Figure S12). 3096
DOI: 10.1021/acsami.5b10352 ACS Appl. Mater. Interfaces 2016, 8, 3092−3106
Research Article
ACS Applied Materials & Interfaces
Figure 4. Biodistribution, further validation and analysis of Fe3O4-60, Fe3O4-120, Fe3O4-200, and Fe3O4-310 nanoparticles in vivo. (A) Whole body and tumor fluorescence images in S180 tumor-bearing mice after intravenous injection of 200 μL of ICG-labeled Fe3O4 nanoparticles at a concentration of 5 mg/mL Fe3O4. (B) Semiquantitative analysis of fluorescence intensity in tumors at 2, 24, and 48 h postinjection. (C) Fe content in tumors at 2, 24, and 48 h after intravenous injection of 200 μL of Fe3O4 nanoparticles at 5 mg/mL. (D) Representative TEM images of tumor tissues at 24 h after the administration of Fe3O4 nanoparticles. Yellow arrows indicate the Fe3O4 nanoparticles. Boxed regions are enlarged in the adjacent panels. (E) The localization of 6-coumarin-loaded Fe3O4 nanoparticles (green) in tumor cells. Distribution of Fe3O4-60, Fe3O4-120, Fe3O4200, and Fe3O4-310 nanoparticles in tumor cells rich in or free of microvessels or free of microvessels. Nuclei were stained with DAPI (blue), and the microvessels were stained with a fluorescent CD 31 antibody (red). Scale bar, 100 μm. All of the data are represented as the average ± SD.
was colocalized with red fluorescence, indicating that the nanoparticles simply remained in the microvessels after their accumulating in tumors. The excessively large size of the Fe3O4310 nanoparticles prevented them from extravasating from the microvessels and thus penetrating deeper into the tumor matrix. However, for Fe3O4-60, Fe3O4-120, and Fe3O4-200 nanoparticles, the location of the greatest green fluorescence intensity did not completely match that of the tumor microvessels, indicating that nanoparticles measuring 60− 200 nm could extravasate from the microvessels. Furthermore, stronger green fluorescence intensity was observed for large Fe3O4 nanoparticles, indicating that larger Fe3O4 nanoparticles accumulated in and were retained by tumors to a greater extent, in accord with the results obtained from the biodistribution study (Figures 4B and 4C). 2.9. MRI of Fe3O4 Nanoparticles. The magnetization curves of Fe3O4 nanoparticle powders were measured at room temperature. High saturation magnetization is essential for the effective utilization of magnetic force.28 The saturation magnetization values obtained for Fe3O4-60, Fe3O4-120, Fe3O4-200, and Fe3O4-310 were 63.0, 73.4, 48.6, and 67.5 emu/g, respectively (Figure S16), clearly demonstrating an increase with particle size. This result can be attributed to the fact that
fluorescence in the tumors. To avoid fluorescence signal overlap of other organs (such as liver), mice bearing tumor on the hind leg was unitized to identify distribution of nanoparticles (Fe3O4-200 as represent) (Figure S14). The fluorescence intensity of mice with tumor in armpit and hind leg was accordant. The fluorescence images and florescence intensity of exercised tissues at 48 h after injection were showed (Figure S15). ICP-MS was used to determine the amount of iron atoms that accumulated in the tumors; 6.0 ± 0.5, 11.4 ± 0.3, 12.4 ± 0.2, and 15.9 ± 0.3 μg/g Fe remained in the tumors at 48 h postinjection of Fe3O4-60, Fe3O4-120, Fe3O4-200, and Fe3O4310, respectively (Figure 4C). These results further confirmed that large Fe3O4 nanoparticles accumulated in tumors to a greater extent than did small nanoparticles after injection. TEM analysis of tumor tissues demonstrated that the nanoparticles were distributed throughout the tumors (Figure 4D). To determine the relationship between nanoparticle size and the ability to penetrate into tumors, microvessels within tumor slices were stained with a CD 31 antibody (Figure 4E). The yellow fluorescence was attributed to the overlap of green (Fe3O4 nanoparticles) and red fluorescence (CD 31 antibody) fluorescence. For Fe3O4-310, almost all the green fluorescence 3097
DOI: 10.1021/acsami.5b10352 ACS Appl. Mater. Interfaces 2016, 8, 3092−3106
Research Article
ACS Applied Materials & Interfaces
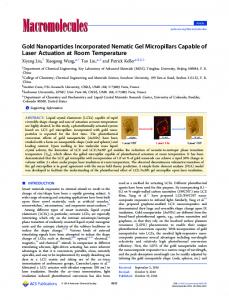
Figure 5. Magnetic resonance imaging and photoacoustic tomography study of different sized Fe3O4 nanoparticles. (A) R2 maps of aqueous solutions containing different concentrations of Fe3O4-60, Fe3O4-120, Fe3O4-200, or Fe3O4-310 nanoparticles at different concentrations. (B) T1 relaxation rates (R1) of four types of nanoparticle solutions at different Fe concentrations. (C) T2 relaxation rates (R2) of four types of nanoparticle solutions at different Fe concentrations. (D) R2 maps of MCF-7 and HeLa cells after incubation with different nanoparticles (at the same concentration) for 1, 24, and 48 h. (E) R2 values of MCF-7 and HeLa cells after incubation with different nanoparticles (at the same concentration) for 1, 24, and 48 h. (F) In vivo T2-weighted MR images of tumor-bearing nude mice before and after intravenous administration of different sized Fe3O4 nanoparticles. The yellow dashed circles indicate the tumor region. (G) T2-weighted MR image intensity in panel F. (H) Photoacoustic tomography of saline and four types of Fe3O4 nanoparticle suspensions (at the concentration of 0.5 mg/mL). (I) Photoacoustic tomography imaging of blood vessels in S180 tumor-bearing mice intravenously injected with received saline or Fe3O4-310 nanoparticles. The white dashed circles indicate the mice, and the yellow dashed circles indicate the tumor region. All of the data are presented as the average ± SD; the data were analyzed by one-way ANOVA (0.01 < *P ≤ 0.05; **P ≤ 0.01;).
Table 1. Relaxivities (mM−1 s−1) and r2/r1 Ratios of Fe3O4 Nanoparticles
large nanoparticles consistently possess high crystallinity, which induces enhances saturation magnetization.29 The MRI contrast enhancement effects of the Fe3O4 nanoparticles were investigated using a clinical 3 T MRI scanner (GE, Discovery MR 750, USA) at room temperature. R2-maps of the suspensions containing Fe3O4-60, Fe3O4-120, Fe3O4-200, or Fe3O4-310 are shown in Figure 5A. The magnetic resonance (MR) signal of R2 increased with increasing nanoparticle concentration, demonstrating the efficiency of the nanoparticles in enhancing the transverse proton relaxation process. T1 and T2 maps of the suspensions were also obtained (Figure S17). Longitudinal and transverse relaxation rates were further calculated based on the data contained in the T1 and T2 maps (Table 1). The r1 and r2 values varied linearly with Fe concentration (Figures 5B and 5C), the slopes of which were defined as the longitudinal (r1) and transverse (r2) relaxivity. The MRI
relaxivity value [mM−1 s−1] sample Fe3O4-60 Fe3O4-120 Fe3O4-200 Fe3O4-310
size (nm)
r1
r2
r2/r1
± ± ± ±
2.33 1.89 2.53 2.56
160.74 212.12 152.98 160.49
68.98 112.23 60.47 62.69
63 125 204 310
5.4 3.8 6.9 8.5
behavior of a contrast agent relies on the relaxivity ratio (r2/r1) (as a T2 contrast agent if r2/r1 ≥ 10 and as a T1 contrast agent if r2/r1 < 2).30 The relaxivity ratios of Fe3O4-60, Fe3O4-120, Fe3O4-200, and Fe3O4-310 were calculated to be 68.98, 112.23, 60.47, and 62.69, respectively; these values were clearly greater 3098
DOI: 10.1021/acsami.5b10352 ACS Appl. Mater. Interfaces 2016, 8, 3092−3106
Research Article
ACS Applied Materials & Interfaces
310 generated the highest tumor temperature (55.3 ± 2.4 °C) because these nanoparticles exhibited the highest tumor retention; the temperatures induced by Fe3O4-60 (45.4 ± 0.6 °C), Fe3O4-120 (47.6 ± 1.5 °C), and Fe3O4-200 (52.6 ± 0.5 °C) were lower. Tumor slices from mice treated with the nanoparticles exhibited apparent abnormalities or lesions compared to those from saline-treated mice and nontreated mice (control), indicative of the rapid ablation efficacy against the tumor cells (Figure S19). 2.12. In Vivo Tumor Inhibition Study. ICR mice bearing S180 tumors were treated three times (every 3 days) with an intravenous injection of PBS (1 × , 200 μL), Fe3O4-60 (200 μL, 5 mg/mL), Fe3O4-120 (200 μL, 5 mg/mL), Fe3O4-200 (200 μL, 5 mg/mL), or Fe3O4-310 (200 μL, 5 mg/mL) on days 0, 3, and 6. Photothermal treatment (808 nm, 1.5 W/cm2, 3 min) was conducted on the second day after nanoparticle injection. The growth curves of S180 tumors after various treatments and over the entire experimental course are shown (Figure 6C). The tumors in the control group (saline treated) grew fast, and the tumor volume in this group was approximately 7-fold higher on day 30 compared to day 0. Tumor growth was significantly inhibited in the nanoparticle-treated groups. Treatment with Fe3O4-310 resulted in the most remarkable tumor growth inhibition rate of 85.92%, with lower rates for treatment with Fe3O4-60 (22.61%), Fe3O4-120 (42.11%), and Fe3O4-200 (63.06%). The significantly greater efficacy of large Fe3O4 nanoparticles, which produced a small mean tumor weight 30 days after the first injection (Figure S20A), should be mainly attributed to the higher accumulation of the nanoparticles. The body weight of the mice dropped slightly from day 0 to day 3 in all the nanoparticle-treated groups, and then consistently increased in the subsequent period (Figure S20B), suggesting little general toxicity of all four types of Fe3O4 nanoparticles. Slices of major organs (heart, liver, spleen, lung, and kidney) from nanoparticle-treated mice showed no noticeable abnormalities or lesions compared to those from saline-treated mice, indicating the lack of appreciable organ damage and further suggesting the limited toxicity of the nanoparticles (Figure S21). A Ki67 assay was performed to evaluate the proliferation index of the tumors. Brown (positive) cells indicate the proliferation within the tumor. The tumors in the Fe3O4-60treated group, similar to those in the control group, showed large numbers of brown cells, indicating that these tumors retained high proliferative activity after treatment. However, in the Fe3O4-310-treated group, only a few tumor cells stained brown, indicating that this group showed the lowest tumor proliferation (Figure 6D). These results were further confirmed by the calculation of the proliferation index in the tumor slides. Fe3O4-310 reduced the proliferation index to 32.8 ± 2.6%, which was significantly lower than the indices calculated for Fe3O4-60 (68.6 ± 0.9%), Fe3O4-120 (59.7 ± 1.9%), and Fe3O4200 (50.5 ± 1.8%) (Figure 6E). The tumor cell damage induced by the photothermal effect of Fe3O4 nanoparticles was also confirmed by TUNEL assays. Generally, necrotic or apoptotic cells stain brown, whereas robust and viable cells were stained blue. As shown in Figure 6D, more tumor cells in the Fe3O4-310-treated group exhibited brown staining compared to those in the other groups. Fe3O4-310 evoked a significantly higher apoptosis index (33.3 ± 1.8%), than Fe3O460 (4.2 ± 0.3%), Fe3O4-120 (9.2 ± 0.6%), or Fe3O4-200 (11.2 ± 0.6%) (Figure 6F). These results clearly indicated that large
than those of Ferucarbotran (19, as a commercial MRI contrast agent) and other dextran-coated SPION (3−19).31 All four types of Fe3O4 nanoparticles appeared to be good candidates for T2 MRI contrast agents, as demonstrated by their high r2/r1 values under a strong magnetic field, and Fe3O4-120 showed the best sensitivity in vitro with the highest relaxivity ratio. The R2 signals of the test cells after incubation with the nanoparticles are shown in Figure 5D and 5E. Cellular internalization of the nanoparticles induced a change in the T2-weighted MR images. The R2 value (1/T2) of all cells increased from 1 to 24 h, and then decreased at 48 h. For example, for Fe3O4-60-treated MCF-7 cells, the R2 values were 16.27 ± 1.41 S−1, 29.93 ± 2.09 S−1, and 23.32 ± 1.21 S−1 at 1, 24, and 48 h, respectively. The increase in the R2 values in cells should be attributed to the increase in the cellular internalization of the nanoparticles. The results indicated that small Fe3O4 nanoparticles showed greater cellular internalization than large particles. Furthermore, the peak of the cellular uptake of the nanoparticles was obtained at 24 h, in accord with the results obtained from the cellular uptake experiment (Figure 2C). A distinct enhancement in the T2 signal of the tumors was observed after the injection of Fe3O4-60, Fe3O4-120, Fe3O4-200, or Fe3O4-310 (Figure 5F). For each type of Fe3O4 nanoparticle, the T2 signal of the tumors was significantly higher at 24 h postinjection than that at 1 h postinjection due to the increased intratumoral accumulation of nanoparticles (Figure 4A−4C). The T2-weighted MR signals of the tumors are shown in Figure 5G; these signals decreased for each type of nanoparticle, with a much lower signal at 24 h than at 3 h. Fe3O4-310 clearly induced the strongest T2 signal in the tumors among the four types of Fe3O4 nanoparticles, which should be mainly attributed to the greater accumulation of Fe3O4-310 in tumors compared to the other three types of Fe3O4 nanoparticles (Figure 4A−4C). 2.10. Photoacoustic Tomography (PAT). PAT images of the suspensions containing Fe3O4 nanoparticles under the excitation with NIR light (820 nm) are shown in Figure 5H. Almost no signal was obtained for the saline sample. A clearly enhanced photoacoustic signal was observed for all four suspensions, and the suspension containing Fe3O4-120 showed a stronger signal than the other three suspensions (Figure 5H). The four suspensions showed similar multispectral optoacoustic tomography (MSOT) signal profiles over the wavelength range of 680−980 nm for all the suspensions (Figure S18A), and Fe3O4-120 and Fe3O4-60 induced higher signals value than those measured for Fe3O4-200 and Fe3O4-310. PAT profiles were also obtained in vivo after the injection of Fe3O4-310 into mice bearing S180 tumors. A clearly enhanced photoacoustic signal were observed in tumors treated with Fe3O4-310 compared to those treated with saline (Figure 5I). The average MSOT intensity in tumors in the Fe3O4-310 group was 6249.8, representing an approximately 1.5-fold increase compared to that (4246.2) of tumors in the saline group, which should be attributed to the intratumoral accumulation of the nanoparticles (Figure S18B). 2.11. Photothermal Conversion in Vivo. After injection of Fe3O4 nanoparticles into mice bearing S180 tumors, the temperature of the tumor region quickly rose and then reached a plateau upon NIR laser irradiation, unlike what was observed in mice injected with saline (Figure 6A). The average tumor temperature was measured by analyzing infrared thermal images using FLIR QuickReport software (Figure 6B). Fe3O43099
DOI: 10.1021/acsami.5b10352 ACS Appl. Mater. Interfaces 2016, 8, 3092−3106
Research Article
ACS Applied Materials & Interfaces
Figure 6. Photothermal effect, size-dependent antitumor efficacy, and histological analysis (tumor and other tissues after long-term efficacy) study of Fe3O4-60, Fe3O4-120, Fe3O4-200, and Fe3O4-310 nanoparticles in vivo. (A) Thermographs of tumor-bearing mice that received photothermal treatment for different periods of time. (B) Plots of the average temperature increase within the tumor region as a function of irradiation time. The laser power density was 1.5 W/cm2 for 3 min. Error bars represent the standard error (n = 3). (C) Schematic of the time course of the efficacy study. In the long term efficacy study, ICR mice bearing S180 tumors were treated three times (every 3 days) with an intravenous injection of PBS (1 × , 200 μL), Fe3O4-60 (200 μL, 5 mg/mL), Fe3O4-120 (200 μL, 5 mg/mL), Fe3O4-200 (200 μL, 5 mg/mL), or Fe3O4-310 (200 μL, 5 mg/mL) on days 0, 3, and 6. Photothermal treatment was conducted on the second day after nanoparticle injection, and the laser power was 1.5 W/cm2 for 3 min. The average tumor sizes of each group was monitored over the course of the study (n = 6). (D) S180 tumors were stained with Ki67 for the tumor proliferation analyses and with TUNEL for the apoptosis analyses. Representative images of Ki67 and TUNEL staining are shown. Scale bar, 50 μm. (E) Quantification of Ki67 staining. (F) Quantification of TUNEL staining. All of the data are represented as the average ± SD; the data were analyzed by one-way ANOVA (0.01 < *P ≤ 0.05; **P ≤ 0.01;).
development of multifunctional nanoparticles. Particle size has an extremely complex effect on the biobehavior of nanoparticles.32 It was reported that very small (1 nm) and large (150−200 nm) hydrogel particles were readily internalized into HeLa cells.33 However, for Herceptin-conjugated colloidal gold nanoparticles, those measuring 40−50 nm in diameter were demonstrated to exhibit the greatest cellular internalization.34 To accumulate to a high level in tumors, nanoparticles must exhibit prolonged circulation and leverage the enhanced
Fe3O4 nanoparticles had greater antitumor efficacy than that smaller Fe3O4 nanoparticles in the present of NIR laser radiation.
3. DISCUSSION Multifunctional nanoparticles have attracted increasing attention in nanomedicine research, and the multiple functions of nanoparticles depend on specific physicochemical properties, especially size. Understanding the effects on function and ascertaining the optimal size are vital in the design and 3100
DOI: 10.1021/acsami.5b10352 ACS Appl. Mater. Interfaces 2016, 8, 3092−3106
Research Article
ACS Applied Materials & Interfaces
Few studies on antitumor drug delivery systems for in vivo applications have focused on nanoparticles measuring more than 200 nm in diameter. Generally, drug delivery systems should exhibit high accumulation in tumors, efficient extravasation from tumor microvessels and internalization into tumor cells for drug delivery and release. Thus, nanoparticles measuring more than 200 nm in diameter appear to be inadequate for in vivo applications due to their low extravasation ability. However, as a photothermal conduction agent, nanoparticles can show an appreciable photothermal ablation efficacy against tumors if they accumulate in large amounts in tumors but exhibit low extravasation. Such nanoparticles would exhibit these properties because the destruction of tumor microvessels mediated by photothermal ablation under NIR laser illumination can block nutrient supply and efficiently inhibit tumor growth; furthermore, the radiation heat directly or indirectly results in the death of tumor cells, which are more sensitive to heat than normal cells.45 As a result, the high accumulation of photothermal conduction agents in tumors appears to be more important than extravasation of the agents into tumor cells. Our data demonstrated that the in vivo photothermal ablation efficacy of Fe3O4 nanoparticles increased with increasing particle size over the size range considered (Figure 6C). Fe3O4-310 induced the highest photothermal conversion efficiency in tumors (Figure 6A and 6B) and demonstrated the strongest antitumor activity upon NIR laser irradiation (Figures 6C and S18A) because these particles showed the highest retention at the tumor site (Figure 4); these results were further confirmed by Ki67 staining for cell proliferation and TUNEL staining for apoptosis (Figure 6D−6F) in tumor tissues. Furthermore, the toxicity of the four types of Fe3O4 nanoparticles was evaluated in vitro and in vivo. The results indicated that the particles exhibited little toxicity in cells over the concentration range of 0−2000 μg/mL with no NIR laser treatment, and there was no obvious organ damage over a 30-day treatment period after injecting the nanoparticles under NIR laser irradiation (Figures S5, S6, S19, and S20B). The in vitro MRI properties of the four types of Fe3O4 nanoparticles were investigated. The relaxivity ratios (r2/r1) of the suspensions (Figure 5B and 5C; Table 1) was much greater than 10, demonstrating that all types of nanoparticles are good candidates for T2 MRI contrast agents. Fe3O4-120 showed the highest relaxivity ratio, suggesting that among the four nanoparticle diameters investigated in this study, those with a diameter of 120 nm may be the most efficient contrast agent for MRI. It was reported that better MRI efficiency demands a higher saturation magnetization; our data are shown in Figure S16. The saturation magnetization is generally related to the crystallinity of nanoparticles.23 It can be observed in Figure 1B that Fe3O4-120 had the narrowest half bandwidth and highest peak height, which indicate the high crystallinity of nanoparticles, and these properties might explain why Fe3O4-120 exhibited the largest relaxivity ratio in vivo. The in vitro cell MRI images showed that cells treated for 24 had the largest R2 value, suggesting the greatest cumulative cellular uptake of nanoparticles at this time point (Figure 5D and 5E). This observation is in accordance with the results of the cellular uptake experiment (Figure 2C). On the other hand, a higher R2 value was observed for smaller nanoparticles compared to larger nanoparticles, which could be mainly attributed to the high internalization of small Fe3O4 nanoparticles into cells in vitro (Figure 5E). The progressive signal decrease in the tumor region observed by in vivo MRI (Figure 5F) was in accordance with the
permeability and retention (EPR) effect due to the greater vascular fenestration that occurs in tumors compared to normal tissues;35 these abilities are highly dependent on particle size. Furthermore, size effects the adsorption of proteins on the nanoparticles and their resulting reticuloendothelial system (RES) clearance.36 The optimal particle size that favors tumor extravasation has been investigated frequently.37−39 Iron oxide nanoparticles have been widely investigated because of their prominent applications in biological fields. To date, studies of the size effect of iron oxide nanoparticles on their bioapplications have been limited to a relatively small size range and have mainly focused on MRI applications. In this work, Fe3O4 nanoparticles with diameters distributed over a much wider size range (60−310 nm) were systematically and comprehensively investigated. We investigated the uptake of different sized Fe3O4 nanoparticles by monolayer cells and 3D multicellular spheroids. Our data demonstrated that small Fe3O4 nanoparticles were more easily internalized into cells and more deeply penetrated into multicellular spheroids (Figures 2, 3D, S7, and S8). As a result, Fe3O4-60 showed a greater photothermal ablation efficacy against cells and multicellular spheroids (Figures 3 and S11). Smaller nanoparticles can be more easily internalized into cells, and these findings regarding the size effect of Fe3O4 nanoparticles on cellular uptake are consistent with those obtained using other conventional nanoparticles in previous studies.40−43 Interestingly, the in vivo results obtained after injecting differently sized Fe3O4 nanoparticles into mice bearing S180 tumors were completely different from those obtained in vitro by incubating the nanoparticles with 3D multicellular spheroids. Large Fe3O4 nanoparticles showed greater retention and accumulation in tumors (Figure 4) than did small nanoparticles, which was in direct contrast to the in vitro results of nanoparticle penetration of and uptake into multicellular spheroids (Figure 3D). Fe3O4-310, with a diameter close to the upper size limit for extravasation from tumor vasculature (400−600 nm), showed more than a 2-fold increase in accumulation and retention in tumors at 48 h after injection compared to the corresponding values observed for Fe3O4-60; these results were obtained by measuring both the fluorescent intensity and Fe concentration in tumors (Figure 4B and 4C). The intratumoral distribution of different sized Fe3O4 nanoparticles was further investigated by comparing the localization of nanoparticles and tumor microvessels. Fe3O4 nanoparticles measuring 60−200 nm in diameter could easily extravasated from the microvessels and penetrated deep into the tumor matrix. However, for almost all Fe3O4-310 nanoparticles were retained in tumor microvessels, and did not penetrate into the tumor matrix (Figure 4E), although these nanoparticles showed the highest accumulation in tumors among the four types of Fe3O4 nanoparticles. A possible explanation for why more of the larger nanoparticles remained in the tumor is as follows. The pore size for tumor leakage is between 50 and 500 nm, and the nanoparticles in this size range can enter and exit the tumor. The amount of nanoparticles in the tumor is changes constantly and increases over time. Smaller nanoparticles move faster than larger ones in the blood vessels, and there is a greater probability that smaller nanoparticles, compared with larger nanoparticles, exit the tumor.44 The migration rate differs among nanoparticles of different sizes, and this induces differential accumulation amount in tumors. 3101
DOI: 10.1021/acsami.5b10352 ACS Appl. Mater. Interfaces 2016, 8, 3092−3106
Research Article
ACS Applied Materials & Interfaces fluorescence experimental results (Figure 4A−4C), indicating that these data resulted from the accumulation of nanoparticles in the tumor. Among these four types of nanoparticles, the strongest contrast between 0 and 3 h after injection was observed for Fe3O4-310 (Figure 5G), perhaps because of the greatest accumulation of this particular nanoparticle. As the image intensity contrast is a combined effect of efficiency and accumulation ability of the contrast agent, these data enabled these nanoparticle properties to be observed in this study. PAT is a newly developed biomedical imaging modality that operates based on changes in heat created by the light absorption of molecules. These changes induce pressure jumps and, in turn, launch ultrasonic waves that are then received by acoustic detectors to form images.46 An obviously enhanced photoacoustic signal was observed for the suspensions containing different sized Fe3O4 nanoparticles, and Fe3O4-120 induced the strongest signal among the Fe3O4 nanoparticles at the same particle concentration (Figure 5H). With respect to their use as a PAT contrast agent, nanoparticles with resonance absorption in the NIR region are highly desirable because optical absorption by native tissue components is minimal in this range. The optical absorption and the absorption peak position of nanoparticles can be altered by changing the particle shape. Fe3O4 nanoparticles of different sizes possess different PA imaging efficiencies, likely because of the variations in of NIR absorption with size. The UV−vis optical spectrum of the four types of the nanoparticles was similar, and the absorption in the NIR region was nearly identical; therefore, their photoacoustic imaging efficiency was almost equal. The Fe3O4-120 nanoparticle suspension exhibited a higher signal, probably because of its crystal structure. It can be observed in Figure 1B that Fe3O4-120 had the highest crystallinity. A distinctly enhanced photoacoustic signal was also observed in tumors in mice after the injection of Fe3O4-310 (Figure 5I), which was attributed to the intratumoral accumulation of nanoparticles. In addition, much work can be conducted with these different sized nanoparticles. Fe3O4 nanoparticles generate heat in an alternating magnetic field which can be used to treat cancer or some other diseases. Magnetic targeting is also an interesting research topic. We wondering if the nanoparticles have different heat-generating efficiencies or different behaviors in magnetic targeting in vitro and in vivo. These questions are what we concerned about and the next step to carried out.
of nanomedicine for optimized bioapplications because it illustrates how nanoparticles’ size affects their behavior in vitro and in vivo over a wide size range.
5. EXPERIMENTAL SECTION 5.1. Materials. Iron(III) chloride hexahydrate (FeCl3·6H2O), ethylene glycol (EG), trisodium citrate (Na3Cit), and sodium acetate trihydrate (NaAC·3H2O) were from Sinopharm Chemical Reagents Company (Shanghai, China). Polyethylene glycol (Mw = 4000) was from Aladdin Co., Ltd. (Shanghai, China). Indocyanine green (ICG) was from Tokyo Chemical Industry Co., Ltd. (Tokyo, Japan). Hoechst 33258, 6-coumarin, and 3-(4,5-dimethylthiazol-2-yl)-2,5-diphenyltetrazolium bromide (MTT) were from Sigma-Aldrich Inc. (St. Louis, MO, USA). Low-melting-point agarose was from Shanghai Yi Xin Biotechnology Co., Ltd. (Shanghai, China). The annexin V-FITC/PI apoptosis detection kit was from Beyotime Co., Ltd. (Jiangsu, China). The Live/Dead Kit (calcein-AM and EthD-1) was from Invitrogen Co., Ltd. (Carlsbad, CA, USA). RPMI-1640 medium (RPMI), fetal bovine serum (FBS), and penicillin/streptomycin (100 U/mL) were from Ji Nuo Biotechnology Co., Ltd. (Zhejiang, China). All other chemicals were of analytical grade and used without further purification. Deionized water (18.4 MΩ·cm) used in all experiments was prepared using a Milli-Q system (Millipore, Boston, USA) and was used in all experiments. 5.2. Cell Lines and Animals. MCF-7 (human breast cancer), HeLa (human cervical cancer), S180 (mouse osteosarcoma), and L929 (mouse fibroblast) cells were obtained from the Institute of Biochemistry and Cell Biology of the Chinese Academy of Sciences (IBCB, Shanghai, China). HUVEC (human umbilical vein endothelial) cells were a gift from the First Affiliated Hospital, Zhejiang University School of Medicine. The cells were maintained in RPMI1640 medium containing 10% FBS at 37 °C in a humidified atmosphere containing 5% CO2. Male BALB/c nude mice (4−5 weeks, 18 ± 2 g) and ICR mice (4−5 weeks, 18 ± 2 g) were utilized according to the protocol approved by the Institutional Animal Care and Use Committee of Zhejiang University. In vivo experiments were performed in compliance with Zhejiang University Animal Study Committee’s requirements for the care and use of laboratory animals in research. 5.3. Synthesis of Different-Sized Fe3O4 Nanoparticles. The different-sized Fe3O4 nanoparticles were synthesized using a modified solvothermal reaction.47−49 We will use Fe3O4-60 as an example to describe the synthesis process. Briefly, FeCl3·6H2O (0.945 g, 3 mmol), trisodium citrate (0.7 g, 2.4 mmol), and polyethylene glycol (0.5 g) were first dissolved in ethylene glycol (70 mL) to form a clear solution. With the addition of NaAc·3H2O (4.2 g), the mixture was stirred vigorously for 1 h at room temperature and then transferred into a Teflon-lined stainless-steel autoclave (100 mL capacity). Hydrothermal reactions were conducted at 200 °C for 10 h, and the mixtures were then allowed to cool to room temperature. After the hydrothermal reactions, black samples were collected with the help of an external magnetic field and then successively rinsed with alcohol and deionized water three times. The final products were stored in water at 4 °C for further use. We obtained different-sized nanoparticles by adjusting the concentration of raw material and the reaction time. All the parameters involved in the nanoparticle synthesis of the nanoparticles are listed in Table S1. 5.4. Preparation of Fluorescent Nanoparticles. Four types of nanoparticles were labeled with a fluorescent dye (6-coumarin) for further studies. Briefly, 6-coumarin was dissolved in a methanol: chloroform (12.5:87.5 v/v) solution.50 Then, 50 μL of the 6-coumarin solution (1 mg/mL, in deionized water) was added to the nanoparticle dispersion (10 mg/mL). After stirring overnight, 6-coumarin-labeled Fe3O4 nanoparticles were collected and purified with the help of an external magnetic field and then rinsed with PBS three times. The washing cycle was repeated until the supernatant became colorless. The final samples were stored at 0−4 °C for further use. Similarly, to obtain indocyanine green (ICG)-labeled Fe3O4 nanoparticles, 50 μL of
4. CONCLUSIONS In this study, we have synthesized a series of monodisperse Fe3O4 nanoparticles with identical surface properties over a wide size range (60−310 nm), and systematically investigated their biobehaviors and applications. Our data indicated that smaller Fe3O4 nanoparticles showed greater cellular internalization and deeper penetration into multicellular spheroids, which induced a higher photothermal ablation efficacy in killing tumor cells in combination with NIR laser irradiation in vitro. Interestingly, larger Fe3O4 nanoparticles showed greater accumulation in tumors and induced more efficient tumor growth inhibition due to the stronger photothermal ablation effect under NIR laser irradiation. We also demonstrated that all types of Fe3O4 nanoparticles with a diameter ranging from 60 to 310 nm could be used as the efficient contrast agents for MRI and PAT; 120 nm may be the optimal diameter. However, more efficient in vivo imaging utilizing Fe3O4 nanoparticles should mainly depend on greater accumulation of the nanoparticles. This work is significant for the design and development 3102
DOI: 10.1021/acsami.5b10352 ACS Appl. Mater. Interfaces 2016, 8, 3092−3106
Research Article
ACS Applied Materials & Interfaces
acetone solutions (once in 90% at 4 °C and three times in 100% at room temperature; 15−20 min for each solution). Afterward, the cells were treated with a 2:1 solution of acetone: epoxide resin for 3 h and treated with a 2:1 mixture of acetone: epoxide resin overnight. The cells were then embedded in pure epoxide resin, which was polymerized at 37 °C (overnight), 45 °C (12 h), and 60 °C (48 h). Ultrathin sections of the embedded specimens were cut with an ultramicrotome (Leica EM UC6, Germany) using a diamond knife. The thin sections were placed onto Formvar/carbon-coated copper grids and stained with 3% uranyl acetate and lead citrate. The sections were then examined by TEM (JEOL-1230, JEOL, Japan) at an accelerating voltage of 80 kV. 5.8. Photothermal Effect Measurements in Vitro. A powertunable 808 nm semiconductor laser (Diomed 15 plus, Cambridge, U.K.) was utilized in the experiments. The photothermal effect of different sized Fe3O4 nanoparticles induced by NIR laser irradiation was evaluated by exposing the nanoparticle suspensions (0.5 mL, 300 μg/mL) to radiation emitted by an 808 nm laser at a power density of 1.5 W/cm2. The temperature of the suspension was monitored at 30 s intervals using a thermocouple immersed in the solution for a total of 10 min. Furthermore, to investigate the relationship between the photothermal effect and particle concentration, Fe3O4 nanoparticle suspensions with concentrations of 30, 75, 150, and 300 μg/mL were irradiated with NIR light (1.5 W/cm2), and the temperature of the suspensions was monitored. To assess photothermal ablation in vitro, MCF-7 and HeLa cells seeded in a 96-well plate were treated with different sized Fe3O4 nanoparticles (50 μg/mL). After 24 h of incubation, the medium was replaced with fresh cell culture medium, and the cells were irradiated by a NIR laser (1.5 W/cm2 for 3 min). After another 24 h of incubation, the cells were stained with calcein AM (Invitrogen, Carlsbad, CA, USA) to visualize live cells and with EthD-1 (Invitrogen, Carlsbad, CA, USA) to visualize dead cells. Cellular fluorescence was examined under a fluorescence microscope (Leica DM4000 Bm, Leica, Solms, Germany). Cell viability of cells was further tested using an MTT assays at the same time. 5.9. Uptake of Fe3O4 Nanoparticles by Multicellular Spheroids. MCF-7 multicellular spheroids were produced by the liquid overlay method as previously described.54 Briefly, cells were detached from monolayers, and single cell suspensions (1.5 mL per well containing 5 × 10³ cells) were transferred into flat-bottomed 24-well plates precoated with 4% agarose. Cells were incubated for approximately 7 days, as described above for monolayer cells, except that the culture medium was partially (0.75 mL) replaced with fresh medium every other day. The uptake of different sized Fe3O4 nanoparticles by the spheroids was determined by CLSM.55 MCF-7 spheroids with diameters of approximately 350−400 μm were harvested after approximately 7 days of growth and incubated with 6-coumarin-labeled Fe3O4 nanoparticles (50 μg/mL) for 24 h. The medium was then removed, and the spheroids were washed with ice-cold PBS before being observed by CLSM. Images of the spheroids were collected using an Olympus inverted microscope equipped with a tunable Mai Tai Deep See multiphoton laser (Spectra-Physics, 80 MHz, 120 fs pulse) and a 10× water immersion objective. 5.10. Photothermal Ablation against Multicellular Spheroids. The photothermal ablation effect of different sized Fe3O4 nanoparticles on multicellular spheroids was evaluated using a growth inhibition assay.56 Spheroids with diameters of 350−400 μm were divided into five groups (n = 3 per group). The selected spheroids were treated with fresh medium containing different sized Fe3O4 nanoparticles (50 μg/mL). The spheroids were incubated with the nanoparticles for 24 h; then, the medium was replenished and NIR laser irradiation (1.5 W/cm2 for 3 min) was performed. The spheroids were allowed to continue to incubate at 37 °C for 9 days. As an indication of multicellular spheroid proliferation, the diameter of the spheroids was measured every day using an optical microscope. Then, the spheroids in each group were combined, digested with trypsin, and collected by centrifugation. The extent of apoptosis and necrosis in the
the ICG solution (2 mg/mL, in deionized water) was added to the nanoparticle dispersion (10 mg/mL). 5.5. Characterization of Different-Sized Fe3O4 Nanoparticles. The morphology and structure of the prepared Fe3O4 nanoparticles were characterized by TEM at an accelerating voltage of 80 kV (JEM1230, JEOL, Japan). TEM samples were prepared by dipping a copper grid into each nanoparticle solution (1 mg/mL), blotting the extra solution with filter paper, and drying the grid slowly in air. The size distribution and zeta potential of the particles were measured using a dynamic light scattering instrument (DLS, Malvern Nano-ZS 90, Malvern, UK) at room temperature with the particles suspended in Milli-Q water. The spectroscopic properties of the different nanoparticles were characterized using a UV−vis spectrophotometer (PuXi General Instrument Co., Ltd., China) with a deuterium lamp source. Powder X-ray diffraction (XRD) patterns were recorded on an X’Pert Pro (PANalytical, The Netherlands) diffraction meter with Cu Kα radiation with a wavelength of λ = 0.154 nm operating at 40 kV and 40 mA. 5.6. Cytotoxicity. The cytotoxicity of different sized Fe3O4 nanoparticles was evaluated by an MTT assays according to the manufacturer’s suggested procedures.51 Briefly, MCF-7, HeLa, HUVEC, or L929 cells were seeded into 96-well plates in 100 μL of growth medium at a density of 5 × 10³ cells/well, and incubated overnight. Then, the cells were treated with Fe3O4-60, Fe3O4-120, Fe3O4-200, or Fe3O4-310 nanoparticles at various concentrations (0−2000 μg/mL). After 24 and 48 h, cell viability was assessed using the MTT method. The data are expressed as the percentage of surviving cells and are reported as the mean values of six measurements. 5.7. Uptake of Fe3O4 Nanoparticles by Monolayer Cells. For time-dependent cell uptake studies, MCF-7 and HeLa cells were suspended in medium in six-well plates at a concentration of 2 × 10⁵ cells/well and allowed to grow overnight. Then, the cells were treated with different sized nanoparticle suspensions (50 μg/mL 6-coumarin-labeled Fe3O4 nanoparticles) for different periods. The cells were subsequently washed twice with PBS, detached with trypsinEDTA and resuspended in an appropriate volume of PBS for flow cytometry analysis (FC500 MCL, Beckman Coulter, Miami, FL, USA), and a minimum of 1 × 10⁴ cells were analyzed for each sample. For confocal laser scanning microscopy (CLSM) experiments, MCF-7, and HeLa cells were first seeded in six-well plates on 22 × 22 mm microscope slides and incubated with different sized nanoparticle suspensions (containing 50 μg/mL 6-coumarin-labeled Fe3O4 nanoparticles) for different periods. Then, the culture medium was removed, and the cells on the microscope slides were washed twice with PBS, fixed with 4% paraformaldehyde (30 min) and stained with Hoechst 33258 (10 μg/mL, 20 min). Cell fluorescence was observed by confocal microscopy (ZEISS, 710, LSM, Germany). A laser with a wavelength of 405 nm was used to excite Hoechst 33258 fluorescence, and 6-coumarin was excited with a laser at 466 nm. Furthermore, quantitative analysis of intracellular Fe was used to further investigate the cellular uptake of different sized Fe3O4 nanoparticles.52 MCF-7 and HeLa cells were seeded on six-well plates and incubated with the nanoparticles for 24 h. Then, the cells were gently washed three times with cold PBS and collected by trypsin digestion. The cells were freeze-dried and suspended in 500 μL of aqua regia. After 3 days of incubation at room temperature, the samples were centrifuged, and the supernatant was collected. The concentration of Fe in the supernatant was measured using ICP-MS (Elan DRC II PerkinElmer, Waltham, MA, USA). Finally, the cellular uptake of different sized Fe3O4 nanoparticles was analyzed by TEM.53 Briefly, MCF-7 cells were incubated with the nanoparticles for 24 h and then collected by trypsin digestion. The cells were precipitated by centrifugation and fixed at 4 °C overnight by the addition of 2.5% (w/v) glutaraldehyde. The glutaraldehyde was then removed and replaced with 0.1 M PBS (pH 7.4), followed by postfixation with 1% OSO4 solution at 4 °C for 2 h and three washes with PBS buffer (15 min per wash). The cells were dehydrated at 4 °C in a series of ethanol solutions (30%, 50%, 60%, 70%, 80%, 90%, and 95%) and a 1:1 mixture of ethanol (90%): acetone (90%) (15−20 min for each solution). The cells were continually dehydrated in a series of 3103
DOI: 10.1021/acsami.5b10352 ACS Appl. Mater. Interfaces 2016, 8, 3092−3106
Research Article
ACS Applied Materials & Interfaces spheroids was measured by flow cytometry according to the instructions of an Annexin V-FITC/PI apoptosis kit. 5.11. Retention of the Fe3O4 Nanoparticles in Tumors. All animal experiments were conducted in accordance with the National Institutes of Health Guide for the Care and Use of Laboratory Animals with the approval of the Scientific Investigation Board of Zhejiang University. The S180 tumor model was generated by subcutaneous injection of 5 × 10⁶ cells in 30−40 μL of PBS into the right rear flanks of male nude mice (age 4−5 weeks). Tumors with volume of 200− 300 mm3 were used for the experiment. For in vivo real-time optical imaging, tumor-bearing nude mice were injected intravenously with 200 μL of ICG-labeled Fe3O4 nanoparticles of different sizes (5 mg/mL). The real-time biodistribution of the nanoparticles in the mice was investigated using a Maestro imaging system (CRI, Inc., Woburn, MA, USA). To avoid the fluorescence signal overlap of normal organs (such as liver and spleen), a nude mouse with tumor on the hind leg was injected the same dose of Fe3O4-200 nanoparticles and observed in the imaging system. For quantitative assays, the tumor-bearing ICR mice were randomly divided into four groups (n = 3). The mice were injected intravenously with 200 μL of ICG-labeled Fe3O4-60, Fe3O4-120, Fe3O4-200 or Fe3O4-310 nanoparticles (5 mg/mL). At 2, 4, 8, 12, 24, and 48 h postinjection, the mice were sacrificed. The tissues (heart, liver, spleen, lung, kidney, and tumor) were collected, and fluorescence images were obtained. For ICP-MS, tumors (2, 24, and 48 h after injection) from each group were weighed and then freeze-dried. The samples were digested with 8 mL of aqua regia in 20 mL glass vials at boiling temperature. The solution was evaporated, and the precipitate was suspended in an aqueous solution containing 1.5% HCl and 0.5% HNO3. The suspension was centrifuged at 3000 rpm for 5 min to remove any undigested debris. The Fe content was analyzed using ICP-MS as described above. Furthermore, tumors (24 h after injection) from each group were fixed in formalin and cut into 5 μm slices for TEM imaging. To investigate the intratumoral distribution of different sized Fe3O4 nanoparticles, 20 μm frozen slices of tumors (24 h after injection) from each group were also prepared.57 Neovascular cells in tumor slices were stained with a Cy5-labeled CD-31 antibody (1:100). The nuclei were stained with Hoechst 33258 (1.0 μg/mL). After three washes with PBS, the sections were mounted in fluorescent mounting medium and examined under a confocal microscope (ZEISS, 710, LSM, Germany). 5.12. MRI for Fe3O4 Nanoparticles. The room temperature magnetic properties were measured on a vibrating sample magnetometer (a Physical Property Measurement System from Quantum Design, MPMS-XL-5, CA, USA) with a maximum applied field of 1.8 T. Data for in vitro T1 and R1 measurements were acquired with a multiple flip angle 3D SPGR sequence. The scanning parameters were as follows: repetition time (TR) = 6.9 ms, echo time (TE) = 2.6 ms, field of view (FOV) = 18 cm, image matrix = 256 × 256, readout bandwidth (RBW) = ±50 kHz, slice thickness = 3 mm, and slice number = 8. Nine flip-angles were applied from 3° to 19° with a 2° increment. The DESPOT1 method was used for T1 map calculation,58 and the R1 map was then calculated by R1 = 1/T1. A 2D multiecho SE sequence was used for T2 measurements: TR = 2000 ms, TE1 = 12 ms, ΔTE = 12 ms, echo number =8, FOV = 18 cm, image matrix = 256 × 256, RBW = ±15.63 kHz, slice thickness = 3 mm, and slice number = 5. T2 maps were obtained through linear fitting to the logarithm transformed T2 decay, and the R2 maps were calculated as R2 = 1/T2. R1 and R2 values for each type of sample were obtained by averaging an 8 × 8 ROI in the corresponding region on R1 and R2 maps. R1 and R2 values versus Fe concentrations were fitted by a linear model: Y = aX + b, where Y stands for R1 or R2 values, X stands for Fe concentrations, and a and b are fitting parameters. The computed slopes (i.e., fitting parameter a in the linear fitting model) were defined as the relaxivity values (r1 and r2). For in vitro cell uptake measurements using MRI, cells were seeded into six-well plates and incubated with Fe3O4-60, Fe3O4-120, Fe3O4200, or Fe3O4-310 nanoparticles for 1, 24, and 48 h, as mentioned
above. After incubation, the cells were washed twice with PBS and detached with trypsin-EDTA solution; they were then collected by centrifugation. The cells were then transferred to small plastic tubes with a final volume of 2 mL per tube. These tubes were embedded in 1% agarose gel and imaged with a clinical MR scanner. For in vivo MRI, nude mice bearing S180 tumors were injected with Fe3O4-60, Fe3O4-120, Fe3O4-200, or Fe3O4-310 nanoparticles (200 μL, 5 mg/mL). Then, the mice were imaged with a clinical MR scanner at a predetermined time after injection. A T2-weighted SE PROPELLER sequence was used for this in vivo scan with the following parameters: TR = 3000 ms, TE = 79 ms, image matrix = 256 × 256, FOV = 6 cm, slice thickness = 1 mm, slice gap = 0.5 mm, slice number = 11, and RBW = ±41.67 kHz. Three samples were averaged to improve the SNR. The tumor ROI was drawn manually on each T2-weighted image for further analysis of the temporal change in the image signal. 5.13. Photoacoustic Tomography for Fe3O4 Nanoparticles. To investigate the ability of different sized Fe3O4 nanoparticles’ ability to serve as photoacoustic imaging agents, four types of nanoparticle suspensions (Fe3O4-60, Fe3O4-120, Fe3O4-200, and Fe3O4-310) with the same Fe concentration (1 mg/mL) were scanned on a photoacoustic imaging system (MSOT, iTheraMedical, Munich, Germany). Pure water was used as a control. Furthermore, nude mice bearing S180 tumors were injected with Fe3O4-310 nanoparticles (200 μL, 5 mg/mL). At 24 h after the injection, the mice were scanned using a photoacoustic imaging system. Mice injected with saline were used as controls. 5.14. Photothermal Conversion in Vivo. Nude mice bearing S180 tumors were injected with 200 μL of Fe3O4-60, Fe3O4-120, Fe3O4-200, or Fe3O4-310 nanoparticles (5 mg/mL) or the same volume of saline. After 24 h, the tumors were exposed to continuous radiation emitted from an 808 nm laser at a power density of 1.5 W/cm2 for 3 min. The laser beam was adjusted to cover the entire region of the tumor. The temperature in the tumors during NIR irradiation was measured using an infrared thermal imaging camera (FLIR ThermaCAM S65, USA). The resulting thermographs were analyzed using IR Flash software (Infrared Camera Inc., version 2.10) to obtain the average tumor temperature at each time point. The mice were sacrificed immediately after the temperature measurement, and tumors were collected, fixed, and stained with hematoxylin and eosin (H&E) for histological analysis to investigate the instantaneous efficacy of photothermal ablation in tumors. 5.15. In Vivo Tumor Inhibition Study. ICR mice bearing S180 tumors were divided into five groups (n = 6 per group) and treated with saline (control group) or with Fe3O4-60, Fe3O4-120, Fe3O4-200, or Fe3O4-310 particles (200 μL, 5 mg/mL). Each animal was intravenously injected via the tail vein on days 0, 3, and 6. The mice were irradiated with an NIR laser (1.5 W/cm2, 3 min) on the second day after each injection. Tumor size was measured based on the width and length using a caliper. Tumor size and animal body weight were measured every 3 days during the experiment, and the tumor volume was calculated using the formula ((length × width2)/2). Tumor growth inhibition (TGI) (%) was calculated using the following formula: (1 − average tumor volume of treated group/average tumor volume of control group) × 100%. The mice were sacrificed on day 30 after the first injection, and the tumors and other organs were collected. The fresh tumor tissues were fixed in 4% paraformaldehyde, embedded in paraffin, cut into 5 μm slides, and stained for Ki67 and terminal deoxynucleotidyl transferasemediated deoxyuridine triphosphate nick end labeling (TUNEL) to determine the proliferation index and apoptosis index. Cells positive for Ki67 or TUNEL were detected in randomly selected fields. Both the Ki67 proliferation index and TUNEL apoptosis index were calculated by counting the number of brown (positive) cells among 1000 cells in a field of 10 slices and were presented as the average ratio. Other organs were fixed, stained with H&E and examined under a light microscope. 5.16. Statistical Analysis. Statistical analysis was conducted using Student’s t test for pairs of groups and one-way analysis of variance (ANOVA) for multiple groups. P-values less than 0.05 were considered statistically significant. All the statistical analyses were conducted using Origin 8 software. 3104
DOI: 10.1021/acsami.5b10352 ACS Appl. Mater. Interfaces 2016, 8, 3092−3106
Research Article
ACS Applied Materials & Interfaces
■
(9) Jain, R. K.; Stylianopoulos, T. Delivering Nanomedicine to Solid Tumors. Nat. Rev. Clin. Oncol. 2010, 7, 653−664. (10) Zhang, S.-L.; Li, J.; Lykotrafitis, G.; Bao, G.; Suresh, S. SizeDependent Endocytosis of Nanoparticles. Adv. Mater. 2009, 21, 419− 424. (11) Davis, M. E.; Chen, Z.; Shin, D. M. Nanoparticle Therapeutics: An Emerging Treatment Modality for Cancer. Nat. Rev. Drug Discovery 2008, 7, 771−782. (12) Lu, F.; Wu, S.-H.; Hung, Y.; Mou, C.-Y. Size Effect on Cell Uptake in Well-Suspended, Uniform Mesoporous Silica Nanoparticles. Small 2009, 5, 1408−1413. (13) Cabral, H.; Matsumoto, Y.; Mizuno, K.; Chen, Q.; Murakami, M.; Kimura, M.; Terada, Y.; Kano, M. R.; Miyazono, K.; Uesaka, M.; Nishiyama, N.; Kataoka, K. Accumulation of Sub-100 nm Polymeric Micelles in Poorly Permeable Tumours Depends on Size. Nat. Nanotechnol. 2011, 6, 815−823. (14) Huang, K.-Y.; Ma, H.-L.; Liu, J.; Huo, S.-D.; Kumar, A.; Wei, T.; Zhang, X.; Jin, S.-B.; Gan, Y.-L.; Wang, P. C.; He, S.-T.; Zhang, X.-N.; Liang, X.-J. Size-Dependent Localization and Penetration of Ultrasmall Gold Nanoparticles in Cancer Cells, Multicellular Spheroids, and Tumors in Vivo. ACS Nano 2012, 6, 4483−4493. (15) Gradishar, W. J.; Tjulandin, S.; Davidson, N.; Shaw, H.; Desai, N.; Bhar, P.; Hawkins, M.; O’Shaughnessy, J. Phase III Trial of Nanoparticle Albumin-Bound Paclitaxel Compared with Polyethylated Castor Oil-Based Paclitaxel in Women with Breast Cancer. J. Clin. Oncol. 2005, 23, 7794−7803. (16) Torchilin, V. P. Recent Advances with Liposomes as Pharmaceutical Carriers. Nat. Rev. Drug Discovery 2005, 4, 145−160. (17) Fan, Y.-B.; Li, F.-Y.; Chen, D.-Y. Scavenger Receptor-recognized and Enzyme-responsive Nanoprobe for Fluorescent Labeling of Lysosomes in Live Cells. Biomaterials 2014, 35, 7870−7880. (18) Gao, J.-H.; Gu, H.-W; Xu, B. Multifunctional Magnetic Nanoparticles: Design, Synthesis, and Biomedical Applications. Acc. Chem. Res. 2009, 42, 1097−1107. (19) Laurent, S.; Forge, D.; Port, M.; Roch, A.; Robic, C.; Elst, L. V.; Muller, R. N. Magnetic Iron Oxide Nanoparticles: Synthesis, Stabilization, Vectorization, Physicochemical Characterizations, and Biological Applications. Chem. Rev. 2008, 108, 2064−2110. (20) Lee, J.-H.; Jang, J.-t.; Choi, J.-s.; Moon, S. H.; Noh, S.-h.; Kim, J.w.; Kim, J.-G.; Kim, I.-S.; Park, K. I.; Cheon, J. Exchange-Coupled Magnetic Nanoparticles for Efficient Heat Induction. Nat. Nanotechnol. 2011, 6, 418−422. (21) Lui, C. N. P.; Tsui, Y. P.; Ho, A. S. L.; Shum, D. K. Y.; Chan, Y. S.; Wu, C. T.; Li, H. W.; Tsang, S. C. E.; Yung, K. K. L. Neural Stem Cells Harvested from Live Brains by Antibody-Conjugated Magnetic Nanoparticles. Angew. Chem., Int. Ed. 2013, 52, 12298−12302. (22) Yoo, D.; Jeong, H.; Noh, S.-H.; Lee, J.-H.; Cheon, J. Magnetically Triggered Dual Functional Nanoparticles for Resistance-Free Apoptotic Hyperthermia. Angew. Chem., Int. Ed. 2013, 52, 13047−13051. (23) Jun, Y. W.; Huh, Y. M.; Choi, J. S.; Lee, J. H.; Song, H. T.; Kim, S.; Yoon, S.; Kim, K. S.; Shin, J. S.; Suh, J. S.; Cheon, J. Nanoscale Size Effect of Magnetic Nanocrystals and Their Utilization for Cancer Diagnosis via Magnetic Resonance Imaging. J. Am. Chem. Soc. 2005, 127, 5732−5733. (24) Zeng, J.-F.; Jing, L.-H.; Hou, Y.; Jiao, M.-X.; Qiao, R.-R.; Jia, Q.J.; Liu, C.-Y.; Fang, F.; Lei, H.; Gao, M.-Y. Anchoring Group Effects of Surface Ligands on Magnetic Properties of Fe3O4 Nanoparticles: Towards High Performance MRI Contrast Agents. Adv. Mater. 2014, 26, 2694−2698. (25) Yuan, F.; Dellian, M.; Fukumura, D.; Leunig, M.; Berk, D. A.; Torchilin, V. P.; Jain, R. K. Vascular-Permeability in a Human Tumor Xenograft-Molecular Size Dependence and Cutoff Size. Cancer Res. 1995, 55 (17), 3752−3756. (26) Doane, T. L.; Burda, C. The Unique Role of Nanoparticles in Nanomedicine: Imaging, Drug Delivery and Therapy. Chem. Soc. Rev. 2012, 41, 2885−2911.
ASSOCIATED CONTENT
S Supporting Information *
The Supporting Information is available free of charge on the ACS Publications website at DOI: 10.1021/acsami.5b10352. Nanoparticle characterization data (XRD, UV−vis spectrum), cell viability, cellular uptake of the nanoparticles at various time points tested by flow cytometry, photothermal therapy of different-sized nanoparticle in vitro and in vivo, MRI images of nanoparticle suspensions, and some data indicating the safety of long-term therapy of different-sized nanoparticles (PDF)
■
AUTHOR INFORMATION
Corresponding Authors
*E-mail:
[email protected]. *E-mail:
[email protected]. Notes
The authors declare no competing financial interest.
■
ACKNOWLEDGMENTS This work was supported by the National Nature Science Foundation of China (81373348 and 81573365). The work was partially supported by the National Key Basic Research Program of China (2013CB329501) and the National Nature Science Foundation of China (81371518).
■
REFERENCES
(1) Hou, Z.-Y.; Zhang, Y.-X; Deng, K.-R.; Chen, Y.-Y.; Li, X.-J.; Deng, X.-R.; Cheng, Z.-Y.; Lian, H.-Z.; Li, C.-X.; Lin, J. UV-Emitting Upconversion-Based TiO2 Photosensitizing Nanoplatform: NearInfrared Light Mediated in Vivo Photodynamic Therapy via Mitochondria-Involved Apoptosis Pathway. ACS Nano 2015, 9, 2584−2599. (2) Chen, F.; Hong, H.; Goel, S.; Graves, S. A.; Orbay, H.; Ehlerding, E. B.; Shi, S.-X.; Theuer, C. P.; Nickles, R. J.; Cai, W.-B. In Vivo Tumor Vasculature Targeting of CuS@MSN Based Theranostic Nanomedicine. ACS Nano 2015, 9, 3926−3934. (3) Wang, Y.-H.; Song, S.-Y.; Liu, J.-H.; Liu, D.-P.; Zhang, H.-J. ZnOFunctionalized Upconverting Nanotheranostic Agent: Multi-Modality Imaging-Guided Chemotherapy with On-Demand Drug Release Triggered by pH. Angew. Chem., Int. Ed. 2015, 54, 536−540. (4) Lucky, S. S.; Idris, N. M.; Li, Z.-Q.; Huang, K.; Soo, K. C.; Zhang, Y. Titania Coated Upconversion Nanoparticles for Near-Infrared Light Triggered Photodynamic Therapy. ACS Nano 2015, 9, 191−205. (5) Guo, W.-S.; Sun, X.-L.; Jacobson, O.; Yan, X.-F.; Min, K.; Srivatsan, A.; Niu, G.; Kiesewetter, D. O.; Chang, J.; Chen, X.-Y. Intrinsically Radioactive [Cu-64] CuInS/ZnS Quantum Dots for PET and Optical Imaging: Improved Radiochemical Stability and Controllable Cerenkov Luminescence. ACS Nano 2015, 9, 488−495. (6) Li, W.-P.; Liao, P.-Y.; Su, C.-H.; Yeh, C.-S. Formation of Oligonucleotide-Gated Silica Shell-Coated Fe3O4-Au Core-Shell Nanotrisoctahedra for Magnetically Targeted and Near-Infrared Light-Responsive Theranostic Platform. J. Am. Chem. Soc. 2014, 136, 10062−10075. (7) Sun, X.-L.; Huang, X.-L.; Yan, X.-F.; Wang, Y.; Guo, J.-X.; Jacobson, O.; Liu, D.-B.; Szajek, L. P.; Zhu, W.-L.; Niu, G.; Kiesewetter, D. O.; Sun, S.-H.; Chen, X.-Y. Chelator-Free Cu-64Integrated Gold Nanomaterials for Positron Emission Tomography Imaging Guided Photothermal Cancer Therapy. ACS Nano 2014, 8, 8438−8446. (8) Bertrand, N.; Wu, J.; Xu, X.-Y.; Kamaly, N.; Farokhzad, O. C. Cancer Nanotechnology: The Impact of Passive and Active Targeting in the Era of Modern Cancer Biology. Adv. Drug Delivery Rev. 2014, 66, 2−25. 3105
DOI: 10.1021/acsami.5b10352 ACS Appl. Mater. Interfaces 2016, 8, 3092−3106
Research Article
ACS Applied Materials & Interfaces (27) Friedrich, J.; Seidel, C.; Ebner, R.; Kunz-Schughart, L. A. Spheroid-based Drug Screen: Considerations and Practical Approach. Nat. Protoc. 2009, 4, 309−324. (28) Jang, J.-t.; Nah, H.; Lee, J.-H.; Moon, S. H.; Kim, M. G.; Cheon, J. Critical Enhancements of MRI Contrast and Hyperthermic Effects by Dopant-Controlled Magnetic Nanoparticles. Angew. Chem., Int. Ed. 2009, 48, 1234−1238. (29) Li, S.-C.; Zhang, T.-L.; Tang, R.-Z.; Qiu, H.; Wang, C.-Q.; Zhou, Z.-N. Solvothermal Synthesis and Characterization of Monodisperse Superparamagnetic Iron Oxide Nanoparticles. J. Magn. Magn. Mater. 2015, 379, 226−231. (30) Tan, H.; Xue, J.-M.; Shuter, B.; Li, X.; Wang, J. Synthesis of PEOlated Fe3O4@SiO2 Nanoparticles via Bioinspired Silification for Magnetic Resonance Imaging. Adv. Funct. Mater. 2010, 20, 722−731. (31) Srivastava, S.; Awasthi, R.; Tripathi, D.; Rai, M. K.; Agarwal, V.; Agrawal, V.; Gajbhiye, N. S.; Gupta, R. K. Magnetic-NanoparticleDoped Carbogenic Nanocomposite: An Effective Magnetic Resonance/Fluorescence Multimodal Imaging Probe. Small 2012, 8, 1099− 1109. (32) Arap, W.; Haedicke, W.; Bernasconi, M.; Kain, R.; Rajotte, D.; Krajewski, S.; Ellerby, H. M.; Bredesen, D. E.; Pasqualini, R.; Ruoslahti, E. Targeting the Prostate for Destruction through a Vascular Address. Proc. Natl. Acad. Sci. U. S. A. 2002, 99, 1527−1531. (33) Gratton, S. E. A.; Ropp, P. A.; Pohlhaus, P. D.; Luft, J. C.; Madden, V. J.; Napier, M. E.; DeSimone, J. M. The Effect of Particle Design on Cellular Internalization Pathways. Proc. Natl. Acad. Sci. U. S. A. 2008, 105, 11613−11618. (34) Jiang, W.; Kim, B. Y. S.; Rutka, J. T.; Chan, W. C. W. Nanoparticle-mediated Cellular Response is Size-dependent. Nat. Nanotechnol. 2008, 3, 145−150. (35) Ernsting, M. J.; Murakami, M.; Roy, A.; Li, S.-D. Factors Controlling the Pharmacokinetics, Biodistribution and Intratumoral Penetration of Nanoparticles. J. Controlled Release 2013, 172, 782− 794. (36) Li, S.-D.; Huang, L. Pharmacokinetics and Biodistribution of Nanoparticles. Mol. Pharmaceutics 2008, 5, 496−504. (37) He, C.-B.; Hu, Y.-P.; Yin, L.-C.; Tang, C.; Yin, C.-H. Effects of Particle Size and Surface Charge on Cellular Uptake and Biodistribution of Polymeric Nanoparticles. Biomaterials 2010, 31, 3657−3666. (38) Kim, B.; Han, G.; Toley, B. J.; Kim, C.-k.; Rotello, V. M.; Forbes, N. S. Tuning Payload Delivery in Tumour Cylindroids Using Gold Nanoparticles. Nat. Nanotechnol. 2010, 5, 465−472. (39) Wong, C.; Stylianopoulos, T.; Cui, J.; Martin, J.; Chauhan, V. P.; Jiang, W.; Popovic, Z.; Jain, R. K.; Bawendi, M. G.; Fukumura, D. Multistage Nanoparticle Delivery System for Deep Penetration into Tumor Tissue. Proc. Natl. Acad. Sci. U. S. A. 2011, 108, 2426−2431. (40) Bardhan, R.; Lal, S.; Joshi, A.; Halas, N. J. Theranostic Nanoshells: From Probe Design to Imaging and Treatment of Cancer. Acc. Chem. Res. 2011, 44, 936−946. (41) Yu, T.; Malugin, A.; Ghandehari, H. Impact of Silica Nanoparticle Design on Cellular Toxicity and Hemolytic Activity. ACS Nano 2011, 5, 5717−5728. (42) Chithrani, B. D.; Ghazani, A. A.; Chan, W. C. W. Determining the Size and Shape Dependence of Gold Nanoparticle Uptake into Mammalian Cells. Nano Lett. 2006, 6, 662−668. (43) Osaki, F.; Kanamori, T.; Sando, S.; Sera, T.; Aoyama, Y. A Quantum Dot Conjugated Sugar Ball and Its Cellular Uptake on the Size Effects of Endocytosis in the Subviral Region. J. Am. Chem. Soc. 2004, 126, 6520−6521. (44) Albanese, A.; Tang, P. S.; Chan, W. C. W. The Effect of Nanoparticle Size, Shape, and Surface Chemistry on Biological Systems. Annu. Rev. Biomed. Eng. 2012, 14, 1−16. (45) Lee, S. Y.; Jeon, S. I.; Jung, S.; Chung, I. J.; Ahn, C.-H. Targeted Multimodal Imaging Modalities. Adv. Drug Delivery Rev. 2014, 76, 60−78. (46) Wang, L. V.; Hu, S. Photoacoustic Tomography: In Vivo Imaging from Organelles to Organs. Science 2012, 335, 1458−1462.
(47) Deng, H.; Li, X.-L.; Peng, Q.; Wang, X.; Chen, J.-P.; Li, Y.-D. Monodisperse Magnetic Single-Crystal Ferrite Microspheres. Angew. Chem., Int. Ed. 2005, 44, 2782−2785. (48) Ma, W.-F.; Zhang, Y.; Li, L.-L.; You, L.-J.; Zhang, P.; Zhang, Y.T.; Li, J.-M.; Yu, M.; Guo, J.; Lu, H.-J.; Wang, C.-C. Tailor-Made Magnetic Fe3O4@mTiO2 Microspheres with a Tunable Mesoporous Anatase Shell for Highly Selective and Effective Enrichment of Phosphopeptides. ACS Nano 2012, 6, 3179−3188. (49) Liu, J.; Sun, Z.-K.; Deng, Y.-H.; Zou, Y.; Li, C.-Y.; Guo, X.-H.; Xiong, L.-Q.; Gao, Y.; Li, F.-Y.; Zhao, D.-Y. Highly Water-Dispersible Biocompatible Magnetite Particles with Low Cytotoxicity Stabilized by Citrate Groups. Angew. Chem., Int. Ed. 2009, 48, 5875−5879. (50) Gao, H.-L.; Yang, Z.; Zhang, S.; Cao, S.-J.; Pang, Z.-Q.; Yang, X.; Jiang, X.-G. Glioma-homing Peptide with a Cell-penetrating Effect for Targeting Delivery with Enhanced Glioma Localization, Penetration and Suppression of Glioma Growth. J. Controlled Release 2013, 172, 921−928. (51) You, J.; Wang, Z.-H.; Du, Y.-Z.; Yuan, H.; Zhang, P.-Z.; Zhou, J.L.; Liu, F.; Li, C.; Hu, F.-Q. Specific Tumor Delivery of Paclitaxel Using Glycolipid-like Polymer Micelles Containing Gold Nanospheres. Biomaterials 2013, 34, 4510−4519. (52) Piao, J.-G.; Wang, L.-M.; Gao, F.; You, Y.-Z.; Xiong, Y.-J.; Yang, L.-H. Erythrocyte Membrane Is an Alternative Coating to Polyethylene Glycol for Prolonging the Circulation Lifetime of Gold Nanocages for Photothermal Therapy. ACS Nano 2014, 8, 10414− 10425. (53) Ma, X.-W.; Wu, Y.-Y.; Jin, S.-B.; Tian, Y.; Zhang, X.-N.; Zhao, Y.-L.; Yu, L.; Liang, X.-J. Gold Nanoparticles Induce Autophagosome Accumulation through Size-Dependent Nanoparticle Uptake and Lysosome Impairment. ACS Nano 2011, 5, 8629−8639. (54) Goodman, T. T.; Ng, C. P.; Pun, S. H. 3-D Tissue Culture Systems for the Evaluation and Optimization of Nanoparticle-Based Drug Carriers. Bioconjugate Chem. 2008, 19, 1951−1959. (55) Basuki, J. S.; Duong, H. T. T.; Macmillan, A.; Erlich, R. B.; Esser, L.; Akerfeldt, M. C.; Whan, R. M.; Kavallaris, M.; Boyer, C.; Davis, T. P. Using Fluorescence Lifetime Imaging Microscopy to Monitor Theranostic Nanoparticle Uptake and Intracellular Doxorubicin Release. ACS Nano 2013, 7, 10175−10189. (56) Wang, X.; Zhen, X.; Wang, J.; Zhang, J.-L.; Wu, W.; Jiang, X.-Q. Doxorubicin Delivery to 3D Multicellular Spheroids and Tumors Based on Boronic Acid-rich Chitosan Nanoparticles. Biomaterials 2013, 34, 4667−4679. (57) Zhang, B.; Shen, S.; Liao, Z.-W.; Shi, W.; Wang, Y.; Zhao, J.-J.; Hu, Y.; Yang, J.-R.; Chen, J.; Mei, H.; Hu, Y.; Pang, Z.-Q.; Jiang, X.-G. Targeting Fibronectins of Glioma Extracellular Matrix by CLT1 Peptide-conjugated Nanoparticles. Biomaterials 2014, 35, 4088−4098. (58) Deoni, S. C. L.; Rutt, B. K.; Peters, T. M. Rapid Combined T-1 and T-2 Mapping Using Gradient Recalled Acquisition in the Steady State. Magn. Reson. Med. 2003, 49, 515−526.
3106
DOI: 10.1021/acsami.5b10352 ACS Appl. Mater. Interfaces 2016, 8, 3092−3106