Let us consider two fundamentally different ways to model process behaviour. One is to build a ... typical pulp and paper plant may involve several thousand sensors. Paper mills .... tional problem in this context: Suppose that the learning system can produce ..... The resuming electric energy is bought at market price from an.
Approximating process simulators with learning systems SICS Technical Report T2005:03 ISSN 1100-3154, ISRN:SICS-T–2005/03-SE 2005-01-24
Daniel Gillblad1 , Anders Holst1 , Bj¨ orn Levin1 , and Magnus Gudmundsson1 Swedish Institute of Computer Science, Box 1263, SE-164 29 Kista, Sweden {dgi, aho, blevin}@sics.se
Abstract. We explore the possibility of replacing a first principles process simulator with a learning system. This is motivated in the presented test case setting by a need to speed up a simulator that is to be used in conjunction with an optimisation algorithm to find near optimal process parameters. Here we will discuss the potential problems and difficulties in this application, how to solve them and present the results from a paper mill test case.
Keywords: Machine Learning, Neural Networks, Process Simulation, Process Optimization
1
Introduction
There is usually a large amount of parameters that can be externally modified in a process industry. Many of these parameters have a significant impact on the conditions and performance of the process, and are e.g. used to select the kind of quality produced. By necessity, some of the parameter settings are better than others for a desired output quality when it comes to how effectively the process is being run. Many of the parameter settings are scheduled some time in advance, e.g. to produce necessary amounts of different product qualities. It is therefore highly desirable to find a course of action that is optimal by one criterion or the other, making more effective use of the production process. 1.1
Simulation and optimization
An optimal course of action in a process can be found by using an optimizer (e.g. [1] [2]) that iteratively tests different scenarios in a first principles simulator, i.e. a simulator that tries to mimic the physical properties of the process, and gradually converges to an optimal solution. A typical example is that we want to switch from quality A to quality B in a paper mill, and want to find the cheapest, fastest
or least energy consuming way to convert the process. An initial state for the simulator must be retrieved from the actual process, and this initial state plus a suggested scheme of actions in some suitable form, for example as time series, is fed to the simulator. The resulting time series from the simulator are then evaluated by calculating a cost function. The optimizer does this iteratively by generating a sequence of suggested action schemes, converging to a near optimal one. This final scheme is then suggested to the operators as an effective way to control the real process. It is quite often possible to run a simulator faster than real time, i.e. simulating one second of process time takes less than one second in the simulator. This would make it potentially possible to use this simulator to try out several possible scenarios much faster than real time. Unfortunately, although the simulator is faster than real time, it might still not be fast enough. Let us take an example with numbers that reflect actual conditions in a more complex simulator: Assume it takes about 2 seconds to simulate one minute of real time, i.e. 30 times faster than the real process. How many iterations that are typically required for the optimization is of course difficult to estimate, but we can assume that it in many cases amounts to at least a few hundred, and much more if the simulators cannot give the gradient directly. This means that the optimization in this case would take in the order of ten times longer time than the actual process, and probably much more since it is uncommon that a simulator can produce gradients directly. When the optimizer has reached a conclusion the transition is already over. If this is the case, some way too speed up the simulations is critical. 1.2
How to use learning systems to speed up simulations
Let us consider two fundamentally different ways to model process behaviour. One is to build a first principles simulator of some sophistication. It has to consider how e.g. flows, temperatures, pressures, concentrations, etc. varies as material flows through components. The other approach is to approximate the input-output mapping in the process with some mathematical function, without considering the actual physical path. This is essentially what is done by a learning system, in which at least a subset of the parameters are estimated from examples (see e.g. [3], [4] for an introduction). The simplest example is linear regression: just make a plot of the output values corresponding to a suitable selection of input values, and fit a line, or hyper-plane if there are several dimensions, through these points. More advanced examples of learning systems are neural networks, decision trees, case-based methods, genetic algorithms, and various non-linear statistical models. The main idea of speeding up the simulation by using a learning system amounts to partly replacing the slow and detailed simulator by a fast learning system, mimicking the input-output relation of the simulator. In practice this involves the following steps: First it has to be decided exactly what input-output mapping we are trying to mimic, i.e. what are the inputs and what are the outputs. Then a suitable representation of the inputs and outputs is selected. A
suitable type and architecture of the learning system must also be selected at this stage. After this, a sufficiently large set of training data must be collected, in this case by running the simulator with representative inputs. When this is done it is time for the training of the learning system, during which its parameters are adjusted to make it reproduce the mapping in the training data as well as possible. Finally, the learning system can be used by feeding it a new input pattern and reading out the proposed output. Note that a learning system is not necessarily the only way to speed up simulations. One could e.g. implement a simplified simulator, focused on the relevant aspects of the process, and therefore much faster than the detailed full process simulator. Some hybrids between using learning systems and the simple simulator approach are also conceivable. Each component in the process can be represented by a separate learning system, or indeed a simple simulator. These models are then connected in the same way as the physical components, resulting in as a kind of simpler simulator, built up in part by learning systems. 1.3
Potential complications
So far it all seems fairly straightforward. Unfortunately, there are complications. Let us now go through the different necessary steps and see what potential problems that can be expected in each of them. Choosing and collecting data Let us start with a tautology: If the system is supposed to learn from examples only, there must be examples of all situations the system is supposed to learn. Therefore the training data must represent the whole space. When the process is run in reality, under normal conditions, only a very small fraction of the entire state space is used. Most states are simply worthless from the process point of view. Nevertheless, the learning system does not know that these states are worthless unless the training data contains examples showing this. Generating relevant and complete training data is therefore a very important issue. We need data to cover not only the normal conditions, but also to a large degree all possible conditions. Still, we do not necessarily wish to subject the learning system to data from parts of the state space that are simply impossible from a process perspective or just very far from the states the process will ever operate in. Given this data, the function that the learning system must approximate is likely to become very complicated, and attempts to effectively learn it may be fruitless. We have to balance the training data so that it contains all necessary, but preferably not any more, information. This will require careful studying of the process and most likely a rather high degree of domain knowledge. Reducing the number of dimensions When the number of inputs increases, the number of possible states of these inputs increases exponentially. This means that the required amount of training data also increases exponentially in the number of inputs, unless simplifying assumptions can be made or there are known
relations between the inputs. As an example, a humble space of only ten inputs would most likely require in the order of a thousand training examples. Already at some 25–30 inputs, the number of required examples is far larger than can realistically be produced in the process plants. At the same time, a typical pulp and paper plant may involve several thousand sensors. Paper mills might easily have about 1500 sensors along the line, and there are paper mills where the number of parameters in the evaporation step alone is above 7000. A simulator may have quite a lot less output values, since it is likely to represent a simplified version of the process. Nonetheless, the number of outputs can still, especially from a more advanced simulator, be overwhelming. Fortunately, simplifying assumptions can usually be made which mitigates the situation. If for example the state space is assumed to be completely linear, which is the assumption made when using linear regression on process data, it is sufficient with a number of data points that grows linearly with the number of dimensions. However, as the complexity of the space increases, the number of required data points increases rapidly. Therefore effort must be spent keeping the number of inputs to a minimum, and not to use representations that “waste” free parameters. How to handle time series If the inputs or outputs are in the form of time series, which is a very likely scenario in the case of process simulators, this too must be handled effectively. In this problem setting, the input consists of the initial state of the process, and the time series describing the control variables used to convert the process. One simple approach when there is a fixed and small number of time steps in the series is to put the input vectors for the different time steps next to each other in one large input vector. This is, for several reasons, unlikely to be suitable when emulating real process behaviour. First, the number of time steps that we want to simulate is probably not fixed, and the duration we want to simulate may even implicitly be one of the factors we would like to optimize. Second, the number of time steps is probably not small, and it does not take many time steps to make the dimensionality of the space unmanageably large. Finally, since the output should also be one or several time series, there will be a lot of outputs required. To further complicate matters, the exact number of outputs may not be known in advance, since the number of time steps it takes for the process to stabilize after a transition is not known, and need not be the same as the number of time steps given for the control variables. Another approach is to let the learning system iterate through the time steps. First the initial state of the process and the first time step of the control variables are input, and the network predicts the process state for the next step. That prediction is then input along with the next state of the control variables, and yet another prediction is based on this. By iterating this procedure, we can arrive at a prediction of the process state many time steps ahead. This is generally a good way to solve some of the dimensionality problems involved in dealing with time series. The drawback is that this method might give somewhat
unstable results, due to the repeated predictions. Since the learning system only approximates the real process, the errors from each step quickly accumulate through the iterations, and make the predicted time series diverge from the actual process development. Whether this will be a problem or not in practice must be tested empirically on data. There are several additional techniques worth mentioning that can be used to handle time series. If the frequencies or wave forms are important rather than just the absolute values, Fourier or wavelet transforms can be used. If there are variations at different time scales that are important, a set of Gamma filters (“running averages”) can be applied to the series. The use of Markov models is another solution that may reduce the dimensionality in a time series. There is however an alternative and desirable type of solution that may be possible in specific cases: To avoid explicit time series altogether by selecting a more compact representation of the input and output of the network.
Selection of representation Representation is critical. A large part of any data analysis task involves selecting the appropriate representation. With the right representation it may be sufficient with a very simple learning system to solve the task, whereas with the wrong representation no method whatsoever may be able to solve it. For example, representing the control actions as time series gives unnecessary expressive power: A time series can jump to a new arbitrary value in each time step, whereas a control variable is likely to be mostly constant, with just a small number of jumps or gradual changes. This waste of expressive power requires the learning system to have more inputs than necessary and therefore more parameters, which in turn requires more training data to estimate them from. If instead the control actions can be represented and fed to the system in some more suitable form, this could drastically lower the amount of required training data and at the same time increase the accuracy of the predictions. The number of inputs is certainly not the only critical factor here. The complexity of the shape of the function that is to be approximated is of course also important. If it has a simple shape, for example a plane or one large valley, the task is easy. If it has several small bumps and pits it is more complicated. The task can definitely be made much harder than necessary by selecting an unsuitable representation. A related issue are symmetries in the representation. A symmetry means that the result is the same if two input attributes for example exchange values with each other. Symmetries can be difficult because they make the number of optima, both global and local, multiply exponentially: If we have found one optimum we can find another by just permuting the suitable values in the solution. The landscape will be much more complicated and again require a model with more parameters requiring much more training data. The conclusion is that a representation should be selected that gives an as simple form as possible of the function to approximate.
Pointwise accuracy is no guarantee of close optima There is an additional problem in this context: Suppose that the learning system can produce a reasonable approximation to the actual simulator output, say always within some small error, at least for inputs in the useful part of the process space. To be strict, the learning system will not have any “within fixed limit” guarantee, since it is usually the average error over the data that is minimized, but for the discussion let us assume that we can find such a limit for some region of the data. Then this is still no guarantee that the optima in the two cases are close to each other. The energy landscape may be relatively flat in some area, and the learning system approximation may have a quite different direction of the gradient. In the worst case the learning system gradient will lead the optimization out from the useful area of the space, into a domain that has not been covered sufficiently by training data, and where the “fixed limit” therefore does not hold. The optimizer may then get to the conclusion that the best solution is something that lies far out from the physically reasonable settings of the process, and in reality not good at all. Indeed, if the learning system is carefully trained to give a good approximation in a limited area of the space, it is almost certain that there are both lower and higher values outside this area. This means that if the optimizer is good enough in finding the global minimum, it will almost always end up at a non-realistic solution! One way around this problem is to estimate the certainty of the learning system output, and give also this value to the optimizer to enable it to steer away from the areas where there has been insufficient training of the learning system. Whether this will actually be a problem is mainly an empirical issue that must be tested in each domain. Generally it can be noted that again the problem decreases significantly with smaller or less complicated state spaces. Are the simulators realistic enough? An issue important not only for the learning systems but for the entire optimization, is how realistic the simulators are. All simulators are built on some level of abstraction, omitting irrelevant details and “process noise”. As far as those omissions are not relevant for the optimization, everything should be fine. However, there may be situations where factors relevant for the optimal solution are not included in the simulators. There may for example be an interest in optimizing paper production by minimizing paper breaks. Experience from similar tasks show that the exact mechanism for a paper break is very complex, and to a large extent unknown. Important factors may be the buildup of dust and dirt on the machines, the gradual clogging up of the felts, the vibration level in the machines, etc. If the simulator does not consider such things, the optimizer may well claim for example that the best is to run the process at a very high speed, whereas in practice that would cause so much vibration that the risk of paper breaks increased dramatically. On the other hand, if the simulator actually models realistically the “risk” of different kinds of breakdowns, and other things that have a large random
component in them, then this randomness must be handled by both the optimizer and the learning system. If the simulator chooses to generate a paper break with some calculated probability, the learning system will have to sample each data point several times to be able to estimate how this risk varies in the space. Besides increasing the requirements of the amount of data, it also introduces a component of noise, and therefore of uncertainty. It is much better if the simulator is deterministic, and instead reports the calculated probabilities for various malfunctions as separate outputs. The same thing should hold for the optimizer: if the simulator is not deterministic, the optimizer will have a much harder time trying to follow a gradient to a minimum. A perhaps somewhat counter-intuitive fact is that a more realistic and therefore more complicated simulator might be more suitable to approximate with a learning system than a simple one. For example, a simple simulator, not incorporating all control loops that exists in the real process, might easily show oscillatory behavior when situations deviate just slightly out of the ordinary. These oscillations are very difficult for a learning system to learn. In a more advanced simulator, the built-in control loops will hopefully dampen these oscillations, making the resulting data easier to approximate with a learning system. 1.4
Suggested solutions
In the discussion above, some general solutions to the various problems have already been hinted at. Using these, it may be possible to build a quite straightforward learning system model to handle the approximation task. The main steps of constructing this system would include the following: Make sure there is a large amount of relevant and complete training data from as diverse process conditions as possible. Then train a learning system to predict one or several time steps ahead, and use that network iteratively to predict a whole time series. Even better would be to reformulate the problem statement so that we do not have to represent time explicitly in the model. If necessary, also calculate a certainty of the network output, which can be used to guide the optimizer away from regions in the space where there are no training data. The following section addresses some additional suggestions, perhaps useful if these straightforward solutions turn out not to be sufficient. Selection of inputs and outputs Many of the potential problems are related to the size and complexity of the space, which affects the number of free parameters of the model. The key idea is therefore to keep the number of free parameters to a minimum, by selecting an appropriate representation, and by harnessing any inherent structures in the domain and in the task to solve. As discussed above, much would be gained if the time series inputs and outputs could be more compactly represented. At the same time the representation should preserve any “natural” relations between inputs and outputs, and not introduce any cumbersome invariances, such as for example permutation symmetries. It can be noted that the optimizer have much of the same problems
as the learning system training algorithm: For best performance in both cases, the parameter space should not be too large, because then there will be too many possibilities to explore; there should be few local minima, and preferably one global minimum that affect the space also at relatively large distances from it; there should be no sudden changes in the energy/optimality for a minimal change of the inputs; etc. Although the energy function of the learning system and the cost function of the optimizer are not the same, it may be a good idea to let them use the same representation, since many of these problems are related to the representation itself. However, the learning system will very likely use an even simpler representation than the optimizer since simplifying the representation often is the key to make learning work. Much the same case can be made for the output of the learning system. Feeding out a time series may be cumbersome. It is always useful to ask what the output from the learning system is to be used for. The output of the network should in general be as “close” to the final product as possible. This is because the training of e.g. a learning system tries to minimize the square error of the output, but if too complicated calculations are performed on this output, the network that minimizes the square error of the output may not be the same network that minimizes the square error of the final calculation. In this case the output time series should be used to calculate a cost function. Another idea is to reformulate the problem from a direct time series representation to a representation based on events. By an event, we here mean a change that might affect the process in such a way that we have to switch from one static state representation to another. We have to assume that the process does not change state within each event, as well as we have to find a way to transform the data to a representation that fulfills this requirement. If this is possible, we do not have to represent time explicitly, but simply predict the next process state from the previous one. We will discuss this method in further detail later on, as it proves to be an effective way to represent process data. Estimating a single cost is frequently much less complex than estimating the individual outputs in each time step. Whenever possible it could therefore be a good idea to let the learning system output the estimated cost directly. However, some cost functions may also depend on outer factors not known by the network, like energy prices at each instant of the time series, and could therefore not be calculated by the network. This must of course be handled to be able to use this method. One alternative in that specific case is to let the network predict a time series of energy consumptions rather than the energy cost. Predicting a single time series is still easier than predicting time series for all the individual process variables. Whether this approach can be used or not will have to be determined in each individual case. Continuing the idea that the network output should be as close as possible to the final destination, it may be even better to output the cost function or the gradient of the cost function. This is what is actually needed by the optimizer to select a new better control sequence. It is not at all certain that e.g. taking the difference of two network outputs will be the same as predicting this difference
directly: in the former case there is an uncertainty on both values, which adds up when the difference is calculated, and since the difference between them might be small, the uncertainties alone may completely cancel out the “actual” difference. If the difference is predicted directly, there will still be some uncertainty, but hopefully small relative to the result, and there is no cancellation. Note that even if predicting the whole cost function is not possible, we might be able to predict parts of it, especially if these are restrictions on the output values. For example, if the calculation of the cost function makes use of the final level in a number of intermediate storage tanks with the limitation that no tank may overflow at any point in time, we might be able to predict directly whether tanks will overflow or not, and when this is not the case we predict the actual tank levels. Partition the process in components Another, complementary approach to reduce the complexity of the task is to partition it into several smaller tasks: It may be possible to use existing knowledge about the physical layout of the process to partition it into smaller components. These components can then be approximated by smaller learning systems that are connected in the same way as their physical counterparts. By doing this, we have in practice encoded knowledge about the structure of the process into the components and the way they are connected. The exact level at which the process should be partitioned (many small parts or just a few semi-large parts) can be selected to be suitable for the case at hand. This solution will lead to a dramatic reduction in the total complexity of the representation of the process. Each component may have an input-output space magnitudes smaller than the total process space, and with much less complicated relations in it. For many components it may even be sufficient with a simple linear model. The result is a need for much less training data while at the same time the accuracy of the mapping increases. Even if only a small fraction of the total process space is ever explored by the actual process, it is more likely that the functional range of each component is used to a quite high degree. This means that the problem with large areas from which the learning system has no training data also disappears. The obvious drawback of this method though, is that it requires extensive knowledge about the process and how to best break it down into smaller components. On the other hand, a lot of this work has probably already been done when constructing the simulators. Use raw data instead of simulator data for training One question that should be kept in mind is to what extent the learning system should be trained on simulated data, and when instead data from the real process could be used. If the simulators do not produce sufficiently realistic data, or omit to model some aspects that are relevant for the cost function (e.g. the risk of various malfunctions, or quality parameters of the paper), then there is always the possibility of using raw data directly from the plants instead of simulator data for training. This may give better and more realistic approximations from the system.
Typically only the variables that are not considered by the simulator should be based on real process data instead, although these may actually have a global impact on all variables, rendering an incomplete simulator less useful. In this extreme case there would be no need for simulation in the system at all, but all data should come from the real process. However, this may lead to some severe complications: During normal operation, the process stays within a rather small part of the total state space, since the process is being run in an almost optimal way almost all of the time. The process also often resides in slightly different areas of the state space after each restart, which might lead to that the available training data is not representative. In general we therefore do not have access to raw training data that covers a sufficiently large part of the state space. With a simulator it is easier to obtain data also from regions that are not optimal, and data that are more evenly spread out in the state space. Another complication is the fact that the raw data is usually of a stochastic nature, requiring us to have several samples of the same state in the training data to be able to make reliable predictions. A deterministic simulator is therefore naturally preferred over the noise raw data in terms of ease of prediction. Note however that if the process model is partitioned into components as discussed above, it might very well be possible to find training data that covers the whole state space for each component and that has less of a stochastic behavior. In this case this solution of using real data may be possible. Partitioning the process using the objective function There might also be a possibility to divide the state space, and perhaps disregard large parts of it, based on the objective function. First of all we might restrict the inputs and outputs of the learning system quite heavily, since we obviously only need to predict the values used by the objective function. Further restrictions in representation can be made if the cost function does not consider the values at every time step of each variable, but for example just the final value after a certain amount of time. It might also be possible to simplify the problem based on constraints in the cost function. For example, limits on acceptable values of variables can reduce the relevant state space directly, as well as rendering some variables uninteresting. Also, if we can predict whether we will break one of these constraints or not in a reliable way, we can train and test the models that predict actual values on a much smaller subset of the total state space where these constraints are not violated.
2
The UPM Kymmene test case
As a test case, a simulator developed by KCL for the UPM Kymmene paper mills in J¨ ams¨ ankoski was chosen. This simulator was chosen for a number of reasons. First, the simulator itself and the problem were well defined and readily available. Second, and perhaps most importantly, it was possible for us to run
the simulator ourselves on our own computer systems, something that would be very difficult with the other simulators. A significant amount of the total testing time, if not the main part, must go into understanding the simulator itself and how to generate relevant training and testing data. This would have been nearly impossible without the direct availability of the simulator itself. For the test case, we will completely rely on the simulator. No real process data is used to train or test the learning system, and therefore the performance of the learning system will be measured as how well it approximates the simulator, not how well it corresponds to the real process. Neither will we approximate the whole cost function directly, mostly because of limited availability of data that is needed by the cost function but not generated by the simulator. The aim of the tests is to evaluate the usefulness of the methods mentioned earlier on real data and to determine were the problems and pitfalls with the modeling appear to be. 2.1
The J¨ ams¨ ankoski mill and the paper production process
Before we delve into the details of the J¨ ams¨ ankoski mill and the simulator, let us give a very brief introduction to paper production. In short, the paper production process describes the dispersion and dilution of parallel wooden cellulose fibres into pulp, and the later mesh weaving and dehydration of these dissolved fibres into sheets of paper. The wooden fibres consist mainly of cellulose fibres bound together by lignin, a collection of complex ring-shaped organic molecules, but also other minor extractives such as fatty acids and harts. The cellulose fibre is a complex structure of glucose macro-molecular chains supported by lignin. In order to disband the cellulose fibres from each other and create pulp, one can use either of two classes of methods: Chemical pulping, where the lignin is released chemically from the pulp, and mechanical pulping, in which the wood is processed mechanically, ripping the fibres apart. In the J¨ ams¨ ankoski mill, mainly thermo mechanical pulp refiners are used. These refiners grind wood chips between grooved grinding disks. The heat resulting in this process generates large amounts of steam, which is used to heat and moisten the wood chips, as well as to dry the paper in the final steps of production. 2.2
Overview of the process
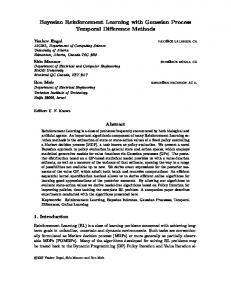
There are two separate refiner lines, each consisting of five refiners. In the first refiner line each refiner has a capacity of 115 tons of pulp per day; the second line individual refiner capacity is 190 tons per day. There is a possibility of pumping pulp from up to two active refiners in refiner line two to refiner line one. From the refiners, pulp flows into storage tanks connected to three individual paper machine production lines. The first refiner line is connected to two production lines with paper machines known as PM4 and PM5, whereas the second refiner line is connected to a single production line and a paper machine PM6. Each production line consists of a complex system of tanks and filters, where the
Mixing Tanks TMP 1 5 Refiner Lines @ 115 t/day each 4 Reject Refiners Bleaching Pulp Storage
PM4
Wet Broke
Mixing Tanks
TMP 2 5 Refiner Lines @ 190 t/day each 3 Reject Refiners Bleaching Pulp Storage
Dry Broke
PM5
Wet Broke
Mixing Tanks
245 000 t/yr 1350 m/min 835 cm wide 49-56 g m 2
Dry Broke
PM6
Wet Broke
120 000 t/yr 900 m/min 532 cm wide 57-80 g m 2
325 000 t/yr 1600 m/min 930 cm wide 39-60 g m 2
Dry Broke
Fig. 1. Overview of refining lines and paper machines at the J¨ ams¨ ankoski mill.
pulp is screened, bleached, thickened, recycled and diluted to receive the correct qualities for the specific grade produced at that instant. The pulp is then fed to a paper machine. For simplified schematics of the J¨ ams¨ ankoski plant, see figure 1. In the paper machines, the thermo mechanical pulp is mixed with chemical pulp and fillers of different proportions to produce a certain stock. Different stocks give papers of specific grades with varying qualities and characteristics. The process of turning stock into paper is mainly about reducing water content in the stock and takes place in three main steps. First, the stock is poured onto a rotating hydroscopic felt that draws water from the stock, making the prior fluid stock a weak but manageable sheet. Second, the sheet is pressed between rollers, further reducing water content. Finally, the sheet of paper is dried to a desired humidity. There are also other post-production processes, e.g. glossing the paper, in order to receive a certain surface quality and structure of the paper. If there is a break in the paper machine, the process will need to be halted and the paper machine cleared before restarted to produce paper from stock. Because
paper production has great momentum, the production of pulp and stock cannot be stopped every time a break occurs. Since breaks occur stochastically and are to be considered a normality in paper production, the mills have been designed to save and recycle materials in a normal break. 2.3
The mill simulator
The simulator of the J¨ ams¨ ankoski mill calculates the state and production flow for a time period of variable length given an initial set of production specific parameters. The simulator is implemented in Simulink, a Matlab toolbox, and simulates mill operations about 2000 times faster than real time on a standard PC. When creating a physical simulator of a system, in this case the J¨ ams¨ ankoski mill, one first has to create an appropriate mathematical model of that given system. When creating this model, generalisations and simplifications are made in order to acquire the most accurate and information dense data set from fewest possible simulator calculations. Such simplifications are naturally done also in this simulator. The simulator of the J¨ ams¨ ankoski mill calculates flows of resources, e.g. water and electricity, process materials, e.g. pulp and stock, as well as rates of paper production in the mill. No detailed physical quantities such as flow- or pressure gradients are incorporated in the simulator for the sake of efficiency. Most industrial systems are governed by regulatory controls, composed of strict mathematical functions, which easily can be transferred into the model of a system. Human interaction, however, which is often an important part of the system, cannot. Since human behaviour is not easily translated into mathematical expressions, such systems are generally more difficult to model correctly. In the J¨ ams¨ ankoski mill simulator, some but not all regulatory control systems existing in the mill are implemented. Also, human regulatory interaction of the mill is totally unaccounted for. This makes the generation of simulator data corresponding to real mill states a very delicate process, since the simulator has fewer means of tuning parameters during operation. For example, initial settings that might be usable in the plant might develop into unrealistic process states in the simulator, since necessary manual adjustment cannot be performed. As we mentioned earlier, another critical process specific characteristic in terms of modelling a paper mill is the occurrence and effects of breaks in the paper machines. Since there is little known about how to model breaks accurately, they are generally considered to occur stochastically. The rates of breaks at paper machines at the J¨ ams¨ ankoski mill have been found to depend on the grade produced at that instant. Breaks are implemented into the simulator as a type of efficiency, describing the average time that a paper machine has been found to have a break for a given grade. This approach does not give as realistic circumstances of mill simulation as perhaps could have been achieved by producing stochastic grade dependant breaks in the paper machines. However, since not all regulatory systems existing in the mill are present in the simulator and corrections of scheduled production parameters cannot be made
during simulation, creating data from the simulator corresponding to real mill circumstances would be immensely difficult if breaks were to be implemented as a stochastic element. It would also, as discussed earlier, be very problematic for the learning system and the optimizer to deal with this random element. 2.4
Mathematical representation of the problem
The mathematical representation of an optimization problem is an objective function. The objective function maps a parameter setting, or system state, into a scalar value representing the level of optimality for that setting or state. Since the objective function contains all relevant parameters for the optimisation, it serves as a foundation for the structure of the learning system. The objective function of the optimization of the J¨ ams¨ ankoski mill incorporates four main factors. Electricity costs The mill consumes vast amounts of electric energy. Part of the required electric energy is bought at fixed price, with the addition of a contract stipulating requirements of amounts of used energy within certain time periods. Failure to comply with these requirements will result in economic penal measures. The resuming electric energy is bought at market price from an exchange. The contribution of these electric costs CE to the objective function is formulated as X CE = PEtot (t) · CP (t) (1) t
where CP (t) is the cost of electricity at time t, and the total electrical power consumption PEtot (t) is defined as tmp2 tmp2 PEtot (t) = PEtmp1 ntmp1 nref (t) ref (t) + PE
(2)
tmp2 ntmp1 ref (t) and nref (t) represent the number of refiners used at time t, while PEtmp1 and PEtmp2 represent the power used by one refiner in line one and two respectively. PEtmp1 is typically 1.9167 MW and PEtmp2 is usually around 3.4167 MW.
Consistency of schedules and running systems There is a wish to run the mill in an as stable manner as possible in order to minimize both the workload involved in shutting down and engaging mill systems, as well as fluctuations of pulp consistency. This desire is represented by two terms in the objective function, a cost of changes term called CC related to the shutdown and start up of refiners, as well as a total difference term C∆tot , related to schedule set points. The cost of changes contribution CC to the objective function is simply calculated as fifteen times the amount of refiner changes per schedule. C∆tot is calculated by summing the differences at each time point between the schedule
currently being drawn and the schedule that is planned on being used. The C∆tot contribution to the objective function is meant to minimize set point differences between current and suggested schedules that are similarly priced in terms of other objective function parameters. Desired volumes Depending on the desired state of the mill at the end of a schedule, there will be specific desired storage tank volumes at that time. The difference between these desired volumes and the volumes of the current predicted schedule constitute V∆ . The objective function The complete objective function can now be expressed as the weighted sum of the parameters described above, Ctot =
CE C∆tot |V∆ | + CC + + 104 4 4
(3)
where Ctot is the total weighted cost. A trajectory through the space spanned by the parameters of this function that minimises the scalar term Ctot , is to be considered a set of optimal production parameters of the J¨ ams¨ ankoski mill. 2.5
Overview of the process and attributes
The inputs to the simulator fall into two categories. First, there are parameters describing the initial state of the simulator. These parameters are given as scalar values and all of them represent tank levels. Second, there are external control variables. These are given as time series, and represent e.g. grades and number of refiners used at any moment. These parameters are scheduled ahead, so all changes to them are usually known some time in advance. Table 1 shows a list of all in-data parameters that set the mill state and development through time. The grades deserve some further comment. In the simulator, there is no such thing as an explicitly fixed grade. Instead, there are a number of variables, including mixing proportions, expected production speed and others that all have a specific setting for a certain grade. Since the dimensionality of the problem becomes very high if we include all these parameters, we will instead use the ten grades usually used in the mill as discrete inputs to the process, which is what is represented by PM4Q–PM6Q. For each discrete outcome of these parameters, there is a corresponding grade and thus specific setting for a number of parameters. The data generated by the simulator is in the form of time series. The simulator generates one value for every time step for all output variables. The outputs represent tank volumes, overflow volumes and production, and are briefly described in table 2. The output variables include tank levels, overflow indicator variables, freshwater intakes and production output rate. The overflow indicators and freshwater intakes differ from zero only in short time intervals when a tank actually
Table 1. Simulator inputs. Variable name Tank 1 Volume Tank 2 Volume Tank 3 Volume Tank 4 Volume Tank 5 Volume Tank 6 Volume Tank 7 Volume Tank 8 Volume Tank 9 Volume Tank 10 Volume Tank 11 Volume Tank 12 Volume Tank 13 Volume Tank 14 Volume Tank 15 Volume Tank 16 Volume TMP1 #Refiners TMP2 #Refiners #Refiners to TMP1 Fraction To PM4 PM4Q PM5Q PM6Q
Variable type Initial value of tank 1 Initial value of tank 2 Initial value of tank 3 Initial value of tank 4 Initial value of tank 5 Initial value of tank 6 Initial value of tank 7 Initial value of tank 8 Initial value of tank 9 Initial value of tank 10 Initial value of tank 11 Initial value of tank 12 Initial value of tank 13 Initial value of tank 14 Initial value of tank 15 Initial value of tank 16 Time series of active refiners in line 1 Time series of active refiners in line 2 Time series of refiners from line 2 to 1 Time series of fraction of pulp to PM4 Time series of grade produced in PM4 Time series of grade produced in PM5 Time series of grade produced in PM6
Table 2. Simulator outputs. Variable Tank 1 Volume Tank 2 Volume Tank 3 Volume Tank 4 Volume Tank 5 Volume Tank 6 Volume Tank 7 Volume Tank 8 Volume Tank 10 Volume Tank 11 Volume Tank 12 Volume Tank 13 Volume Tank 14 Volume Tank 15 Volume Tank 16 Volume Tank 1 Overflow Tank 2 Overflow Tank 3 Overflow Tank 4 Overflow Tank 5 Overflow Tank 8 Overflow Tank 10 Overflow Tank1 11 Overflow Tank1 13 Overflow Tank1 15 Overflow Tank1 16 Overflow Tank 6 Freshwater Tank 7 Freshwater Tank 12 Freshwater Tank 14 Freshwater Tank 16 Freshwater PM4 Production PM5 Production PM6 Production
Characteristic Fluctuating between 50–95% No clear stable point, varies between 0–100% Reasonably stable between 85–88%, low variation Reasonably stable between 35–37%, low variation No clear stable point, varies between 0–100% Reasonably stable between 82–83%, low variation Stabile in segments Reasonably stable at 20%, varies upwards Fluctuating without obvious stable point No clear stable point, reaches maximum frequently Reasonably stable between 77–83%, low variation No clear stable point, varies between 0–100% Reasonably stable between 89–91%, low variation No clear stable point, varies between 0–100% Fluctuating between 17–35%, sometimes reaches maximum Differing from zero in short spikes, uncommon Differing from zero in short spikes, somewhat common Differing from zero in short spikes, uncommon Differing from zero in short spikes, somewhat common Differing from zero in short spikes, somewhat common Differing from zero in short spikes, somewhat common Differing from zero in short spikes, somewhat common Differing from zero in short spikes, somewhat common Differing from zero in short spikes, somewhat common Differing from zero in short spikes, uncommon Differing from zero in short spikes, common Differing from zero in short spikes, somewhat common Differing from zero in short spikes, somewhat common Differing from zero in short spikes, somewhat common Differing from zero in short spikes, somewhat common Differing from zero in short spikes, somewhat common Stable in segments according to schedule of PM4Q Stable in segments according to schedule of PM5Q Stable in segments according to schedule of PM6Q
overflows or needs to take in more fresh water. If the value differs from zero, it represents the actual flow out or into the tank. The production output rate is actually selected in the scheduled grade parameter, but might differ from the desired value if there are underflows or similar in the tank system before the paper machine. 2.6
Generating training and test data
Let us move on to how to generate training and test data for the learning systems. At first, this might seem like an ideal case: The data is generated by a simulator, which should be relatively noise free. There is no noise or disturbances in the measurements; we do not have to deal with drifting sensors and so on. As a further benefit, we can generate as much data as we like from the simulator, hopefully not having to manage with too few data samples. Unfortunately, things are not quite that easy. We do not have measurement noise in the data, at least not in the same way as in real process data. What we do have, on the other hand, are quantization effects from the finite precision calculations and time resolution in the simulator. These lead to effects that must be interpreted as noise by the learning system, and more importantly might give rise to oscillations in data that otherwise should be stable. This might be very difficult to handle for the learning system. Assuming that these effects are small and can be largely disregarded, there is still one problem remaining: What training data should we actually generate? Having a large amount of training data is still effectively useless if it does not reflect the data the learning system will encounter in use. When generating data, we would like to cover as much as possible of all possibly relevant states of the process. Fortunately, this can be rather straightforward using a statistical modeling approach. 2.7
Modeling the simulator inputs
The basic idea is to model the joint distribution of the “normal” conditions over all inputs to the simulator, including state variables and external control variables, and then sample random input values from this distribution. By “normal” states, we refer not only to the states and conditions the process normally encounters in daily use, but rather conditions that do not produce faulty or unacceptable behavior. However, we can to some degree exclude conditions that are valid from a process point of view, i.e. they do not provoke unusable process states, but will never be used in practice. This could for example be inputs that correspond to grades that are never used in the mill or production speeds that will never be used in practice. We will consider these practical limitations as constraints, and not produce data covering the regions outside these constraints. Modeling the joint distribution over all inputs might seem difficult at first, but there are reasonable assumptions that simplify the procedure considerably. As a first approach, we will consider all inputs to be independent. This means that the joint, multivariate distribution is simply the product of all marginal
distributions. We only have to describe these marginal distributions over each variable, which simplifies the task significantly. The marginal distributions can naturally be on any form, but we will use simple and common parameterizations such as uniform distributions, normal distributions etc. The parameterization of the distribution should preferably make as few assumptions about the variable and its range as possible, which means that most parameters are likely to be modeled by e.g. uniform distributions over a certain operating range. When we e.g. from explicit constraints know that two or more variables are dependant, we model these using a joint distribution over all variables. With this approach we can encode most constraints over several variables. For the external control variables the situation is a little bit more difficult. Here we do not need to generate a single random value for each variable, but rather a time series that to at least some degree reflect a real control sequence in the plant. We will model these control sequences using Markov processes, each with transfer probabilities that will generate a series with about the same rate of change and mean value as the real control sequences. Although we now potentially can set up an input distribution and sample from it, there are some additional concerns worth keeping in mind. The modeling might not get right the first time, and we should evaluate it by comparing the resulting random control sequences and initial states to the actual control sequences and states in the plant, if only by visual inspection. What we on the other hand should be very careful with is to modify the data generation based on the performance of the learning system. Doing this will effectively lead to over fitting and data selection based on model performance, which we want to steer well clear of for an unbiased estimate of generalization performance. Ideally, we want to generate one realistic data set before we start evaluating a learning system and then not modify this data at all. This might be impossible for practical reasons, but is what we should try to accomplish to the furthest extent possible.
2.8
Setting up the simulator
When generating the raw data, the simulator first has to be set up to simulate a time interval appropriate for the information desired to be extracted from data. In this case this corresponds to a simulated time interval at least as long as the longest prediction horizon in later optimisation, which is 72 hours. The possible method of conducting fewer simulations of excessive length and later dividing these into appropriate intervals is not appropriate. This is because the simulator space may hold attractor points or limit cycles, effectively locking or repeating data simulation thus giving rise to unnecessary repeated calculations and possibly a sparse out-data space. The duration of simulation was set to 3·10 5 seconds, corresponding to about 83 hours. Generating distributions, ranges and possible transition conditions for the simulator parameters can be found below.
2.9
Tanks
The tank levels constitute an initial condition of the simulation. Two of the sixteen tanks are to be kept at a steady level, and thus their initial values were not randomly generated. For the remaining tanks, not much information is available except their individual ranges, so uniform distributions where chosen to represent their initial conditions, making as few assumptions about their initial states as possible. A table of the tanks ranges and selected distribution can be found in table 3. Here we consider all initial tank volumes to be independent, Table 3. Generating distributions for the initial tank levels. Variable Variable type Generating distribution Tank 1 Volume Initial volume of tank 1 Uniform distribution: 0.40-0.99 of total tank volume Tank 2 Volume Initial volume of tank 2 Uniform distribution: 0.01-0.99 of total tank volume Tank 3 Volume Initial volume of tank 3 Constant: 0.9 of total tank volume Tank 4 Volume Initial volume of tank 4 Uniform distribution: 0.01-0.99 of total tank volume Tank 5 Volume Initial volume of tank 5 Uniform distribution: 0.01-0.99 of total tank volume Tank 6 Volume Initial volume of tank 6 Uniform distribution: 0.01-0.99 of total tank volume Tank 7 Volume Initial volume of tank 7 Uniform distribution: 0.01-0.99 of total tank volume Tank 8 Volume Initial volume of tank 8 Uniform distribution: 0.01-0.99 of total tank volume Tank 9 Volume Initial volume of tank 9 Uniform distribution: 0.01-0.99 of total tank volume Tank 10 Volume Initial volume of tank 10 Uniform distribution: 0.01-0.99 of total tank volume Tank 11 Volume Initial volume of tank 11 Uniform distribution: 0.01-0.99 of total tank volume Tank 12 Volume Initial volume of tank 12 Uniform distribution: 0.01-0.99 of total tank volume Tank 13 Volume Initial volume of tank 13 Uniform distribution: 0.01-0.99 of total tank volume Tank 14 Volume Initial volume of tank 14 Uniform distribution: 0.01-0.99 of total tank volume Tank 15 Volume Initial volume of tank 15 Uniform distribution: 0.01-0.99 of total tank volume Tank 16 Volume Initial volume of tank 16 Uniform distribution: 0.01-0.99 of total tank volume
which means all tank levels are modelled by univariate distributions. This independence assumption is reasonable and effective, but does most certainly not
hold. However, to account for all dependencies we have to consider all the inner workings of the simulator, something that we do not have information about and cannot model in detail. 2.10
Refiners and grades
The refiner schedules constitute time series with specific ranges and conditions. Both refiner lines have a possibility of running a maximum of five active refiners. They must not change the active number of refiners more than one at a time, and due to power limitations it is not desired to have both refiner lines using the maximum five refiners simultaneously. Since the use of three or less active refiners only is applied during situations with difficult breaks, and the simulator does not support stochastic breaks, a range of four or five active refiners was assumed. According to information from the mill, the average number of active refiners should be somewhere between four and five, but closer to four. Because of a desired possibility of increasing the refiner range with more states, and the condition changes of only one step, the number of active refiners was modelled as Markov processes. More information about the generating distributions for each variable can be found in table 4. As discussed before, the Table 4. Generating distributions for the external control variables. Variable name TMP2 #Refiners
Variable type Time series of active refiners in line 2 #Refiners to TMP1 Time series of refiners from line 2 to 1 Fraction to PM4 Time series of fraction of pulp to PM4 PM4Q Time series of grade produced in PM4 PM5Q Time series of grade produced in PM5 PM6Q Time series of grade produced in PM6
Generating distribution Markov process between values 4 and 5, average 4.144 Markov process between values 0, 1 and 2, average 1.2 Uniform distribution between 0.3 and 0.4 of total flow Uniform distribution over the 23 available grades Uniform distribution over the 4 available grades Uniform distribution over the 10 available grades
discrete valued grade parameters correspond to actual grades used in the mill, and set a number of different parameters in the simulator. The rate of grade changes reflects the actual rate of changes in the mill, and all grades are considered to be equally likely. 2.11
Data generation
A data set to be used for evaluating the learning system was generated using sampling from the statistical model of the inputs. 690 initial values and schedules
TMP 1 5 Refiner Lines @ 115 t/day each 4 Reject Refiners Bleaching Pulp Storage
Tank 5
TMP 2 5 Refiner Lines @ 190 t/day each 3 Reject Refiners Bleaching Pulp Storage
Tank 2
Tank 3
Tank 4
PM6
Tank 8
Tank 7
Tank 6
Fig. 2. Schematic overview of the system between TMP 2 and PM 6.
were sampled from the distributions described above, were each refiner and grade schedule was a time series with 300 000 samples, representing 300 000 seconds of time. The simulator was then run for 300 000 seconds, the same time as the schedules, for each random sample of initial values. Since each generated output from the simulator represents 20 seconds of time, this generates 15 000 samples. All output data, along with the scheduled attributes, were saved to be used for evaluation purposes. In total, more than ten million samples were generated from the simulator, representing around six and a half years of process running time. The amount of data might appear to be rather large, but the amount is most likely necessary to cover at least a decent part of the total state space. The size of the total data set of about 10 GB is somewhat limiting however, as this amount of data is difficult to handle with most implementations of learning systems. 2.12
The resulting data
The amount of data and number of parameters are both quite high, so from now on we will concentrate on a part of the complete system for our testing. We are going to work with the part of the simulator covering the system from the refiner line TMP2 to the paper machine PM6. This part is representative for the rest of the system, as this mostly consists of duplicates of the system we are focusing on. An overview of the selected sub-system is shown in 2. The connections and flows displayed in figure 2 is mainly conceptual, since the actual connections in the simulator are much more complicated, but it gives a useful basic understanding of the system.
5 5 2
4 4 0 0
43199
Fig. 3. An example of generated refiner schedules. The figure shows a ten day long schedule.
23 4 10
1 1 1 0
43199
Fig. 4. An example of the generated grade schedules. The figure shows a ten day long schedules.
2.13
Converting the time series data
As discussed earlier, the natural approach to emulate the simulator with a learning system is by step-by-step recursive prediction. However, this is rather difficult on the generated data. The state space is large and complex, making the error in the prediction add up quickly and diverging from the true trajectory. The prediction horizon is also rather far ahead, meaning that we potentially need to iterate the prediction up to 15 000 steps if we want to use the same resolution as the simulator. Also, the large amount of training and testing data required is difficult to handle in practice. Initial testing also revealed that it was indeed very difficult to perform this kind of prediction, and the results were not encouraging. Dealing with time explicitly in the model did not seem to be an option. Representing the data as events We need to find an alternative approach to the problem, and we can actually re-write the data into a form that does not involve time directly. Let us first make a few observations on the problem. From the cost function we know that we are not directly interested in the tank levels at every single point in time, but mainly their final level at the end of the optimization horizon. We want to make sure that we have satisfactory tank
levels at the end of the run, so that we do not perform the optimization on the expense of making the process impossible to run when the optimization horizon is over. Apart from that, the tank levels can be pretty much anything. However, we do not want to overflow or underflow any tanks during the time interval, as this disturbs the process and does not produce optimal quality. By studying the inputs and outputs from the simulator, we also know that apart from the internal control loops, all parameter changes in the process are scheduled ahead, such as the number of refiners and the grade. We know all external changes to the process beforehand, and also how long the process stays with these parameter settings. This allows us to re-code the data as events, where an event occurs at every change of one of the scheduled control parameters. If we assume that the process stays in one steady state, i.e. that flows or levels are stable during the whole event or at least after a shorter stabilization period, it should be possible to predict e.g. tank levels or the difference in tank levels at the end of an event from initial levels, flows, production and perhaps event length. So, by using knowledge about the cost function and the process we can represent the problem much more efficiently and hopefully make it possible for a learning system to solve. The only assumption that must be fulfilled is that the process behaves in a stable manner during most of the event length, something that does not seem unreasonable since the only changes to the process in this case come from these scheduled variables. For a learning system to be able to predict the tank levels effectively though, the tank levels should be monotonous during the event, i.e. not change the sign of the derivative. We transformed the complete data set generated by the simulator to this event format by generating one example for every change in the scheduled parameters, to be able to test predicting the final tank levels in the event from the initial values, the scheduled parameters and the event length. In total, this resulted in 9758 events, of which the first 1000 were used as test set and the rest, 8758 events, were used for training. The resulting data set size is in the range of a few megabytes, a much more manageable size than that of the raw data. The tested model types were a statistical model composed of finite mixture models [5] and Na¨ıve Bayes models [6], k-nearest neighbor [7], and a neural network using the back propagation algorithm [8]. For all different model types, a separate model was constructed for each tank. The statistical model used was a supervised mixture model with one component for each grade. The component distributions were na¨ıve Bayes models, using Gaussian distributions for all attributes. The k-nearest neighbor used the ten closest examples, a value that was chosen experimentally. All inputs were normalized to between zero and one when the distance function was calculated. The euclidean distance was used as the distance function, except for the discrete attributes which used a Hamming distance (one when the values are different, zero when the same).
The neural network used one hidden layer with five units (selected experimentally), all units using a sigmoid activation function. Inputs and outputs to the network were normalized to minus one and one. The models were tested by predicting the difference in a tanks’ level at the end of an event from the initial level in the beginning of the event, and the results can be found in table 5. The inputs of the models were selected based on the layout of the process and by experimental verification. Studying the test results, we can see that the different models’ performances are reasonable similar. The results are, however, not particularly good. Although there might be a reasonable correlation coefficient in some cases, the square errors are still much too high for the predictions to be seen as very useful. Since all three types of models, all using a different approach to learning from the others, perform similarly well, we can conclude that the problem is ill posed. Table 5. Results from predicting the difference in tank levels using both event- and monotonous event data. σ denotes the standard deviation of the data, and results are displayed using both the correlation coefficient (ρ) and the root mean square error (RMS) for the multi-layer perceptron (MLP), k-Nearest Neighbour (k-NN), and Na¨ıve Bayes (NB) models.
Tank σ 2 22.5 3 16.0 4 15.9 5 14.9 6 15.8 7 22.0 8 19.4
Events MLP k-NN NB ρ RMS ρ RMS ρ RMS σ
Monotonous Events MLP k-NN NB ρ RMS ρ RMS ρ RMS
0.50 20.3
0.59 18.2
0.52 19.3
37.8 0.89 33.3
0.89 17.4
0.70 11.7
0.63 12.4
0.71 11.2
7.5 0.82 5.18
0.81 4.85
0.71 26.6 0.84 4.29
0.48 16.0
0.64 12.1
0.57 13.2
16.4 0.77 12.5
0.72 12.4
0.53 15.5
0.34 14.0
0.35 14.0
0.35 13.9
15.6 0.44 6.66
0.44 15.1
0.33 15.9
0.61 12.8
0.55 13.2
0.55 13.2
14.2 0.59 8.13
0.57 11.9
0.51 12.8
0.54 18.7
0.57 18.0
0.47 19.3
21.2 0.63 12.8
0.58 16.5
0.44 18.3
0.69 14.1
0.75 12.7
0.54 16.4
20.1 0.76 14.9
0.72 14.5
0.51 17.9
Overflows and regulatory connections So why does it actually go wrong? The approach is definitely very reasonable, but a closer look at data reveals a likely reason to the poor performance. By examining what actually happens in the simulator output, we can see that our assumption that the process stabilizes quickly and then behaves in a constant manner during the event is almost true, but with one very important exception. Let us study an example from the data. Figure 5 shows that the tank levels behave very nicely during the first part of the event, most of them increasing or decreasing linearly or perhaps just remaining constant. Then, one tank overflows and the regulatory systems in the simulator change behavior. The tank volumes start to oscillate and behave in a rather unstable manner, since the overflow affects almost the entire tank system directly or indirectly. These oscillations and
73.47 89.38 37.19 49.96 45.22 21.18 77.66 18.4 85.69 19.57 43.63 19.71 20.6 55.85 15200
16499
Fig. 5. An example of the characteristic oscillations of tank levels that arise in the system.
the changes to the tank levels they induce are very difficult for a learning system to predict, since it in essence has to learn how to predict the phase, frequency and perhaps shape of these oscillations to be able to make a reasonably good prediction. As we have observed, overflows or underflows lead to unstable behavior in the process, while the non-overflow conditions generate rather smooth data. Now, we can actually use this observation to change the representation of the problem in a manner that would make it easier for the learning systems to solve. The monotonous event representation Since overflows or underflows are not desired from the cost functions perspective, we actually have an opportunity to restrict the state space we train the learning system on to only the data that does not contain any overflows or underflows. The model would of course only be valid when no overflows or underflows occur. For use by the optimizer, we can create a separate model that predicts whether an event will have an overflow or underflow or not. Another approach is to actually in practice predict a derivative for the tank levels and see whether this would lead to an overflow or not in any of the tanks during the event. If an overflow is predicted, then this can be reported to the optimizer. Otherwise, the prediction of tank levels is performed, and these values are used by the optimizer. Similar to the generation of events earlier, we transformed the original data set to a form with one example for each event in the scheduled variables. Unlike the earlier event generation though, a tank that levels out, i.e. goes from changing in level to remaining constant, also constitutes the end of one event and start of another. This is done because the regulatory controls change in the model when this situation occurs, and therefore we want to represent it as an event. An overflow or an underflow of any tank also constitutes the end of an event, but not the start of a new since the process now is in an unstable state. The reaching of an overflow can actually be used as the end value of an event, since the process behaves normally up to this point. All events generated that were shorter than 30 minutes were discarded, as they were considered to be too noisy to be included. This resulted in 7716 gener-
ated events in total, of which the first 100 events were used for testing, and the rest of the events for training the models. The models used were as described earlier, except for the fact that the discrete grade is not used by the models. Instead, a slight improvement in results could be observed by using just the production parameter from the grade. This also meant that the statistical model could be simplified to a na¨ıve Bayes model instead of a mixture of Naive Bayes models. When initial results proved rather promising, backwards selection was used to find the most important input parameters for each model. This means that each model was initially trained on all input parameters, and the correlation coefficient on a validation data set calculated. This result was then compared to the results when each of the the inputs were removed in turn, and the model which improved performance the most was selected. The procedure was then repeated until the result could not be improved upon. The test results are shown in table 5. An improvement of the results compared to earlier tests was observed, but some tank levels are still very difficult to predict. The main storage line of tanks 2, 3 and 4 show decent results on the test data set, but the tanks with a connection from the paper mill (tank 5 and 6) are very difficult to predict accurately. The differences in these tanks are usually zero, i.e. no change is made to the level most of the time. Sometimes, though, these tanks levels change quite drastically, probably indicating that a control loop all of a sudden need to use these tanks for temporary storage. Predicting when and to what degree this happens is very difficult. The differences between the different models performance is again not that high, but they do prefer different sets of inputs. The statistical model and the neural network are both rather good at removing excess inputs themselves in the training, so they generally use a larger number of inputs here. The k-nearest Neighbor on the other hand is very sensitive to what set of inputs is used, and its input selection generally reflect the actual layout of the process. Worth noticing, however, is that what model is considered to be the best at predicting a certain tank’s level depends on what performance measure we use. The neural network has for example the highest correlation coefficient on Tank 2, but also a significantly higher RMS error than both the na¨ıve Bayes model and the knearest neighbour model. This is a result of the model being able to accurately predict the sign of the difference, but not the magnitude of the difference. Usable predictions can probably be made for the tanks in the main line (tank 2, 3, and 4) and some tanks used for temporary storage, which would include gradients since this is essentially what we are predicting here. However, if the exact levels of the tanks connected more directly to the process itself are necessary, then there is a question of whether the predictions produced by the models are good enough. The correlation coefficient is definitely very low, but the tanks do not usually fluctuate much, which means that the mean absolute error of the predictions still could be kept rather low.
3 3.1
Discussion The test results and general methodology
It is obvious that we can arrive at quite interesting results using learning systems to approximate simulators, and that we actually can emulate the behavior of the simulator with a rather good accuracy. However, our tests also show that the problem is a difficult one, requiring a lot of time for the modeling. The data and domain must be rather well understood to generate training data from the simulator, and this modeling takes quite a long time. All in all, the resulting learning system must rely heavily on simplifications of the state space, both from narrowing down the region covered by the training data as well as in the representation. Simplifying the representation in this case also means taking advantage of restrictions set by the cost function, narrowing down the scope of the learning system. If we change the cost function just slightly, the representation and learning system is no longer relevant. It seems likely that we can expect well performing learning system approximations of simulators to be highly specialized, which is problematic when we want to generalize the results and methods to other simulators. The question about how general the methods used in the test case are still remains to some degree. There is no question that the method of generating data from the simulator by sampling from a set of distributions describing the relevant state space is effective. The event coding of data is naturally also useful and rather general, as well as the narrowing of the state space by using the cost function, but how well they in practice can be applied to other problems still remains to bee seen. We should also be careful with what we are actually approximating. In this test case, we used a relatively simple simulator to see whether the approach seems plausible or not. In reality, approximating a simple simulator is rarely worth the effort. The learning system cannot perform any better than the simulator itself (we are after all emulating exactly that simulator), and it does not seem likely that a learning system can outperform the simple simulator in terms of speed at a similar level of error. After all, the simulator does not actually perform that many calculations per time step, and there is by necessity some computational overhead in the representation of the learning system. The matter of course changes to the learning systems advantage if we predict the cost function or at least parts of the cost function directly, or perhaps use a very clever representation, but we still need to consider were we put our efforts. It can also be argued that learning systems often are not a suitable solution for approximating a first principles simulator. The reason is that most “real” processes are described by a system of non-linear differential equations. Such systems will display chaotic behaviour, i.e. small changes in input data are quickly amplified, and lose correlation with the input. The time horizon for accurately predicting the output from input data is likely about as short as the time span within which the non-linear differential equations can be approximated by linear differential equations. However, this might not be a problem if we are not
interested in the actual output values after a longer time period, but rather a mean value over a certain time or similar. Even if we need these actual output values, it might still be possible to reformulate the problem so that it is solvable. It might potentially also be possible to divide the simulator into smaller parts and replacing some or all of these parts with fast learning systems, overcoming the problem of non-linearity for these systems. 3.2
Future work
Although already practical in some cases, to be able to effectively and automatically approximate simulators with learning, systems further work in several areas are essential. Perhaps surprisingly, this work will probably not need to focus on the actual learning algorithms, but rather on the data they might operate on. First, the generation of appropriate and complete training and testing data should be, if not automated, at least refined into a general methodology. To generate relevant data sets from the simulator, considering normal operating conditions, possible operating conditions and the domain implied by the cost function is very difficult, especially if data should be generated in correct proportions according to the level of interest in at a certain point in the state space. By necessity, it will always include some manual labor, unless the process is completely automated and all control functions known, since some of the knowledge of the process is possessed by the operators. However, assuming that the method of sampling in state space according to a set of distributions is used, general guidelines and recommendations on how to model these controlled (and perhaps other) simulator input parameter distributions would be very useful. This would require studying a larger number of practical cases to even begin building a methodology, but could be interesting nonetheless. Second, the process will almost certainly have to be divided into parts to make it possible to use learning systems. Whether this division is based upon physical connections and sub-systems, implied constraints by the cost function or both is indifferent from some aspects, since they both require a lot of manual labor as well as rather extensive domain knowledge. Automating this division of the process in parts will require extensive research. There are no methods that can even come close to automating the procedures today. Finally, as we have seen, modeling complex time series is difficult and it is unlikely that a learning system could find the actual dynamics of a process if we do not use a clever representation. We have already discussed one solution, which is to divide the process into events. This gets rid of the problem of representing time explicitly, but makes a few assumptions about the process that may not always be fulfilled. It also requires some modification to work when the complete resulting time series is necessary to compute the cost function. However, it remains to be seen whether this method can be used regularly for process modeling, as it needs to be applied to more domains to evaluate if the assumptions made are generally correct. Further studies on time series representation would be beneficial, as well as automated selection of this representation.
3.3
Final conclusions
The idea of replacing a slow simulator with a faster learning system is promising. However, as the test case showed, it is by no means an easy process and not necessarily an effective solution with the methods available today. The generation and representation of data require quite a lot of work, which might easily make it more effective to develop a simpler, faster simulator instead. Method development might need to get further before we can expect the learning system simulator replacement to become a directly viable as an alternative in general.
References 1. Nash and Sofer. Linear and Nonlinear Programming. McGraw-Hill (1996). 2. Bertsimas and Tsitsiklis. Introduction to Linear Optimization. Athena Scientific (1997). 3. T.M. Mitchell. Machine Learning. McGraw-Hill (1997). 4. Norvig and Russel. Artificial Intelligence, A Modern Approach. Prentice Hall (2003). 5. G. McLachlan and D. Peel. Finite Mixture Models. Wiley & Sons (2000). 6. I.J. Good. Probability and the Weighting of Evidence. Charles Griffin (1950). 7. T. Cover. Estimation by The Nearest Neighbour rule. In IEEE Transactions on Information Theory 14(1) (1968) 50–55. 8. D.E. Rumelhart and J.L. McClelland. Learning internal representations by error propagation. In Parallel Distributed Processing, volume I. M.I.T. Press, Cambridge, MA (1986).