19th European Signal Processing Conference (EUSIPCO 2011)
Barcelona, Spain, August 29 - September 2, 2011
APPROXIMATION OF REAL IMPULSE RESPONSE USING IIR STRUCTURES A. Primavera, S. Cecchi, L. Romoli, P. Peretti, F. Piazza A3Lab - DIBET - Universit`a Politecnica delle Marche Via Brecce Bianche 1, 60131 Ancona Italy
[email protected] www.a3lab.dibet.univpm.it
ABSTRACT In this paper, we propose a new approach to the approximation and simulation of a real impulse response. Starting from a preliminary analysis of the mixing time, the impulse response is decomposed in the time domain considering the early and late reflections. Therefore, an IIR structure composed of a cascade of second-order sections and four all-pass filters is employed to synthesize the first part of the impulse response, using a parametric optimization process in the frequency domain. Then, a recursive structure composed of comb and all-pass filters is used to synthesize the late reflections, exploiting a minimization criterion in the cepstral domain. Several results are reported taking into consideration a real impulse response, confirming the validity of the proposed approach.
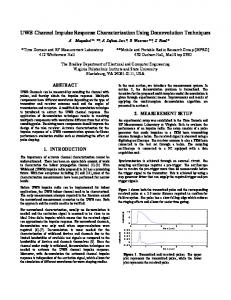
Figure 1: General scheme of the algorithm. of comb and all-pass filters is used to synthesize the late reflections, exploiting minimization criterion in the cepstral domain. In Section 2 an accurate description of the entire algorithm is reported, focusing on the automatic parameters setting procedure for early and late reflections (Sections 2.1 and 2.2, respectively) and on the used minimization criterion (Section 2.3). Section 3 reports the obtained experimental results in terms of objective and subjective measures. Finally, conclusions are drawn in Section 4.
1. INTRODUCTION In the last 30 years, the problem of simulating real impulse responses (IRs) by means of digital reverberation systems has been deeply investigated [1, 2, 3, 4]. Even if the signal processors technology has been improved rapidly allowing real-time convolution with long impulse responses, many structures for the approximation of the impulse response have been proposed in the literature. A good approximation using shorter filters allows a reduction of the computational cost, which is always remarkable, as well as the number of memory access, taking into consideration an embedded implementation. The most common approach is to simulate the socalled early reflections by FIR filters and the exponentially decaying reverberant part by recursive structure like comb filters and all-pass filters. Therefore, all approaches involve the problem of finding appropriate model parameters of the recursive structure taking into account the IR time domain behaviour. In [5, 6] an adaptive processing is presented in order to define suitable reverberator coefficients for the Moorer’s and Schoereder’s model with reference to a selected IR. However, other different approaches can be found in the literature taking into consideration different domains of analysis. In [4], a wavelet analysis using logarithmic multirate filter banks is used to define the parametric models. A similar approach is presented in [7] where the Short Time Fourier Transform is applied to decompose the signal, while Steigliz-McBride algorithm is used to evaluate the coefficients of the IIR structure. With regards to the decomposition into early and late reflections, the IR is generally truncated at an arbitrary point in time, considering that the early reflections are usually included within the first 80ms; obviously, this does not imply a good choice for the definition of the early reflections depending on the environment characteristics. The selection of a truncation point that is determined by specific statistical characteristics of an individual IR was explored for the first time in [8], and then exploited in [9]. Differently from the most common approaches, the proposed method is totally based on IIR structures. Starting from a preliminary analysis of the mixing time, the impulse response is decomposed in the time domain considering the early and late reflections. Therefore, an IIR structure composed of a cascade of second-order sections and four all-pass filters, is employed to synthesize the first part of the impulse response, using a parametric optimization process in the frequency domain. Then, a recursive structure composed
© EURASIP, 2011 - ISSN 2076-1465
2. ALGORITHM DESCRIPTION The first step of the algorithm is the partitioning of the early reflections from the late reverberation, defining the mixing time, i.e., the time elapsed from early to late reflections. As mentioned before, the mixing time is generally fixed at an arbitrary point in time considering that early reflections are included within the first 80 ms. However, since they depend on the environmental characteristics, this choice does not imply a good definition of the mixing time. Therefore, different methods have been developed to estimate this value without knowing the physical characteristics of the environment. The method used in this work is based on gaussianity estimators [9] and it evaluates when the temporal distribution of the signal tends towards a gaussian distribution. Starting from the evaluation of the mixing time, two different procedures are then applied to evaluate the parameters of each structure (i.e., early and late reflections) as shown in Fig. 1: the former is defined in the frequency domain, while the latter in the cepstral domain. 2.1 Early reflections approximation The main characteristic of the proposed approach for the approximation of the first part of the IR resides in the fact that the main structure is based on a second order sections (SOSs) chain of parametric IIR filters. The presented approach derives from a technique applied to the loudspeaker equalization [10]. As shown in Fig. 2, the final approximation filter with N sections can be written as follows: N
∏ Hp (z),
(1)
a2 z−2 + a1 z−1 + a0 , b2 z−2 + b1 z−1 + 1
(2)
Her (z) =
p=1
where H p is in the form H p (z) =
with the parameters defined in Table 1. Let us consider that the filter to be approximated varies around the 0-dB line (Fig. 3), it is possible to approximate the real IR using the proposed structure, compensating the difference between the
694
10 A7
A5
5
Magnitude (dB)
A3
Figure 2: Block diagram of early reflections device.
A1 −5 A8
0.4
0.5
0.6
Normalized Frequency (rad)
0.7
0.8
(4)
L1 =
1. Initialization of the algorithm: p = 1. 2. The error vector is calculated as reported in Eq. (4): the biggest area is found by searching for the biggest peak/dip in e(wk ). Fig. 3 shows an example of the areas to be searched. 3. The initial parameters for the parametric filter H p (z) are selected: the central frequency f p is the mean between the zerocrossing point of the selected area; the gain G p is the value of the error at f p ; Q p is chosen between 1.5 and 3 for each p filter. 4. Then, an optimization of the initial parameters (i.e., f p , G p , Q p ) is performed as suggested in [10], using a heuristic approach. It consists in performing iterative random variations of the parameters close to the initial values computed previously using a new cost function defined as:
−g + z−D 1 − gz−D
1 N
N−1
∑ (φr (n) − φa (n)) ,
HLBCF (z) =
(5)
1 1 , = 1−d −n 1 − gc L p (z)z−n 1 − gc 1−dz −1 z
(9)
where gc and d are two different parameters that permit to change the generated reverberation effect. The variable gain (gc ) sets the reverberation time (T60) while the damp (d) sets the air damping at high frequencies. The frequency response of an all-pass filter is given by: HAP (z) =
(6)
−1 + (1 + ga )z−n . 1 − ga z−n
and p = p + 1 for each iteration. Since the SOSs chain is capable of identifying just the magnitude of the frequency response, four all-pass filters have been added
Table 1: Parametric filter coefficients: A p is the square root of the filter linear gain G p , Q p is the quality factor of each filter, w0 = tan(π fc / fs ) and fs is the sampling frequency. a0 a1 a2 A A (1 + Qpp w0 + w20 ) (2w20 − 2) (1 − Qpp w0 + w20 ) (1 −
(8)
n=0
The late reflection approximation is realized by an IIR filters network simulating the reverberation tail. In details, it is composed of four all-pass filters in series and eight parallel LBCF (Low-pass feedBack Comb Filters) for each audio channel, as shown in Fig. 4. The comb filter is implemented using a delay-line whose output is low-pass filtered and added to the input. The overall LBCF transfer function is:
where n f is the final frequency index and ni the initial one of the wlog vector. The last three steps are repeated N − 1 times for the other SOSs considering:
b1 (2w20 − 2)
(7)
2.2 Late reflections approximation
i
b0 Qp 2 A p w0 + w0 )
1
where φr is the phase response of the real IR and φa is the phase response of the structure described in Fig. 2.
nf
(1 +
0.9
with l = 1, · · · , 4 and g, D the parameters to be set. Then, a minimization procedure is applied to the entire structure using the method described in Sec. 2.3, taking into consideration the following loss function:
(1) Her (wk ) = 1,
(p+1) (p) Her (wk ) = H p (wk )Her (wk )
0.3
Hal (z) =
where wk represents the k-th element of the new logarithmically spaced frequency axis wlog . Four are the steps of the algorithm:
1 ∑ |e(wk )dB | n f − ni + 1 k=n
0.2
in order to supply the correct phase of the artificial filters. The frequency response of an all-pass filter is given:
A frequency warping is applied by defining a new non-uniformly spaced frequency axis wlog = [w0 , w1 , · · · , wN−1 ]. This is done in order to respect the logarithmic behavior of the human ear [4, 10]. In this way a new error vector is defined as follows:
elog =
0.1
Figure 3: Search of biggest area and design of first SOS.
(3)
e(wk )dB = H(wk )dB − Her (wk )dB ,
A4
−15
real frequency response and the reference line. Taking into consideration H, i.e., the Fast Fourier Transform (FFT) of the real IR, an error function is calculated as follows: H(w) . Her (w)
A6
−10
−20 0
e(w) = 1 −
A2
0
b2 Qp 2 A p w0 + w0 )
Figure 4: Block diagram of late reflections device.
695
(10)
An all-pass filter is obtained only for ga ∼ = 0.618. Obviously, the number of comb and all-pass filters can be increased as pointed out in [3] where a feedback delay network is used; this leads to a more precise approximation but also to a more complex structure with a great computational complexity. Therefore, a compromise between computational efficiency and approximation quality has to be achieved: the structure used in the proposed approach (e.g., Nl = 8 and Nap = 4) is sufficient to well identify late reflections, as will be demonstrated in Sec. 3. Starting from Eq. 9, Eq. 10, and Fig. 4, 17 parameters (gc , d, ga , one delay, one gain, eight delay lines of the LBCF filters and four delay lines of the all-pass filters) have to be set in order to make the artificial IR as similar as possible to the desired IR. Therefore, an adaptation procedure has to be used for iteratively finding these parameters, taking into consideration the following loss function: v u uR M L2 = max max t ∑ ∑ [Tr (i, j) − Ta (i, j)]2 , i=1 j=1
Figure 5: General scheme of the adaption procedure: F(z, θ ) is the transfer function of whole late reflections structure while HTarget represents the late reflections of the real impulse response.
(11)
where y(·) denotes a measure of the loss function, ck is a gain sequence, and ∆(k) is a p-dimensional random vector. The following three conditions have to be respected ensuring the system stability: n o −1 E ∆ki < ∞ ∀i = 1, . . . , p (16)
where Tr is a matrix which represents the Mel-Frequency Cepstral Coefficients (MFCC) derived from the real IR, Ta is the MFCC matrix of the approximated IR [11], R is the length of the analysis window, and M is the number of MFCC. The MFCC cepstral coefficients are derived from the IR as suggested in [12]: the FFT of the windowed impulse response is firstly computed to derive the energy spectrum and the result is warped onto the mel scale using a filter bank; then, the MFCC coefficients are calculated as the inverse FFT of the logarithm of the power spectrum. The minimization procedure applied to this loss function is described in Sec. 2.3, taking into consideration M = 26 MFCC, a window of length R = 256 with an overlap of 50%.
lim ck = 0;
(18)
where ∆k is a vector with a Bernoulli statistics and value +1 or −1. The sequences ak and ck can be written as follows: a0 α (A + k + 1) c0 γ, ck = (k + 1)
ak =
The minimization criterion is based on Simultaneous Perturbation Stochastic Approximation (SPSA) [5, 9] as shown in Fig. 5. Taking into account a minimization problem, where L(θ ) is the loss function and θ is the p-dimensional vector of parameters, the steepest descent method can be used to find the set of parameters θ ∗ that minimize L(θ ): = 0.
(12)
∂ L(θk ) , ∂ θk
In order to evaluate the performance of the proposed algorithm, the computational complexity in terms of the needed number of multiplications and additions, used for the filtering operations, has been
Table 2: Comparison between the proposed method and the FIR filter approach[14] in terms of computational complexity for filtering operation. N is the number of SOS filters and Na is the number of all-pass filters for the early reflection part. Nl is the number of comb filters and Nap is the number of all-pass filters in the late reflection part. K is the frame size, L = 2K is the overlap while P is the number of partitions for FIR filtering approach.
(13)
where k is the iteration number. By using the SPSA technique, Eq. 13 can be modified as:
θk+1 = θk − ak gk (θk ),
(14)
where ak is an arbitrary gain sequence and gk is the gradient esti∂ L(θ ) mation ∂ θ k on the k−th iteration. Considering a simultaneous k perturbation, the value of gk can be computed as
y (θk + ck ∆k ) − y (θk − ck ∆k ) 2ck
−1
∆k1 .. . ∆k p
,
(20)
2.4 Computational complexity
θ =θ ∗
θk+1 = θk − ak
(19)
with A, α , γ , a0 and c0 arbitrary constants. The following values are used as proposed in [13]: A = 1, α = 0.602, γ = 0.101, and c0 = 0.01. a0 is a vector of constants that varies for each parameter to be found in the optimization process.
However, when the system is characterized by a large number of parameters (high value of p), it is really hard to determine the gradient value. In this case, SPSA procedure allows to obtain an approximation of the gradient with two measures of the loss function, considering a large number of variables to be optimized. The general recursive form of a classic minimization problem is:
gk (θk ) =
(17)
k→∞
2.3 Minimization procedure
∂ L(θ ) ∂θ
lim ak = 0;
k→∞
Add
Proposed
FIR
approach
implementation
4N + 2Na +
1 K [2L log2 (L) + 2L(P − 1)]+ 2 K1 (LP)
2Nl + 3Nap Mul
(15)
5N + 2Na + 3Nl + 2Nap
696
1 K [L log2 (L)]+ 4 K1 (LP)
30 Amplitude (dB)
Amplitude
1 0.5 0 −0.5 −1
0.1
0.15 0.2 Time (s) (a)
0.25
0.3
0 −10
0.35
10
2
3
0.5 0 −0.5
0.05
0.1
0.15 0.2 Time (s) (b)
0.25
0.3
Figure 6: (a) Real impulse response of a room ( fs = 48000Hz). (b) Artificial impulse response derived with the proposed approach.
10
Real Artificial 1 Artificial 2
2000 0 −2000 −4000 0
0.35
4
10 Frequency (Hz) (a)
4000 Phase (degrees)
Amplitude
10
−20 0.05
1
−1
Real Artificial 1
20
5000
10000 Frequency (Hz) (b)
15000
Figure 7: (a) represents the magnitude response of the real IR and of the artificial one and (b) reports the phase of the real IR and of the artificial response without the all-pass filters in the early response approximation (Artificial 2) and with the all-pass filters (Artificial 1).
calculated. Table 2 reports the computational load of the proposed technique compared with the FIR filter basic approach using an uniform partitioned overlap and save technique [8, 9, 14]. It is clear that the use of IIR filters improves the performance in terms of required multiplications and memory employed for the memorization of the filters taps. Taking into consideration the numbers used for the experimental results (e.g., N = 20, Na = 4, Nl = 8, Nap = 4, K = 64, L = 128, P = 584 ) and Table 2, we have that the overall number of multiplications for the proposed approach is 140 while for the FIR approach is 4686. Considering the overall number of additions, we have 116 additions for the proposed approach and 4696 for the FIR approach. If we consider the memory usage which is an important parameter in the case of embedded system implementation, the proposed approach has a lower request (e.g., 10000 samples) than the other method (e.g., 300000 samples). Therefore, the proposed approach has lower computational complexity which can increase taking into consideration a more complicated structure: there is a compromise between the requested accuracy and the maximum computational load. However, we will show through the experimental results that it is possible to have a good approximation of the IR taking into consideration a simple structure with low computational complexity.
structure and Nl = 8 comb filters and Nap = 4 all-pass filters for the late reflections part. Regarding the early reflections structure, Fig. 7(a) and Fig. 7(b) show a comparison of the magnitude and phase response of the real and artificial IRs, respectively. The artificial response is quite similar to the original one but the differences are due to the number of filters used for the structure. It is possible to have a more accurate artificial IR but we have tested that this approximation is sufficient to have the same reverberation perception of the real one. Fig. 6(b) shows the time response of the overall artificial IR: it looks very similar to the real IR (Fig. 6(a)), as it was confirmed by the listening tests. Fig. 8(a) shows the Energy Decay Relief (EDR) [9] of the real IR, while Fig. 8(b) represents the EDR of the approximated IR: they result very similar and this is supported by the listening tests. The behaviour of the approximated IR is slightly smoothed since it is calculated considering the smoothed version of the real IR. Moreover, it is worth nothing that as reported in [15] the human ear cannot detect spectrum changes of ±2dB with respect to the level in the neighbouring bands; therefore, the difference between Fig. 8(a) and Fig. 8(b) can be neglected as also confirmed by the listening tests. Listening tests have been carried out in order to assess the quality of the proposed approximation. The subject is required to compare the stimuli with the original signal and to score it according to a discrete quality scale divided into five intervals (i.e., Bad, Poor, Fair, Good, and Excellent) [16]. The scores are then normalized in the range between 0 and 100, where 0 corresponds to the bottom of the scale (Bad). A grade of 100 is assigned when the stimulus is identified as equal to the reference signal. Three test sessions were carried out taking into consideration a different number of the SOSs (i.e., N), reproducing the sound track through a PC with professional headphone (i.e., AKG). The number of subjects involved was 10 (8 males and 2 females), as suggested in [16], with ages ranging from 21 to 35. The data analysis is performed as an average across subjects of the score associated with each stimulus. Fig. 9 reports the results considering 15, 30, and 50 SOSs, keeping fixed the structure of the late reflections: it is evident that for all the
3. SIMULATION RESULTS Different tests have been carried out in order to evaluate the approximation quality, in terms of subjective evaluation and objective measures, comparing the approximated signal with the real one. The automatic procedure for the parameters setting has been tested with different real IRs, but for the sake of brevity just the results for a room environment is reported: Fig. 6(a) shows the time behaviour of the real IR with a T60 of 683ms, represented as a FIR filter of 32768 samples. First of all, the mixing time has been estimated using two gaussian estimators (e.g., Kurtosis and Mean Absolute Deviation/Standard Deviation ratio) as described in [9]: for the used real IR we have a mixing time of 30ms. Then, the proposed approach has been applied taking into consideration a structure with N = 20 filters and Na = 4 all-pass filters for the early reflection
697
stral domain. Several results are reported taking into consideration objective and subjective tests for real impulse responses. The results obtained in the objective tests in terms of energy decay relief have been confirmed by the subjective listening tests: the listeners did not find differences between the approximated IR and the real one. Future works will be oriented to the real time implementation of the approach considering an embedded platform. REFERENCES [1] M.R. Schroeder, “Natural Sounding Artificial Reverberation,” J. Audio Eng. Soc., vol. 10, pp. 219–223, 1962. [2] J.A. Moorer, “About This Reverberation Business,” Computer Music Journal, vol. 3, no. 2, pp. 13–28, 1979. [3] J. Jot, “Digital Delay Networks for designing artificial reverberators,” in Proc. 90th Audio Engineering Society Convention (AES’91), Paris, Feb 1991. [4] M. Schoenle, N. Fliege, and U. Zoelzer, “Parametric approximation of room impulse responses by multirate systems,” in Proc. IEEE International Conference on Acoustics, Speech and Signal Processing (ICASSP’93), Minneapolis, MN, apr. 1993, vol. 1, pp. 153 –156 vol.1. [5] G. Constantini and A. Uncini, “Real-Time Room Acoustic Response Simulation by an IIR Adaptive Filter,” Electronics Letters, vol. 39, pp. 330–332, 2003. [6] A. Uncini, G. Costantini, and G. Barbasso, “Adaptive Filter for Real-Time Room Acoustic Response Simulation,” in Proc. Second International Conference “Understanding and Creating Music”, Caserta, Nov 2002. [7] J.C. Sarris and G.E. Cambourakis, “Time frequency analysis and parametric approximation of room impulse responses,” in Proc. IEEE International Conference on Acoustics, Speech and Signal Processing (ICASSP’03), Hong Kong, apr. 2003, vol. 6, pp. 297–300. [8] R. Stewart and D. Murphy, “A Hybrid Artificial Reverberation Algorithm,” in Proc. 122nd Audio Engineering Society Convention (AES’07), Vienna, Austria, May 2007. [9] A. Primavera, L. Palestini, S. Cecchi, F. Piazza, and M. Moschetti, “A Hybrid Approach for Real-Time Room Acoustic Response Simulation,” in Proc. 128th Audio Engineering Society Convention (AES’10), London, UK, May 2010. [10] G. Ramos and J.J. Lopez, “Filter Design Method for Loudspeaker Equalization Based on IIR Parametric Filters,” J. Audio Eng. Soc., vol. 54, no. 12, pp. 1162–1178, Dec. 2006. [11] S. Heise, M. Hlatky, and J. Loviscach, “Automatic Adjustment of Off-the-Shelf Reverberation Effects,” in Proc. 126th Audio Engineering Society Convention (AES’09), Munich, Germany, May 2009. [12] S. Davis and P. Mermelstein, “Comparison of parametric representations for monosyllabic word recognition in continuously spoken sentences,” IEEE Trans. Audio, Speech and Lang. Process., vol. 28, no. 4, pp. 357 – 366, aug. 1980. [13] Spall J.C., “Implementation of the simultaneous perturbation algorithm for stochastic optimization,” IEEE Trans. Audio, Speech and Lang. Process., vol. 34, pp. 817 – 823, 1998. [14] W. G. Gardner, “Efficient Convolution without Input-Output Delay,” J. Audio Eng. Soc., vol. 43, no. 3, pp. 127–136, Mar. 1995. [15] J. Lopez and G. Ramos, “Low Order IIR Parametric Loudspeaker Equalization, A Psychoacoustic Approach,” in Proc. 118th Audio Engineering Society Convention (AES’05), Barcelona,Spain, May 2005. [16] ITU-R BS. 1534, “Method for subjective listening tests of intermediate audio quality,” 2001.
(a)
(b)
Figure 8: EDR: (a) Real impulse response, (b) approximated impulse response with N = 20, Na = 4, Nl = 8, Nap = 4.
tests, the listeners did not find significant differences between the approximated IR and the real one, since all the scores are contained between 85 and 95, i.e., Good and Excellent intervals. Furthermore, increasing the number N of SOSs, the mean score increases too; this is due to the fact that the real IR is better approximated. However, good results can be achieved also considering less sections, with a clear computational advantage. 4. CONCLUSION A novel approach for the approximation and simulation of a real impulse response has been presented. After a preliminary analysis of the mixing time, the impulse response is decomposed in the time domain considering the early and late reflections. The early reflections approximation is achieved taking into consideration an IIR structure composed of a cascade of second-order sections, employing a frequency domain parametric optimization process and four all-pass filters to better approximate the phase response of the real IR, using a minimization criterion. Then, the late reflections approximation is based on a recursive structure composed of comb and all-pass filters, exploiting a minimization criterion in the cep-
Figure 9: Listening tests: mean score obtained over each test.
698