This is an open access article published under an ACS AuthorChoice License, which permits copying and redistribution of the article or any adaptations for non-commercial purposes.
Article Cite This: ACS Omega 2017, 2, 6809-6818
http://pubs.acs.org/journal/acsodf
Aptasensor Based on Hierarchical Core−Shell Nanocomposites of Zirconium Hexacyanoferrate Nanoparticles and Mesoporous mFe3O4@mC: Electrochemical Quantitation of Epithelial Tumor Marker Mucin‑1 Minghua Wang, Bin Hu, Hongfei Ji, Yingpan Song, Jiameng Liu, Donglai Peng, Linghao He, and Zhihong Zhang* Henan Provincial Key Laboratory of Surface and Interface Science, Zhengzhou University of Light Industry, No. 136, Science Avenue, Zhengzhou, Henan 450001, P. R. China S Supporting Information *
ABSTRACT: A novel nanostructured hierarchical core−shell nanocomposite of zirconium hexacyanoferrate (ZrHCF) and a mesoporous nanomaterial composed of Fe3O4 and carbon nanospheres (denoted as ZrHCF@mFe3O4@mC) was prepared and used as a novel platform for an aptasensor to detect the epithelial tumor marker mucin-1 (MUC1) sensitively and selectively. The prepared ZrHCF@mFe3O4@mC nanocomposite exhibited good chemical functionality, water stability, and high specific surface area. Therefore, large amounts of aptamer molecules resulted in high sensitivity of the developed electrochemical aptasensor toward traces of MUC1. The constructed sensor also showed a good linear relationship with the logarithm of MUC1 concentration in the broad range of 0.01 ng·mL−1 to 1.0 μg· mL−1, with a low detection limit of 0.90 pg·mL−1. The fabricated ZrHCF@ mFe3O4@mC-based aptasensor exhibited not only high selectivity because of the formation of aptamer−MUC1 complex but also good stability, acceptable reproducibility, and applicability. The proposed novel strategy based on a newly prepared hierarchical core−shell nanocomposite demonstrated outstanding biosensing performance and presents potential applications in biomedical fields.
■
immunosorbent assay (ELISA)9 and surface plasmon resonance spectroscopy.10 For example, Wu et al. applied surfaceenhanced Raman scattering spectroscopy to “trap” human breast cancer cells using anti-MUC1 aptamer−Au/Ag nanoconjugates.11 Several electrochemical aptasensors have also been proposed for the detection of specific cancer antigens, such as carcinoembryonic antigen (CEA) and vascular endothelial growth factor.12,13 Among the many approaches, electrochemical methods are the most suitable method for the development of aptasensors because of their fast response, high sensitivity, and low cost; in addition, results can be obtained in real time. Various signal amplification strategies have been introduced to develop highly sensitive electrochemical sensors. In particular, different nanomaterials, such as metal nanoparticles (NPs), quantum dots, magnetic NPs, carbon-based nanomaterials, and polymeric NPs, have been used as electrode materials to construct sensing platforms and carriers to increase the electrochemical response.14,15 Metal oxides with a core− shell nanostructure have elicited much attention because they
INTRODUCTION Mucin-1 (MUC1) is a heavily glycosylated protein that protects the epithelial tissue in healthy bodies; it is bound to cells by an integral transmembrane domain through the formation of a gel matrix. MUC1 contains a hydrophobic membrane-spanning domain with 31 amino acids, a cytoplasmic domain with 69 amino acids, and an extracellular domain consisting of a region of nearly identical repeats with 20 amino acids per repeat.1 MUC1 expressed over the normal level is a well-known tumor marker existing in various malignant tumors, such as breast, stomach, lung, prostate, and colorectal.2 Therefore, advanced novel analytical techniques must be developed to monitor the level of MUC1 in patient samples routinely. Aptamers are synthetic nucleic acid sequences obtained through an in vitro procedure called systematic evolution of ligands by exponential enrichment.3 Aptamers exhibit several advantages, such as conformational change in analyte binding and high specificity for a single target analyte, including drugs, proteins, carbohydrates, lipids, and other organic or inorganic molecules.4 Aptamer-based biosensors do not involve the use of animals and demonstrate improved stability and specificity in various types of assays, such as electrochemical,5 fluorescence,6 chemiluminescence,7 and colorimetric.8 Aptamer−MUC1 binding has been tested through competition enzyme-linked © 2017 American Chemical Society
Received: July 25, 2017 Accepted: September 19, 2017 Published: October 17, 2017 6809
DOI: 10.1021/acsomega.7b01065 ACS Omega 2017, 2, 6809−6818
ACS Omega
Article
can provide many opportunities for the development of new composite materials. Large surface area, the presence of pores, and wide-open geometry present significant advantages in the synthesis of metal oxides.16 As a typical nanomaterial, Fe3O4 NPs with high chemical stability, biocompatibility, and low toxicity have been intensively studied not only for fundamental scientific interest but also for potential applications in biomedical fields, especially in targeted drug delivery.17,18 However, the traditional Fe3O4 NPs always require complicated surface modification to form groups that can connect with the aptamer strands. Furthermore, they usually exhibit low DNAanchoring capability because of their relatively low surface area. To solve these problems, porous hollow Fe3O4 NPs have been developed as sensitive materials for DNA sensors to provide a potential space for DNA immobilization. To improve the suspension stability of the Fe3O4 NPs further, amorphous carbon layers are often coated on the surface of Fe3O4 NPs to form Fe3O4@C nanocapsules with good aqueous dispersity. As a Zr-based nanomaterial, zirconium hexacyanoferrate ({Zr[Fe(CN)6]}n, denoted as ZrHCF) has elicited much interest because of its ionic conductivity, redox properties, and high affinity for oxygen atoms.19 ZrHCF is often used as a modifier in the construction of modified electrodes. The unique coordination of phosphate groups in Zr(IV) results in related nanomaterials, such as ZrO2 and ZrHCFs, which can be used to immobilize DNA strands and selectively enrich phosphopeptides as sensitive materials for biosensing.20 For instance, magnetic ZrHCF NPs consisting of magnetic beads exhibit remarkable electrocatalytic properties in the reduction of H2O2 and are used as the signal nanoprobe for the ultrasensitive electrochemical DNA array.19 The immobilization system of oligodesoxynucleotides has been successfully developed and proven on ZrO2 NPs.21 Moreover, the electrospun ZrO2 nanofibers can serve as a versatile tool for protein analysis.22 However, no report has examined the combination of ZrHCF and Fe3O4 nanospheres and its related application in biosensing. With this consideration, a hollow core−shell nanostructured composite of ZrHCF and hollow mFe3O4@mC (denoted as ZrHCF@mFe3O4@mC) was designed and synthesized in this study. The designed composite possesses an inner cavity and an orderly mesoporous opening structure. Subsequently, the asprepared ZrHCF@mFe3O4@mC composite was employed as the aptasensor platform to detect MUC1 sensitively. As illustrated in Scheme 1, the entire fabrication procedure of the aptasensor based on the ZrHCF@mFe3O4@mC composite involved three steps: (i) preparation of the ZrHCF@mFe3O4@ mC composite, (ii) immobilization of the aptamer strands, and (iii) detection of MUC1 through the biorecognition interaction between the aptamer strands and MUC1. The core−shell nanostructured ZrHCF@mFe3O4@mC composite was prepared using the hydrothermal method and by using zirconyl chloride (ZrOCl2) as the precursor and dopamine hydrochloride as the organic ligand in the presence of hollow mFe3O4@mC nanocapsules, which were obtained after the calcination of hollow Fe3O4@C nanospheres. The hollow Fe3O4@C nanospheres were synthesized by removing the SiO2 core from the core−shell SiO2@Fe3O4@C spheres. Therefore, the core−shell ZrHCF@mFe3O4@mC nanocomposite possessed an extremely large specific surface area and good dispersity. Additionally, the intensive binding of Zr−O−P between ZrHCF and the aptamer strands20 induced high immobilization force in the aptamer strands. Therefore, the
Scheme 1. Schematic of the Preparation of Hollow ZrHCF@ mFe3O4@mC and Its Related Aptasensor for Detecting MUC1a
a
(i) Preparation of the ZrHCF@mFe3O4@mC Nanocomposite, (ii) Immobilization of Aptamer, and (iii) Detection of MUC1
developed strategy can be used to detect traces of analytes, such as MUC1, in human serum.
■
RESULTS AND DISCUSSION Sensor Design. For comparison, three nanomaterials, such as mFe3O4@mC, ZrHCF, and ZrHCF@mFe3O4@mC, were used as the platform for aptamer immobilization and MUC1 detection. Label-free aptamer strands, 5′-(CH2)6-ACA CGG CAG TTG ATC CTT TGG ATA CCC TGG CGT GT-3′, were designed based on a hairpin with 25 complementary bases in the loop structure to catch the targeted protein, MUC1.23,24 Prior to use, all MUC1 aptamers were heated and then allowed to cool to form hairpin oligonucleotide. In the absence of target MUC1, the immobilized hairpin aptamer was in a “closed” state. When introducing MUC1, the hairpin oligonucleotide was disrupted and the aptamer preferred to form the aptamer− MUC1 complex, which resulted in the electrochemical signal change.25 Because of the large protein MUC1 bringing a steric hindrance effect on the electrode, it was expected that electrochemical impedance spectroscopy (EIS) of the electrochemical aptasensor would increase.26 Considering the high bioaffinity of ZrHCF and adsorption ability of ZrHCF@ mFe3O4@mC, the ZrHCF@mFe3O4@mC nanocompositebased electrochemical biosensor is expected to demonstrate higher sensitivity toward MUC1 detection in aqueous solutions than the individual mFe3O4@mC- and ZrHCF-based ones. Chemical Structure and Components. The elemental composition and chemical status of mFe3O4@mC, ZrHCF, and ZrHCF@mFe3O4@mC nanocomposites were investigated through X-ray photoelectron spectroscopy (XPS), and the element atomic percentage is summarized in Table S1 in the Supporting Information. The XPS survey spectra of the three samples are shown in Figure S1, in which Fe 2p, C 1s, O 1s, and N 1s were observed, as well as the presence of Zr 3d (2.85%) in the ZrHCF@mFe3O4@mC nanocomposite (curve c, Figure S1). The C 1s peak was due to amorphous carbon, and Fe 2p and O 1s were derived from Fe3O4 NPs. The Zr 3d 6810
DOI: 10.1021/acsomega.7b01065 ACS Omega 2017, 2, 6809−6818
ACS Omega
Article
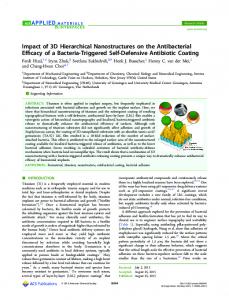
Figure 1. (a1) C 1s, (a2) N 1s, and (a3) Fe 2p core-level XPS spectra of mFe3O4@mC. (b1) C 1s, (b2) N 1s, and (b3) Zr 3d core-level XPS spectra of ZrHCF. (c1) C 1s, (c2) N 1s, and (c3) Zr 3d core-level XPS spectra of ZrHCF@mFe3O4@mC.
functionalization of mFe3O4@mC, whereas the peaks at 531.0 and 529.6 eV were assigned to Fe−O−C and Fe−O groups, respectively,29 which are due to the presence of the Fe3O4 nanospheres. Simultaneously, the peak at 534.6 eV was mainly due to the presence of CO contained in the oxidation state of dopamine, which are formed in the preparation process of ZrHCF.30 With regard to the Fe 2p core-level XPS spectra (Figures 1a3 and S2b), the peaks at binding energies of 712.1 and 724.8 eV were characteristic of Fe3+, whereas the peaks at 709.8 and 722.8 eV were due to Fe2+.31 Additionally, the satellite signal at 717.6 eV was due to the combination of Fe2+ and Fe3+.32 The presence of Fe2+ and Fe3+ in the samples further confirmed the formation of Fe3O4. Substantial Zr 3d peaks appeared in the sample of ZrHCF and ZrHCF@ mFe3O4@mC composite and were fitted into two components (184.2 and 181.8 eV), which were due to the Zr 3d3/2 and Zr 3d5/2 core levels, respectively (Figure 1b3,c3).33,34 All of these results imply the combination of ZrHCF and hollow mFe3O4@ mC nanocapsules. Crystallization of the Samples. To reveal the crystal phase in the nanocomposites, X-ray diffraction (XRD) experiments were performed on as-synthesized mFe3O4@mC, ZrHCF, and ZrHCF@mFe3O4@mC (Figure S3b). The presence of intense peaks corresponding to the (220), (311), (400), (511), and (440) Bragg reflections of Fe3O4 is in agreement with those reported for Fe3O4 nanospheres (JCPDS file 19-0629, magnetite) (Figure S3a).35 This result shows that Fe3O4 was formed. The peak at 19° was attributed to the
peak observed in the ZrHCF@mFe3O4@mC nanocomposite confirmed the composite of ZrHCF with mFe3O4@mC. The densities of the C 1s peak were 57.24, 40.05, and 39.67%, whereas those of the N 1s peak were 3.22, 17.15, and 7.85% for the samples of mFe3O4@mC, ZrHCF, and ZrHCF@mFe3O4@ mC, respectively. When combined with ZrHCF NPs, the high content of N 1s (7.85%) resulted from the hexacyanoferrate group. To evaluate the chemical environment of each element, the core-level XPS spectra of C 1s, N 1s, Fe 2p, and Zr 3d in the three samples were fitted and are summarized in Figure 1. For the C 1s core-level XPS spectra (Figure 1a1,b1,c1), four components, namely, 284.6, 285.7, 286.4, and 287.6 eV, were fitted out; these components resulted from C−C/C−H, C−N, C−O, and CO/N−CO, respectively.27 The appearance of the C−O and CO/N−CO groups revealed that the Fe3O4@C nanospheres were only partly calcined in an N2 atmosphere. With regard to the mFe3O4@mC nanocapsules, the N 1s core-level spectrum was deconvoluted into two peaks of 399.5 and 401.5 eV, which are attributed to C−N/N−H and N−CO groups, respectively (Figure 1a2). In the case of ZrHCF and ZrHCF@mFe3O4@mC, however, an additional main peak was observed at 397.6 eV together with the peaks at 399.5 and 401.5 eV (Figure 1b2,c2). Obviously, this peak is assigned to the functional group of −N,28 which was contained in ZrHCF. As for the O 1s core-level XPS spectrum of ZrHCF@mFe3O4@mC (Figure S2a), the main peaks at 532.5 eV was contributed to C−O, which originated from the layer of γ-aminopropyltriethoxysilane used for the amino6811
DOI: 10.1021/acsomega.7b01065 ACS Omega 2017, 2, 6809−6818
ACS Omega
Article
characteristic peak of amorphous carbon. With regard to ZrHCF@mFe3O4@mC, aside from the characteristic peaks of Fe3O4 and amorphous carbon, an additional peak at 8.4° was observed and ascribed to the element Zr; it is consistent with that of the phase pure UiO-66.36 The XRD results revealed the presence of mFe3O4@mC and ZrHCF in the nanocomposite. Surface Morphology of mFe3O4@mC, ZrHCF, and ZrHCF@mFe3O4@mC. The morphologies of the as-prepared mFe3O4@mC, ZrHCF, and ZrHCF@mFe3O4@mC NPs were investigated with a field emission scanning electron microscope (FESEM) and a transmission electron microscope (TEM), as shown in Figures S5 and 2. The surface morphologies of SiO2,
reacted with Zr(IV), forming the ZrHCF@mFe3O4@mC nanocomposite. In addition, the mesoporous carbon with high surface area and adsorption capacity can enhance the immobilization capability for dopamine molecules, which can further promote the formation of ZrHCF NPs on the surface of mFe3O4@mC. Figure S5e,f shows that the obtained ultimate product ZrHCF@mFe3O4@mC nanocomposite has a rougher surface than that of mFe3O4@mC, which is in accordance with the TEM image in Figure 2. The TEM image shows that the hollow mFe3O4@mC spheres were nearly monodisperse in size with an average diameter of 352 nm (Figure S5g,h). The surface of the hollow nanospheres was rough in texture, which revealed a disordered assembly of particles. The hollow interior of the particles was confirmed through TEM characterization, which also detected a strong contrast between the dark edges and the pale central region (Figure 2a,b). As shown in Figure 2c,d, the morphology of the ZrHCF@mFe3O4@mC nanocomposite was similar to that of mFe3O4@mC. However, the surface of the former was much rougher than that of the latter. This difference could have been caused by the deposition of ZrHCF NPs onto mFe3O4@mC NPs irregularly, which also helped increase the surface area of the nanocomposite and enhance the immobilization of the aptamer. The highresolution TEM (HR-TEM) image in Figure 2e confirms the 0.253 nm fringe spacing, which corresponds to the (311) interplanar spacing of the mFe3O4 phase.37 The corresponding diffraction rings of (311), (400), (422), (511), and (440) in the selected area electron diffraction (SAED) patterns (Figure 2f) confirmed the formation of mFe3O4, indicating the nanocrystalline nature of the ZrHCF@mFe3O4@mC nanocomposite. Electrochemical Biosensing Performance of the Three Samples. In the present work, mFe3O4@mC, ZrHCF, and ZrHCF@mFe3O4@mC composites were applied as scaffold substrates for aptamer immobilization to evaluate the efficiency in detecting MUC1. The assembly steps of MUC1/Apt/ mFe3O4@mC/Au, MUC1/Apt/ZrHCF/Au, and MUC1/Apt/ ZrHCF@mFe3O4@mC/Au were characterized by cyclic voltammetry (CV) (Figures S6 and S7) and EIS (Figure 3). As shown in Figure S6, the well-defined redox peaks of [Fe(CN)6]3−/4− were observed in the bare Au electrode (curve i, Figure S6). When the Au electrode was separately modified with mFe3O4@mC, ZrHCF, and ZrHCF@mFe3O4@mC (curve ii, Figure S6), the related redox peak current decreased markedly. This result indicates that mFe3O4@mC, ZrHCF, and ZrHCF@mFe3O4@mC can significantly reduce the electron transfer that resulted from the relatively low electrochemical activity. After the immobilization of aptamer strands on mFe3O4@mC/Au, ZrHCF/Au, or ZrHCF@mFe3O4@mC/Au (curve iii, Figure S6), the peak currents further decreased probably because the negatively charged aptamer strands increased the repelling force of the electrode toward the [Fe(CN)6]3−/4− redox probe.38 After incubation with the MUC1 solution, a slight decrease in the peak current was observed (curve iv, Figure S6). This result may be caused by MUC1 blocking, which was biorecognized by the aptamer strands via a conformation change to form the aptamer−MUC1 complex between the aptamer strands and MUC1.39,40 These results demonstrate that MUC1 can be determined by the developed electrochemical aptasensors based on mFe3O4@mC, ZrHCF, and ZrHCF@mFe3O4@mC. To evaluate the intrinsic electrochemical behaviors of the electrochemical aptasensors based on mFe3O4@mC, ZrHCF, and ZrHCF@mFe3O4@mC,
Figure 2. TEM images of (a,b) mFe3O4@mC and (c,d) ZrHCF@ mFe3O4@mC nanocomposite; (e) HR-TEM image; and (f) SAED pattern of ZrHCF@mFe3O4@mC.
SiO2@Fe3O4@C, and hollow Fe3O4@C nanospheres are summarized in Figure S4. The FESEM images indicate that SiO2 and SiO2@Fe3O4@C were uniformly distributed with the particle sizes of 345.8 and 363 nm, respectively. The obtained SiO2@Fe3O4@C nanospheres had a rough surface and were embedded with small NPs. After removing the SiO2 nanospheres, the hollow nanostructure was observed, whereas some of the hollow nanospheres were crushed. As for the ZrHCF@ mFe3O4@mC nanocomposite, an even rougher surface was obtained due to the combination of ZrHCF NPs, with a small size of 40−60 nm. In the process of ZrHCF@mFe3O4@mC nanocomposite formation, the negatively charged ferricyanide ion [Fe(CN)6]3− was electrostatically adsorbed on the surface of mFe3O4@mC, which was modified by the protonation of amines on the surface. Then, [Fe(CN)6]3− was reduced in the presence of dopamine, and the resulting product [Fe(CN)6]4− 6812
DOI: 10.1021/acsomega.7b01065 ACS Omega 2017, 2, 6809−6818
ACS Omega
Article
Figure 3. EIS diagrams of the electrochemical aptasensors based on (a) mFe3O4@mC-, (b) ZrHCF-, and (c) ZrHCF@mFe3O4@mC-modified Au electrodes and the modified electrodes after reaction with 0.01 ng·mL−1 MUC1 in 0.1 M PBS (pH 7.4) containing 5 mM [Fe(CN)6]3−/4−, 0.14 M NaCl, and 0.1 M KCl (the inset in (a) is the equivalent circuit of the Nyquist plot). (d) ΔRct values of each step during MUC1 detection using the fabricated aptasensors based on mFe3O4@mC, ZrHCF, and ZrHCF@mFe3O4@mC (n = 3).
hollow mFe3O4@mC nanocapsules. All of these conditions are favorable to aptamer strand immobilization and helpful for the detection of analytes. The Rct values of the modified electrodes obviously increased to 1.68, 1.60, and 1.68 kΩ when the aptamer strands were immobilized on mFe3O4@mC/Au, ZrHCF/Au, and ZrHCF@mFe3O4@mC/Au, respectively. The repelling interaction between the negatively charged aptamer molecules and [Fe(CN)6]3−/4− redox resulted in a high barrier for interfacial electron transfer, thus confirming that the aptamer was successfully anchored on the surface of the composite electrodes.19 Meanwhile, the film of mFe3O4@ mC, ZrHCF, and ZrHCF@mFe3O4@mC adsorbed with the aptamer strands wrapped MUC1 and further prevented the electron from exchanging between the redox probe and the electrode, thus leading to increased Rct values of 1.80, 1.67, and 2.16 kΩ for MUC1/Apt/mFe3O4@mC/Au, MUC1/Apt/ ZrHCF/Au, and MUC1/Apt/ZrHCF@mFe3O4@mC/Au, respectively. In principle, the variation in the Rct (ΔRct) value can represent the binding amount of the blocking layer,43 indicating that a high amount results in a high ΔRct value. Hence, to compare the detection efficiency of the different developed strategies, the ΔRct values were calculated from each step in the process of MUC1 detection (Figure 3d). For the modification step of the bare Au electrode with mFe3O4@mC, ZrHCF, and ZrHCF@mFe3O4@mC, the resulting ΔRct values were 1.42, 1.23, and 1.35 kΩ, respectively, suggesting the relatively good electrochemical activity of the ZrHCF NPs. After the immobilization of the aptamer strands, the ΔRct values of mFe3O4@mC/Au, ZrHCF/Au, and ZrHCF@mFe3O4@mC/ Au were 0.144, 0.195, and 0.272 kΩ, respectively. This result implies that more aptamer strands were anchored on ZrHCF@ mFe3O4@mC/Au, subsequently leading to the highest ΔRct value of 0.482 kΩ when detecting MUC1 because large
CV measurements were determined in 0.1 M phosphate buffer solution (PBS, pH 7.4, containing 0.14 M NaCl and 0.1 M KCl) in the absence of [Fe(CN)6]3−/4− redox probe (Figure S7). In the range of −0.2 to +0.8 V at a scan rate of 50 mV·s−1, all CV curves of three kinds of aptasensors did not show any redox peak, suggesting that all three electrode materials exhibited usual electrochemical activity. Therefore, all electrochemical measurements were performed in 0.1 M PBS (pH 7.4) containing 5 mM [Fe(CN)6]3−/4−, 0.14 M NaCl, and 0.1 M KCl. Furthermore, because of the determination limitation of CV measurement, comparing these three aptasensors is difficult. Thus, corresponding EIS characterizations were also performed. Figure 3 shows the EIS diagrams for the detection of MUC1 using the developed electrochemical aptasensors based on mFe3O4@mC, ZrHCF, and ZrHCF@mFe3O4@mC in 0.1 M PBS (pH 7.4) containing 5 mM [Fe(CN)6]3−/4−, 0.14 M NaCl, and 0.1 M KCl. EIS can effectively supply impedance change information in the procedure of modifying the surface of an electrode.41 The EIS diagrams were simulated using the Randles equivalent circuit consisting of solution resistance (Rs), charge-transfer resistance (Rct), constant-phase element, and the Warburg impedance (W) (Figure 3a, inset). The Rct values of all electrodes, including the modified electrodes with three samples, the aptamer immobilization, and the MUC1 detection, are summarized in Table S2. The Rct value of mFe3O4@mC/Au is 1.54 kΩ, whereas those of ZrHCF/Au and ZrHCF@ mFe3O4@mC/Au are 1.40 and 1.41 kΩ, respectively. These values indicate that the presence of mFe3O4@mC, ZrHCF, or ZrHCF@mFe3O4@mC obstructs the electron transfer at the interface between the electrode and the electrolyte solution.42 However, the slightly small Rct value of ZrHCF@mFe3O4@ mC/Au implies that ZrHCF can not only increase the specific surface area but also promote the electrochemical activity of 6813
DOI: 10.1021/acsomega.7b01065 ACS Omega 2017, 2, 6809−6818
ACS Omega
Article
Figure 4. (a) EIS responses of Apt/ZrHCF@mFe3O4@mC/Au with different concentrations of MUC1 (0, 0.01, 0.1, 1, 10, 100, 500, and 1000 ng· mL−1) and (b) dependence of ΔRct of the modified electrode on MUC1 concentration (n = 3). The linear part of the calibration curve is shown in the inset of (b).
can also prove the presence of oligonucleotides molecules. The high-resolution spectra, which were well-fitted by using Gaussian line components, for the two samples in C 1s, N 1s, P 2p, Zr 3d, Fe 2p, and O 1s regions are shown in Figures S8 and S9. The deconvoluted C 1s XPS spectrum of ZrHCF@ mFe3O4@mC/Apt includes a peak at 284.6 eV (assigned to the C−C/C−H bonding sites), one at 285.7 eV (C−N), one at 286.4 eV (C−O), and one at 287.6 eV (CO/N−CO) (Figure S8a1). In comparison with the C 1s high-resolution spectrum of ZrHCF@mFe3O4@mC, the intensity of the C O/N−CO groups increased. However, after the detection of MUC1 using the developed aptasensor (ZrHCF@mFe3O4@ mC/Apt), a new additional peak was observed at 292.6 eV corresponding to the N−C(O)−N group together with another four peaks in C 1s (Figure S8b1), which originated from the bonding of protein molecules. The principal N 1s core-level XPS spectrum can be fitted into three parts of 397.6, 399.5, and 400.6 eV, which are assigned to −N, C−N/N−H, and N−CO groups, respectively. The intensity of the −N group contained in ZrHCF@mFe3O4@mC/Apt was reduced by the coverage of the immobilized aptamer strands (Figure S8a2). Furthermore, it disappeared from the N 1s core-level spectrum of ZrHCF@mFe3O4@mC/Apt/MUC1 because of the thick layer of the combination of the aptamer and protein molecules (Figure S8b2). The clear P 2p high-resolution spectra of the two samples are shown in Figure S8a3,b3. The Zr 3d core-level spectrum of ZrHCF@mFe3O4@mC/Apt reveals a single spin−orbit doublet with the binding energies of Zr 3d5/2 and Zr 3d3/2 core levels of 181.8 and 184.2 eV, respectively. The same peaks appeared in ZrHCF@mFe3O4@mC/Apt/ MUC1 but with a relatively low intensity (Figure S9a1,b1). As for the Fe 2p core-level XPS spectra of the two samples (Figure S9a2,b2), the same results as those of the ZrHCF@mFe3O4@ mC composite were observed. The peaks show low signal intensity because of the immobilization of the aptamer strands and the adsorption of MUC1. In the case of O 1s of ZrHCF@ mFe3O4@mC/Apt and ZrHCF@mFe3O4@mC/Apt/MUC1 (Figure S9a3,b3), an additional peak of the Zr−O−P group was appeared, which was not present in the ZrHCF@ mFe3O4@mC nanocomposite. This hints the formation of covalent bonds of the Zr−O−P group when the aptamer strands were anchored onto the nanocomposite.20 The peak at 536.1 eV was mainly due to the presence of H2O. Actually, the DNA strands can be adsorbed not only on Fe3O4 mainly via the phosphate backbone48 but also on mesoporous carbon via base interaction.49 All of these results show the successful develop-
amounts of immobilized aptamer strands can provide high sensitivity for detecting analyte molecules.44 Additionally, the coverage of aptamer on the ZrHCF@mFe3O4@mC nanocomposite was determined by using a quartz crystal microbalance (QCM). The results showed that the saturated immobilization amount of the aptamer strands was estimated to be 3.47 × 10¹³ molecules·cm−2 (see S6). Compared with the two-dimensional self-assembly sensitive layers (SAMs) for immobilizing DNA strands, the value of the surface density, 3.47 × 10¹³ molecules·cm−2, fabricated in the present work on the basis of the Sauerbrey equation is relatively higher than the values of the surface density 2.25 × 101245 and 1.4 × 10¹³ molecules·cm−2.46 As discussed in the previous work,47 when the aptamer strands were immobilized onto the threedimensional hollow nanostructure of the proposed nanocomposite of ZrHCF@mFe3O4@mC, they not only can anchor onto the surface of nanocomposite but also can penetrate into the interior of the hollow framework because of their strong affinity. As for the two-dimensional SAMs, DNA can immobilize only on their surface, leading to the relative lower surface density of DNA strands. Meanwhile, the ΔRct value caused by MUC1 detection using the developed aptasensors based on the hollow mFe3O4@mC nanocapsules was only 0.122 kΩ because of the relatively poor anchoring interaction of the aptamer strands. The presence of ZrHCF improved the detection efficiency of MUC1. All of these results demonstrate that the proposed Apt/ZrHCF@ mFe3O4@mC/Au biosensor can be employed to determine MUC1 in aqueous solutions. Therefore, it was used in the subsequent electrochemical measurements for evaluating the detection limit (LOD), selectivity, reproducibility, and so on. The surface chemical composition variation before and after the immobilization of aptamer strands as well as the detection of MUC1 was examined through XPS. The XPS survey scans of ZrHCF@mFe3O4@mC/Apt and ZrHCF@mFe3O4@mC/Apt/ MUC1 are shown in Figure S1, and the atomic percentage of each element is summarized in Table S1. The intensities of Zr 3d and Fe 2p contained in ZrHCF@mFe3O4@mC/Apt substantially decreased from 2.85 to 0.95% and from 7.02 to 1.86%, respectively and then further declined to 0.63 and 1.30% after the detection of MUC1, that is, ZrHCF@mFe3O4@mC/ Apt/MUC1. In the presence of MUC1, the aptamer−MUC1 complex formation between the protein and the aptamer strands intensified this trend, further leading to the decrease in the intensity of these two elements. Moreover, the appearance of P 2p, which originated from the anchored aptamer strands, 6814
DOI: 10.1021/acsomega.7b01065 ACS Omega 2017, 2, 6809−6818
ACS Omega
Article
Table 1. Comparisons of the Proposed Approach with Others in Terms of MUC1 Detection materials graphene oxide (GO)-based fluorescent aptasensor hairpin DNA aptamers on gold enzyme−gold NPs conducting polymer nanowire-based microfluidic aptasensor quantum dot-based fluorescence readout poly(o-phenylenediamine) carrier and functionalized carbon nanotubes GO and Rul-aptamer aptamer−antibody hybrid sandwich aptamer-functionalized gold NPs gold NPs-modified screen-printed electrodes DNA-templated silver nanoclusters TiO2NT/aptamer/c-DNA@CdTeQD aptasensor ZrHF@mFe3O4@mC
method
linear range
LOD
refs
fluorescence emission spectra square wave voltammetry (SWV) differential pulse voltammograms (DPVs) microfluidic system fluorescence spectra DPV
0.04−10 μM 0.1−3 μM 8.8−353.3 nM
28 nM 50 nM 2.2 nM
12 51 24
0.01−100 nM 0.01−104 pg·mL−1 0.001−100 nM
2.66 nM 4.5 fg·mL−1 1 pM
52 1 53
electrochemiluminescence ELISA and surface plasmon resonance EIS EIS DPV SWV photoelectrochemical EIS
64.9−1036.8 nM 8−100 μg·mL−1 0.5−10 nM 2.5−15 ng·mL−1 0−10 ng·mL−1 1−500 nM 0.002−0.2 μM 0.01−1000 ng·mL−1
40 nM 1 μg·mL−1 0.1 nM 3.6 ng·mL−1 0.95 ng·mL−1 0.5 nM 0.52 nM 0.90 pg·mL−1
13 10 25 26 54 55 this work
Figure 5. (a) Selectivity, (b) reproducibility, (c) stability, and (d) regeneration of the ZrHCF@mFe3O4@mC-based aptasensor for the detection of 0.01 ng·mL−1 MUC1 (n = 3).
observed between ΔRct and the logarithm of CMUC1 within the range of 0.01 ng·mL−1 to 1.0 μg·mL−1. The regression equation was ΔRct (kΩ) = 1.37 log CMUC1 + 3.08 (CMUC1: ng·mL−1) with a regression coefficient (R2) of 0.984. The LOD was calculated to be 0.90 pg·mL−1 based on a signal-to-noise ratio of 3.50 This LOD is lower than those of previously reported biosensors (Table 1). Selectivity and Stability of the Proposed Aptasensor. Nonspecific adsorption is a major problem during the application of aptasensors. To confirm the observed impedance changes and test the binding selectivity, control experiments were conducted in the presence interfered proteins. The proposed aptasensor was exposed to different protein solutions, such as CEA, immunoglobulin G (IgG), and bovine serum
ment of the ZrHCF@mFe3O4@mC-based aptasensor for detecting the targeted protein and suggest that it can be used in the fields of biosensing or diagnosis analysis. Sensitivity of the Developed Aptasensors Based on ZrHCF@mFe3O4@mC. The sensitivity of the developed aptasensors based on the ZrHCF@mFe3O4@mC composite was assessed by measuring the dependence of ΔRct on the concentration of MUC1 (CMUC1). Figure 4 shows the Nyquist plots of the electrochemical impedance spectra for the biosensor with different concentrations of MUC1. The relationship between ΔRct and CMUC1 is presented in Figure 4b. The ΔRct values substantially increased with increasing CMUC1 within the range of 0.01 ng·mL−1 to 1.0 μg·mL−1. As shown in the inset of Figure 4b, a linear relationship was 6815
DOI: 10.1021/acsomega.7b01065 ACS Omega 2017, 2, 6809−6818
ACS Omega
Article
Table 2. Determination of MUC1 in Human Serum by the Developed Aptasensor (n = 3) added amount (ng·mL−1)
ΔRct (kΩ)
found amount (ng·mL−1)
recovery (%)
RSD (%)
0.01 0.10 1.0 10.0 100.0
0.40 1.80 3.16 4.46 5.93
0.011 0.12 1.14 10.15 120.1
110 115 114.4 101.5 120.1
2.39 2.07 1.30 3.90 2.57
stability, biocompatibility, excellent dispersion ability, and strong bioaffinity toward aptamer strands. When used as the platform material for detecting the cancer marker protein MUC1 via the biorecognition interaction and formation of the aptamer−MUC1 complex between the aptamer strands and MUC1, the fabricated aptasensor based on the ZrHCF@ mFe3O4@mC composite showed high sensitivity to the traces of MUC1 with a LOD of 0.90 pg·mL−1 within a broad concentration range of 0.01 ng·mL−1 to 1.0 μg·mL−1. The fabricated aptasensor also demonstrated high selectivity toward other interfered proteins, as well as good stability, acceptable reproducibility, and applicability. The proposed approach provides a new strategy for the detection of MUC1 and thus shows a great potential for use in point-of-care diagnosis of genetic diseases and cancer determination.
albumin (BSA), which are important proteins in the human serum that is 100-fold in MUC1. As shown in Figure 5a, because of the adsorption ability of the porous ZrHCF@ mFe3O4@mC composite, a certain variation was observed in impedance with the determination of the interfering components. Furthermore, the selectivity of the as-prepared aptasensor was determined using the different DNA sequences for detecting MUC1. The aptasensors based on ZrHCF@ mFe3O4@mC immobilized with the AptCEA, Aptthrombin, and Aptlysozyme sequences were used for detecting MUC1 (10 ng· mL−1) separately (Figure S11 and Table S3). These variations can be ignored in comparison with the variation in Rct caused by the presence of MUC1 based on the AptMUC1/ZrHCF@ mFe3O4@mC/Au aptasensor. The results of two measurements showed that very low electrochemical signal change was observed, indicating that there is very weak nonspecific adsorption between the interferences. This suggests that the developed EIS aptasensor based on the ZrHCF@mFe3O4@mC composite has good selectivity. The reproducibility of the ZrHCF@mFe3O4@mC-based electrochemical aptasensor was evaluated by determining the ΔRct value of the same MUC1 concentration (0.01 ng·mL−1) at five different Au electrodes (Figure 5b). The interassay relative standard deviation (RSD) of the five aptasensors was 3.28%, showing acceptable reproducibility. As for the estimation of stability, the fabricated aptasensor was stored in PBS (10 mM, pH 7.4) at 4 °C for 15 days (Figure 5c). Approximately 96% (RSD = 2.32%) of the initial signal was reserved, indicating the high stability of the proposed system. The developed aptasensor was regenerated by incubating 5 mM NaOH solution for 30 min and then washed carefully with PBS. The procedure was repeated five times continuously (Figure 5d). It is clear that the response signal to the same concentration of MUC1 can be recovered. Real Samples. To investigate the proposed biosensing system’s practicality, MUC1 in human serum was detected with the prepared aptasensor of Apt/ZrHCF@mFe3O4@mC/Au. Human serum was purchased from Beijing Solarbio Science & Technology Co., Ltd. The human serum samples were spiked with different amounts of MUC1 and diluted 100-times with 0.1 M PBS solution (pH 7.4). Then, the concentrations of MUC1 were assayed by using Apt/ZrHCF@mFe3O4@mC/Au according to the proposed method, as shown in Table 2. The measured results showed that Apt/ZrHCF@mFe3O4@mC/Au can detect MUC1 with good average recoveries within the range of 101.5−120.1% for five measurements, suggesting that the proposed aptasensor based on ZrHCF@mFe3O4@mC exhibits high accuracy and reproducibility. Therefore, the developed novel strategy can be applied in the analysis of real samples.
■
EXPERIMENTAL SECTION Reagents and Materials. Potassium hexacyanoferrate(III) [K3Fe(CN)6] and ZrOCl2·8H2O were supplied by Sinopharm Group Chemical Reagent Co., Ltd. Dopamine was purchased from Aladdin Technology Co., Ltd. (China). Hydrogen peroxide (H2O2, 30 wt %), sulfuric acid (H2SO4, 98 wt %), acetone (C3H6O, 99%), tetraethyl orthosilicate (98%), and ammonia water (NH3·H2O, 25 wt %) were purchased from Tianjin Fengchuan Reagent Co. Ltd. (Tianjin, China) and were of analytical grade. All chemicals were used as received without further purification. Aqueous solutions were prepared with Milli-Q water (18.2 MΩ·cm) obtained from a Millipore system. MUC1, CEA, IgG, BSA, and the aptamers were obtained from Solarbio Life Sciences Co. Ltd. (Beijing, China). The sequence of the MUC1 aptamer strand is 5′-(CH2)6-ACA CGG CAG TTG ATC CTT TGG ATA CCC TGG CGT GT3′ and label-free.24 CEA-targeted aptamer sequence (AptCEA): 5′-SH-CCA CGA TAC CAG CTT ATT CAA TTC GTG G3′; thrombin-targeted aptamer sequence (Aptthrombin): 5′-TCT CTC AGT CCG TGG TAG GGC AGG GTT GGG GTG ACT-3′; and lysozyme-targeted aptamer sequence (Aptlysozyme): 5′-NH2-ATC AGG GCT AAA GAG TGC AGA GTT ACT TAG-3′. PBS (0.1 M, pH 7.4) was prepared by mixing Na2HPO4 and NaH2PO4. The electrolyte solution was prepared immediately before use by dissolving 1.650 g of K3Fe(CN)6 and 2.111 g of K4Fe(CN)6 in 1.0 L of PBS. Aptamer solution (200 nM) and different concentrations of MUC1 (i.e., 0.01, 0.1, 1, 10, 100, 500, and 1000 ng·mL−1) solutions were prepared in 0.1 M PBS (pH 7.4). All solutions were immediately prepared before each experiment and stored at 4 °C until use. Synthesis of Hollow mFe3O4@mC Nanocapsules. Monodispersed SiO2 nanospheres (approximately 345.8 nm) were obtained using the Stober method.56 SiO2@Fe3O4@C nanospheres were synthesized according to a reported method.57 Subsequently, the SiO2 nanospheres were removed from the SiO2@Fe3O4@C nanospheres by adding 50 mL of NaOH solution at 55 °C for 5 h. The resultant products were
■
CONCLUSIONS Our group synthesized a novel nanostructured ZrHCF@ mFe3O4@mC composite, which demonstrated good water 6816
DOI: 10.1021/acsomega.7b01065 ACS Omega 2017, 2, 6809−6818
ACS Omega
Article
100 kHz with an alternating current amplitude of 5 mV. The EIS spectra were analyzed with ZView software (version 2) obtained from Scribner Associates Incorporated. The software uses nonlinear least-squares fit to determine the parameters of the elements in the equivalent circuit. Three parallel experiments were carried out for each measurement, and their average values were applied in the present work. Error bars represent standard deviations of measurements taken from three independent experiments.
centrifuged at a speed of 6000 rpm for 10 min to prepare the pure product and separately washed with Milli-Q water and ethanol three times. The resulting solid was calcined in nitrogen for 2 h at 500 °C to obtain hollow mFe3O4@mC nanocapsules. Then, 30.0 mg of mFe3O4@mC and 0.5 mL of γ-aminopropyltriethoxysilane were dispersed in 40.0 mL of acetone. The mixture was mechanically stirred at 60 °C for 12 h. Finally, the amino-functionalized hollow amino-mFe3O4@mC nanocapsules were obtained. Synthesis of the Core−Shell ZrHCF@mFe3O4@mC Nanocomposite. ZrHCF was prepared according to the procedure described by Dong et al.58 Briefly, 20 mL of HCl (0.03 mol·L−1) was pipetted into a 100 mL calibrated flask. Then, 40 mL of dopamine hydrochloride solution (pH 8.4), 40 mL of K3Fe(CN)6 solution (2.0 g·L−1), and 36 mL of ZrOCl2 solution (2.0 g·L−1) were added in succession under vigorous stirring for 1 h. The mixture changed gradually from light yellow to dark red and finally to dark black. The precipitate was washed separately with Milli-Q water and ethanol three times and dried in a vacuum oven at 60 °C. ZrHCF NPs were obtained, which were stored at 4 °C before use. Furthermore, the ZrHCF@mFe3O4@mC nanocomposite was synthesized by adding as-prepared hollow amino-mFe3O4@mC nanocapsules (0.1 g) during the preparation of ZrHCF. Construction of the Aptasensors. A bare gold electrode (diameter of 3 mm) was polished with 1.0 and 0.3 μm of alumina powder, ultrasonically washed in water for 5 min, and dried under high-purity N2 stream. To compare the biosensing efficiency of different strategies, the mFe3O4@mC nanocapsules, ZrHCF NPs, and ZrHCF@mFe3O4@mC nanocomposites were dispersed in fresh Milli-Q water to prepare homogeneous dispersions with a concentration of 1.0 mg·mL−1. Afterward, the prepared dispersions (10 μL) were deposited on the surface of pretreated Au electrodes and dried in N2 stream. Subsequently, the modified Au electrodes with mFe3O4@mC nanocapsules, ZrHCF NPs, and ZrHCF@mFe3O4@mC nanocomposites were incubated with an aptamer solution separately; they are denoted as Apt/mFe3O4@mC/Au, Apt/ZrHCF/Au, and Apt/ZrHCF@mFe3O4@mC/Au, respectively. Subsequently, three types of modified Au electrodes anchored with the aptamer strands were sufficiently rinsed with PBS and dried over a gentle stream of N2, through which the developed aptasensors were accomplished and used for the subsequent measurements. The developed aptasensors were stored at 4 °C in a refrigerator when not in use. Characterizations. XPS was conducted with a Thermo Fisher ESCALAB 250Xi spectrometer equipped with an Al anode (Al Kα 1486.6 eV). XRD patterns were recorded on a D8 ADVANCE Bruker diffractometer with Cu Kα radiation. The surface morphology of the samples was conducted with a scanning electron microscope (SEM, JEOL, JSM-6490LV) and a TEM (JEOL, JEM-2100F). Electrochemical Measurements. All electrochemical measurements were performed on a CHI660D electrochemical workstation (Shanghai CH Instruments Co., China) with a conventional three-electrode system, which consists of a modified Au working electrode, a KCl-saturated Ag/AgCl reference electrode, and a platinum auxiliary electrode. The measurements were performed in 0.1 M PBS (pH 7.4) containing 5 mM K3Fe(CN)6/K4Fe(CN)6 (1:1), 0.14 M NaCl, and 0.1 M KCl. CV curves were recorded between −0.2 and +0.8 V versus Ag/AgCl at a scan rate of 50 mV·s−1. EIS plots were obtained in the frequency range of 0.01 Hz to
■
ASSOCIATED CONTENT
S Supporting Information *
The Supporting Information is available free of charge on the ACS Publications website at DOI: 10.1021/acsomega.7b01065. XPS spectra, XRD patterns, and SEM and TEM images of the samples; electrochemical measurements of the different steps in the fabrication of the aptasensor; chemical components and structure of the developed aptasensor; QCM measurement; selectivity of the developed aptasensor based on the ZrHCF@mFe3O4@ mC nanocomposite (PDF)
■
AUTHOR INFORMATION
Corresponding Author
*E-mail:
[email protected] (Z.Z.). ORCID
Zhihong Zhang: 0000-0002-5888-4107 Author Contributions
The manuscript was written through contributions of all authors. All authors have given approval to the final version of the manuscript. Notes
The authors declare no competing financial interest.
■
ACKNOWLEDGMENTS This work was supported by programs for the National Natural Science Foundation of China (NSFC: account nos. U1604127 and 21601161) and Innovative Technology Team of Henan Province (CXTD2014042).
■
REFERENCES
(1) Cheng, A. K. H.; Su, H.; Wang, Y. A.; Yu, H.-Z. Anal. Chem. 2009, 81, 6130−6139. (2) Wang, J.; Zhang, S.; Ni, W.; Zhai, X.; Xie, F.; Yuan, H.; Gao, S.; Tai, G. Cancer Biomarkers 2017, 17, 369−376. (3) Fang, X.; Tan, W. Acc. Chem. Res. 2010, 43, 48−57. (4) Tombelli, S.; Minunni, M.; Mascini, M. Biosens. Bioelectron. 2005, 20, 2424−2434. (5) Hansen, J. A.; Wang, J.; Kawde, A.-N.; Xiang, Y.; Gothelf, K. V.; Collins, G. J. Am. Chem. Soc. 2006, 128, 2228−2229. (6) Qiu, Z.; Shu, J.; Tang, D. Anal. Chem. 2017, 89, 5152−5160. (7) Freeman, R.; Liu, X.; Willner, I. J. Am. Chem. Soc. 2011, 133, 11597−11604. (8) Liu, J.; Lu, Y. Angew. Chem. 2006, 118, 96−100. (9) Ferreira, C. S. M.; Matthews, C. S.; Missailidis, S. Tumor Biol. 2006, 27, 289−301. (10) Ferreira, C. S. M.; Papamichael, K.; Guilbault, G.; Schwarzacher, T.; Gariepy, J.; Missailidis, S. Anal. Bioanal. Chem. 2008, 390, 1039− 1050. (11) Wu, P.; Gao, Y.; Zhang, H.; Cai, C. Anal. Chem. 2012, 84, 7692−7699. (12) He, Y.; Lin, Y.; Tang, H.; Pang, D. Nanoscale 2012, 4, 2054− 2059.
6817
DOI: 10.1021/acsomega.7b01065 ACS Omega 2017, 2, 6809−6818
ACS Omega
Article
(13) Wei, W.; Li, D. F.; Pan, X. H.; Liu, S. Q. Analyst 2012, 137, 2101−2106. (14) Wu, L.; Xiong, E.; Zhang, X.; Zhang, X.; Chen, J. Nano Today 2014, 9, 197−211. (15) Lv, S.; Zhang, K.; Lin, Z.; Tang, D. Biosens. Bioelectron. 2017, 96, 317−323. (16) Zhi, M.; Xiang, C.; Li, J.; Li, M.; Wu, N. Nanoscale 2013, 5, 72− 88. (17) Cao, S.-W.; Zhu, Y.-J.; Ma, M.-Y.; Li, L.; Zhang, L. J. Phys. Chem. C 2008, 112, 1851−1856. (18) Xu, C.; Wang, B.; Sun, S. J. Am. Chem. Soc. 2009, 131, 4216− 4217. (19) Zhang, G.-Y.; Deng, S.-Y.; Cai, W.-R.; Cosnier, S.; Zhang, X.-J.; Shan, D. Anal. Chem. 2015, 87, 9093−9100. (20) Zhu, X.; Li, B.; Yang, J.; Li, Y.; Zhao, W.; Shi, J.; Gu, J. ACS Appl. Mater. Interfaces 2015, 7, 223−231. (21) Micksch, T.; Herrmann, E.; Scharnweber, D.; Schwenzer, B. Acta Biomater. 2015, 12, 290−297. (22) Wang, H.; Duan, Y.; Zhong, W. ACS Appl. Mater. Interfaces 2015, 7, 26414−26420. (23) Zhang, J.; Chen, J.; Zhang, X.; Zeng, Z.; Chen, M.; Wang, S. Electrochem. Commun. 2012, 25, 5−7. (24) Hu, R.; Wen, W.; Wang, Q.; Xiong, H.; Zhang, X.; Gu, H.; Wang, S. Biosens. Bioelectron. 2014, 53, 384−389. (25) Liu, X.; Qin, Y.; Deng, C.; Xiang, J.; Li, Y. Talanta 2015, 132, 150−154. (26) Florea, A.; Taleat, Z.; Cristea, C.; Mazloum-Ardakani, M.; Săndulescu, R. Electrochem. Commun. 2013, 33, 127−130. (27) Okpalugo, T. I. T.; Papakonstantinou, P.; Murphy, H.; McLaughlin, J.; Brown, N. M. D. Carbon 2005, 43, 153−161. (28) Bernsmann, F.; Ball, V.; Addiego, F.; Ponche, A.; Michel, M.; de Almeida Gracio, J. J.; Toniazzo, V.; Ruch, D. Langmuir 2011, 27, 2819−2825. (29) Fu, C.; Zhao, G.; Zhang, H.; Li, S. Int. J. Electrochem. Sci. 2014, 9, 46−60. (30) She, X.; Yang, D.; Jing, D.; Yuan, F.; Yang, W.; Guo, L.; Che, Y. Nanoscale 2014, 6, 11057−11061. (31) Luo, Y.; Balogun, M.-S.; Qiu, W.; Zhao, R.; Liu, P.; Tong, Y. Chem. Commun. 2015, 51, 13016−13019. (32) Ma, Z.; Ren, L.; Xing, S.; Wu, Y.; Gao, Y. J. Phys. Chem. C 2015, 119, 23068−23074. (33) Ştoflea, L. E.; Apostol, N. G.; Trupină, L.; Teodorescu, C. M. J. Mater. Chem. A 2014, 2, 14386−14392. (34) Pomfret, M. B.; Stoltz, C.; Varughese, B.; Walker, R. A. Anal. Chem. 2005, 77, 1791−1795. (35) Kang, E.; Jung, Y. S.; Cavanagh, A. S.; Kim, G.-H.; George, S. M.; Dillon, A. C.; Kim, J. K.; Lee, J. Adv. Funct. Mater. 2011, 21, 2430− 2438. (36) Wu, H.; Chua, Y. S.; Krungleviciute, V.; Tyagi, M.; Chen, P.; Yildirim, T.; Zhou, W. J. Am. Chem. Soc. 2013, 135, 10525−10532. (37) Zeng, H.; Li, J.; Wang, Z. L.; Liu, J. P.; Sun, S. Nano Lett. 2004, 4, 187−190. (38) Tang, Y.; Ge, B.; Sen, D.; Yu, H.-Z. Chem. Soc. Rev. 2014, 43, 518−529. (39) Li, S.-K.; Chen, A.-Y.; Chai, Y.-Q.; Yuan, R.; Zhuo, Y. Electrochim. Acta 2016, 212, 767−774. (40) Scaggiante, B.; Dapas, B.; Farra, R.; Grassi, M.; Pozzato, G.; Giansante, C.; Fiotti, N.; Tamai, E.; Tonon, F.; Grassi, G. Curr. Drug Metab. 2013, 14, 565−582. (41) Liu, S.; Kang, M.; Yan, F.; Peng, D.; Yang, Y.; He, L.; Wang, M.; Fang, S.; Zhang, Z. Electrochim. Acta 2015, 160, 64−73. (42) Zhao, G.; Xu, J.-J.; Chen, H.-Y. Electrochem. Commun. 2006, 8, 148−154. (43) Sheikhzadeh, E.; Chamsaz, M.; Turner, A. P. F.; Jager, E. W. H.; Beni, V. Biosens. Bioelectron. 2016, 80, 194−200. (44) Heydari-Bafrooei, E.; Amini, M.; Ardakani, M. H. Biosens. Bioelectron. 2016, 85, 828−836. (45) Ladd, J.; Boozer, C.; Yu, Q.; Chen, S.; Homola, J.; Jiang, S. Langmuir 2004, 20, 8090−8095.
(46) Wang, M.; Sun, C.; Wang, L.; Ji, X.; Bai, Y.; Li, T.; Li, J. J. Pharm. Biomed. Anal. 2003, 33, 1117−1125. (47) Zhang, Z.; Ji, H.; Song, Y.; Zhang, S.; Wang, M.; Jia, C.; Tian, J.Y.; He, L.; Zhang, X.; Liu, C.-S. Biosens. Bioelectron. 2017, 94, 358− 364. (48) Liu, B.; Liu, J. ACS Appl. Mater. Interfaces 2015, 7, 24833− 24838. (49) Liu, S.; Li, H.; Wang, L.; Tian, J.; Sun, X. J. Mater. Chem. 2011, 21, 339−341. (50) Zhang, Y.; Yan, Y.; Chen, W.; Cheng, W.; Li, S.; Ding, X.; Li, D.; Wang, H.; Ju, H.; Ding, S. Biosens. Bioelectron. 2015, 68, 343−349. (51) Ma, F.; Ho, C.; Cheng, A. K. H.; Yu, H.-Z. Electrochim. Acta 2013, 110, 139−145. (52) Huang, J.; Luo, X.; Lee, I.; Hu, Y.; Cui, X. T.; Yun, M. Biosens. Bioelectron. 2011, 30, 306−309. (53) Chen, X.; Zhang, Q.; Qian, C.; Hao, N.; Xu, L.; Yao, C. Biosens. Bioelectron. 2015, 64, 485−492. (54) Guo, Q.; Li, X.; Shen, C.; Zhang, S.; Qi, H.; Li, T.; Yang, M. Microchim. Acta 2015, 182, 1483−1489. (55) Tian, J.; Huang, T.; Lu, J. Anal. Methods 2016, 8, 2375−2382. (56) Yu, Q.; Wang, P.; Hu, S.; Hui, J.; Zhuang, J.; Wang, X. Langmuir 2011, 27, 7185−7191. (57) Qiao, X.; Sun, A.; Wang, C.; Chu, C.; Ma, S.; Tang, X.; Guo, J.; Xu, G. Colloids Surf., A 2016, 498, 74−80. (58) Dong, J. X.; Li, N. B.; Luo, H. Q. Anal. Methods 2013, 5, 5541− 5548.
6818
DOI: 10.1021/acsomega.7b01065 ACS Omega 2017, 2, 6809−6818