Arduino and LabVIEW in Educational Remote Monitoring Applications D. Călinoiu, R. Ionel
M. Lascu, A. Cioablă
University “Politehnica” Timiúoara Piata Victoriei, Nr. 2, 300006, Timiúoara, Romania, e-mail:
[email protected],
[email protected] Abstract— This paper presents the implementation of Virtual Instrumentation (VI) based system used for remote monitoring of selected environmental parameters: humidity, temperature, light intensity and methane. The educational benefits (learning outcomes) of this application are the following: design and implementation of the monitoring circuitry, programming for both LabVIEW and Arduino, understanding VI concepts and using mobile devices for parameters monitoring. The proposed application was developed by students during Measurements and Virtual Instrumentation programming courses. It includes traditional data acquisition hardware (NI USB 6251) and the Arduino Uno device. A Cinterion MC55iT GSM/GPRS terminal is used for sending automatic alerts to authorized mobile phones. E-mail warnings are also available. If established parameters exceed imposed limitations, the warning system will activate. Distance operation of this application is available via LabVIEW Remote Panels technology and Data Dashboard running on iOS. In this way one can use the learning process in the form of a distance laboratory. Keywords—Virtual Instrumentation; LabVIEW; Environmental Remote Monitoring; Mobile Devices
I.
Arduino;
INTRODUCTION
Remote monitoring of environmental parameters in agriculture represents a subject of interest for many scientists and engineers. Different approaches combine sensors and automation in order to improve crop production. One such application is discussed in [1]. Moisture and temperature sensors placed near the roots of the plants, together with an automation system create a wireless network capable of controlling the irrigation system. Benefits of this application have been translated to consistency in crop production using less water resources. In [2] the authors present an application which can remotely monitor and detect temperature changes in agricultural green houses. A SMS (Short Message Service) based warning system is employed for communication with the farmers. The complexity of this type of applications is related to the number of parameters which determine the decision process. For example, in [3] remote monitoring of canopy temperature is employed for automatic irrigation scheduling. Numerous complex systems are functional or under study, thus showing the importance of development in this domain. This is the reason for relating the proposed educational application to environmental monitoring with agricultural purposes.
978-1-4799-3922-0/14/$31.00 ©2014 IEEE
University “Politehnica” Timiúoara Piata Victoriei, Nr. 2, 300006, Timiúoara, Romania, e-mail:,
[email protected],
[email protected] Furthermore, we aimed at introducing our students to concepts of Virtual Instrumentation (VI). LabVIEW, data acquisition hardware and dedicated sensors represented the chosen solution. The solution of VI has been discusses and deployed in many measurement and control activities. In [4] such a VI system is used for structural monitoring of bridges while [5] provides different electronic resources with examples and solutions. Without any doubt, measurement and analysis via VI is viewed as an educational activity which is necessary in a modern teaching process. For educational purposes, remote laboratories have gained an increased attention in the last decade. In [6] a distance laboratory for solar electricity experiments is presented. This paper discusses an evaluation of Remote Panels and Web Services via LabVIEW. Distance learning is an alternative tool to traditional methods and is present at many institutions worldwide. At Stanford University there is the CyberLab optics laboratory [7] while at Illinois University a laboratory for nuclear engineering experiments [8] is used. Finally, the purpose of the proposed system is to engage our students in taking remote measurements via mobile devices. The educational benefits (learning outcomes) of this application are the following: design and implementation of the monitoring circuitry, programming for both LabVIEW and Arduino, understanding VI concepts and using mobile devices for parameters monitoring. The work has been performed by 4th year students from the Electronics and Telecommunications Faculty during Measurements and Virtual Instrumentation laboratories. Discussions with our students helped in clarifying technical issues related to programming, component placing on the board and presentation of measurement results. We used LabVIEW in order to implement a program which records and analyzes data from different environmental sensors for: humidity, temperature, light and CH4. The data acquisition process was implemented using traditional National Instruments hardware (the NI USB 6251) and the Arduino Uno board. The main application controls the process and can be accessed using Remote Panels. Our students integrated a code which is activated in case of unwanted events. This code sends SMS warnings using a dedicated Cinterion MC55iT GSM/GPRS terminal and AT commands. In this way operating this terminal from LabVIEW proved to be a useful educational experience. We also wanted to show how LabVIEW can
control fans and relays through digital lines. This feature was introduced in the main application with the purpose of replicating an irrigation system. Data saving can be enabled by the application user. An iOS based tablet communicates via Web Services and allows the remote user to monitor designated variables. The remaining part of this paper is organized as follows: Section 2 presents an overview of the experimental setup. The educational features of the measurement system are described. Section 3 shows relevant experimental results and discusses accuracy characteristics. The author’s conclusions and future developments are mentioned in the final section. II.
EXPERIMENTAL SETUP
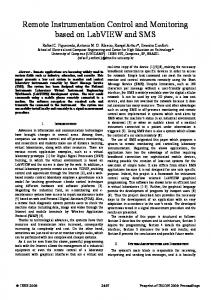
A. Hardware and Software Components The schematic of the measurement system is presented in Fig. 1. The interaction of the user with this system can be remote or in the laboratory. The first choice of distance interaction is using Remote Panels (RP) from another computer. A mobile device can be used only for parameter monitoring if Data Dashboard (DD) is previously installed [5]. A mobile phone can be selected for receiving SMS warnings in the case of over the limit parameter values [9]. In the laboratory, a PC with LabVIEW runs the main application. This computer is connected via USB to three hardware equipments. First, the NI USB 6251. This is a data acquisition hardware used with a NI CB-68LP connector. Temperature (TMP01 from Analog Devices) and light (a Photodiode) sensors are connected to the input lines using differential mode.
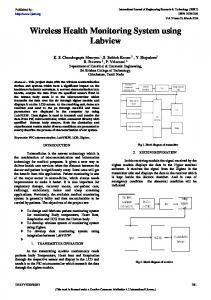
The sensors which were included in the circuitry respond to temperature, illumination, humidity and methane. These are some parameters which are generally monitored when dealing with agricultural applications. Our students studied how these sensors work and implemented the signal conditioning part. It is not the purpose of the present work to describe the circuit which was implemented for each sensor. Concepts like amplification, filtering and stage separation have been explored. For example, the TMP01 provides an output with a resolution of 5mV/°K. A circuit which converts to °C was also implemented. Using a Delta Ohm HD2102.2 light-meter the illumination relation for the corresponding voltage of the Photodiode has been determined. For powering the circuit our students were asked to develop a source (currently under study) which takes alternating voltage from the network and provides the DC voltage. So a rectifier circuit, a capacitive filter and a voltage regulator will be included in the powering scheme. In this way the power source outputs both DC voltage and AC voltage. The AC voltage will be used for powering a pump. In Section IV we discuss the future development of this system and the purpose of the pump. The LabVIEW software component includes multiple sub Virtual Instruments (subVIs) which run under the main application. The general structure is that of a state machine. The Arduino Toolkit needs to be installed since the program needs dedicated functions for interacting with the hardware. Fig. 2 shows the basic execution of the LabVIEW program. This application plays the role of a server to which remote users can connect using RP and DD. Initially, all needed variables are included in a Cluster structure. This structure is passed from state to state and the needed data is either written or read. The hardware lines are reserved and the settings for differential acquisition are transmitted using dedicated DAQmx functions [5]. The user will select if remote communication via RP, DD and GPRS is allowed. Also, the user may set the time functionality limit of the application. If the user needs the program to automatically stop after a period of time this feature is also available.
Fig. 1. Schematic of the experimental setup in the laboratory.
The Arduino Uno device is used with other light (NSL 4960), relative humidity (HIH 4000) and methane (the Figaro NGM 2611-C13 for CH4) sensors. These sensors are connected to the Analog Input lines. We intended to discuss with the students another possibility of measuring these parameters without necessarily using NI acquisition hardware. The third device is the Cinterion MC55it terminal used for sending SMS warnings with the help of specific AT commands (‘‘Attention’’ commands). In this way the students can observe the possibility of using this dedicated terminal with LabVIEW instead of a microcontroller. E-mail messages are also sent using the Internet connectivity of the laboratory PC.
Fig. 2. Basic functioning diagram of the main LabVIEW application.
Once the Idle state is reached a command from the user is expected. At this point the user can begin the measurement (Acquire) or Exit the application. Once the measurement starts it takes the recorded data and performs specific computations. Finally, results are Presented. In this state data saving and
GPRS based transmission is performed. The user will return to the Idle state when the measurement has ended. In Fig. 3 we present the experimental setup from the laboratory.
if the sensors respond or not within expected limits. For the NGM 2611-C13 sensor we have chosen to display a warning only if the gas quantity has exceeded the imposed limit [10]. This is done using a LED object. The application shows the number of warning messages which were sent. Of course, a setting provides the option of choosing how many warnings/hour will be issued. If a certain parameter continuously exceeds a limitation then sending several messages to a mobile phone over a short period of time is not an appropriate choice. The four graphs display the current value and the average over the last 10 samples for selected parameters. III.
EXPERIMENTAL RESULTS
For the proposed application we have focused our testing on the accuracy of the functionality features. We verified if the LabVIEW program records the parameters from the Arduino Uno and the NI USB 6251. Fig.3. Experimental setup in the laboratory.
This setup corresponds with the one presented in Fig. 1. The remote accessibility features will be discussed in the experimental part. B. System Functionality Features Fig. 4 presents the front panel of the LabVIEW application which operates the measurement system. The user Starts the measurement process after setting the following options: allow or not remote monitoring using DD, allow or not sending of warning SMS and mail messages and enabling or not data saving of measurement results.
For example, we verified how the TMP01 temperature circuit should be operated [11]. We set the corresponding resistor values so that the high temperature point was 28°C. Next we tested if the user receives warning messages on the mobile phone receives. In Fig. 5 we present the results displayed on the mobile phone. One can see that both the SMS and e-mail have been sent with the text: The temperature 28.00 was exceeded by 0.34. The format of this text can be modified by the user. In future developments of the messaging format we will also include details about the humidity, methane and illumination. The values of recorded temperature (from Arduino and NI USB 6251) have been compared against the output of a dedicated measurement device – the NI USB TC01. This device has been considered as our reference. A maximum relative measurement error of approximately 7% has been obtained, where the true value was considered as the output of the TC01.
Fig. 4. Front Panel for the main application.
An indicator on the left side of the panel displays the names of the states (see Fig. 2) in which the execution is. In this way the user can follow the succession of the execution. Each complete execution, from Acquiring to Presentation lasts 10 s. This time value reflects the case when sending SMS and mail messages is not enabled. If this option is used, the execution time changes as it depends on how fast the GPRS terminal is able to complete all operations. As a general value, we can estimate that working on a crowded operator network all operations end in approximately 60 s. At each program loop all the voltage values are presented. In this way the user can verify
Fig. 5. Testing of SMS and email warnings from TMP01 readings.
In Fig. 6 we present a sample panel which is available using Data Dashboard. This image was obtained when using an iPad Air. For this panel we have chosen to present the evolution of recorded temperature and humidity. Graphs and LED indicators are used to show if imposed limits have been exceeded. The application continuously polls the web service generated by the LabVIEW program. The time between two
values must be synchronized with the execution of the state machine. In our case one value is presented at each 5 s. This communication between the LabVIEW program and the DD panel requires more adjusting. If the timing changes in the main application it will translate to a change in the polling from the DD. To this DD panel we will add new elements. We will present the illumination evolution, the gas concentration indication and the number of SMS warnings which have been sent. There is no problem in including these new elements since they follow the same rules as the ones presented in Fig. 6.
In our case, the concentration response domain of 300 ppm to 10000 ppm has been divided into three sub-domains. These intervals are set according to the measured RL value of 2.68 kȍ. In addition to studying the functionality of this circuit, the students determined three expressions for methane concentration expressed in ppm starting from the response diagrams of the sensor [12]. The educational benefits of implementing this procedure are two. First of all, a circuit which was designed with the purpose of signaling in a concentration level has been exceeded was used for continuous measurements due to a voltage to ppm empirical relation. Secondly, the students determined corresponding mathematical relations, implemented them in the software program and tested the results using the TESTO 350 M/XL gas analyzer. IV.
Fig. 6. Data Dashboard – Remote monitoring of environmental parameters.
The remote user is not allowed to control the LabVIEW program. We have selected this behavior since the students are present in the laboratory in order to discuss the other system components. The Arduino device has been programmed in order to send the values from the analog input lines, concatenated, over the USB port. A delay of 5 s has been set. The LabVIEW application reads the entire string and then divides the characters into the corresponding parameters. A conversion from string type to numeric type ends the Arduino Uno to LabVIEW data transmission. An empirical procedure for automatic calculation of methane concentration from the output voltage of the NGM 2611-C13 has been added. An example of such a test is presented in Fig. 7.
Fig. 7. Test for voltage to ppm conversion using the empirical relations.
CONCLUSIONS AND FUTURE DEVELOPMENT
This paper presents an educational VI based system for environmental monitoring. This work has been inspired from existing systems which are used in agriculture for different purposes related to crop exploitation. We proposed a small scale monitoring of humidity, temperature, light intensity and CH4. Using a precise set of functionality features we aimed at focusing on teaching the essence of virtual instrumentation. Our students were confronted with hardware subjects related to sensors and signal conditioning. They learned to perform data acquisition using a traditional device (the NI USB 6251) and the Arduino Uno board (a cheaper solution but not so accurate). The software component has required the most attention. A first task was to determine the appropriate structural approach. The state machine architecture has been selected. Note that besides traditional virtual instruments functions, the Arduino toolkit has been exploited. So our students had the opportunity of programming with dedicated Arduino functions. In order to extend the functionality, remote monitoring options have been included. Two tasks have been implemented. The main program is capable of controlling a Cinterion MC55iT GSM/GPRS terminal. This terminal is used for sending SMS warnings to remote users. E-mail messages are also sent if the user enables this feature. A second remote possibility is to use the Data Dashboard panel for remote monitoring of recorded parameters. This allows our students to come in contact with new applications dedicated to mobile devices. Learning concepts like web services, network shared variables and control of data transmission rates was mandatory. For our future developments we will focus on finalizing this system. As a first task, we will study the response of our sensors using different humidity and illumination levels. We must establish the sensitivity responses and include the corresponding voltage to parameter conversions in the main LabVIEW application. A new algorithm will read the converted parameter values and decide when to use the digital lines in order to open a relay which triggers the irrigation process. The relay starts a small fish-tank type pump which takes water out of a recipient.
ACKNOWLEDGMENT The authors are grateful for the support provided by students R. Catrina, O. Popeti, M. Pascu, S. Vladescu, P. Vajdovics and M. Carlogea. REFERENCES [1]
[2]
[3]
[4]
J. Gutierrez, J.F. Villa-Medina, A. Nieto-Garibay, and M.A. PortaGandara, “Automated Irrigation System Using a Wireless Sensor Network and GPRS Module,” IEEE Trans. on Instrumentation and Measurement, vol. 63, issue 1, pp. 166-176, August 2013. I. A. Aziz, M. H. Hasan, M. J. Ismail, M. Mehat, and N.S. Haron, “Remote Monitoring in Agricultural Greenhouse Using Wireless Sensor and Short Message Service (SMS),” Int. J. of Engineering and Technology, vol. 9, no. 9, pp. 1-12, October 2009. S.A. O’Shaugnessy, and S.R. Evett, “Canopy temperature based system effectively schedules and controls center pivot irrigation of cotton,” Agr. Water Manag., vol. 97, no. 9, pp. 1310-1316, April 2010. D.N. Farhey, “Integrated Virtual Instrumentation and Wireless Monitoring for Infrastructure Diagnostics,” Structural Health Monitoring, vol. 5, no.1, pp. 29-43, Feb. 2006.
[5] [6]
National Instruments, http://www.ni.com/, last accessed on 01.04.2014. P. Bauer, and R. Ionel, “Solar Energy Distance Laboratory using LabVIEW Remote Panels and Web Services,” Scientific Bulletin of Politehnica University Timisoara, Transactions on Automatic Control and Computer Science, vol. 58(72), no.2, pp.149-156, June 2013. [7] L. Hesselink, D. Rizal, E. Bjornson, S. Paik, R. Batra, P. Catrysse, D. Savage, and A. Wong, “Stanford CyberLab: Internet assisted laboratories,” J. of Distance Education Technologies, vol. 1, pp.22-29, March 2003. [8] J. Prashant, J. Stubbins, and U. Rizwan, “Interactive Virtual Laboratory for Distance Education in Nuclear Engineering,” in Proc. of Physor International Conference, Vancouver, Canada, 2006, pp. 2950-2957. [9] R. Ionel, G. Vasiu, and S. Mischie, “GPRS based data acquisition and analysis system with mobile phone control,” Measurement 45, pp. 1462 - 1470, March 2012. [10] R. Ionel, S. Ionel, and A. Gontean, “Virtual Instrumentation with Mobile Device control for Methane Concentration Measurements,” ICIW 2012 The Seventh International Conference on Internet and Web Applications and Services, pp. 200 – 206, Stuttgart, Germany, May 2012. [11] TMP01 Setpoint Calculator from Analog Devices , last accessed on 10.04.2014. [12] Figaro Sensors, www.figarosensor.com, last accessed on 23.06.2014.