The C4.5 learner is an open source, free ... mented as part of the WEKA data mining platform [3]. The ... The data sets used in our analysis are listed in Table 1.
Are Decision Trees Always Greener on the Open (Source) Side of the Fence? 1-4
Samuel A. Moore1, Daniel M. D’Addario2, James Kurinskas3, and Gary M. Weiss4 Department of Computer and Information Science, Fordham University, Bronx, NY, USA
Abstract - This short paper compares the performance of three popular decision tree algorithms: C4.5, C5.0, and WEKA’s J48. These decision tree algorithms are all related in that C5.0 is an updated commercial version of C4.5 and J48 is an implementation of the C4.5 algorithm under the WEKA data mining platform. The purpose of this paper is to verify the explicit or implied performance claims for these algorithms—namely that C5.0 is superior to C4.5 and that J48 mimics the performance of C4.5. Our results are quite surprising and contradict these claims. This is significant because existing work that is based on these claims (e.g., J48 being equivalent to C4.5) may be misleading. Keywords: classification, decision trees, evaluation.
1
Introduction
This paper compares the performance of three popular decision tree algorithms: C4.5, C5.0, and J48. These algorithms are all related since C5.0 is n updated, commercial version of C4.5 and J48 is an implementation of C4.5 under the WEKA data mining platform. Specific claims have been either explicitly or implicitly made about the relative performance of these algorithms and the goal of this paper is to assess these claims and, in particular, determine if:
• C5.0 is superior to C4.5 • J48 and C4.5 perform similarly If C4.5 and J48 do not perform similarly then this may impact existing research which assumes that they perform similarly; conclusions made for those papers may not generalize to C4.5, which for many years was the standard decision tree classification algorithm used in the machine learning and data mining communities. Also, it is important to assess the performance of C4.5 since, although it is quite old and has not been updated in many years, it is still frequently used in research. If its performance is far inferior to commercial decision tree algorithms, the research community should be clearly aware of this and that any conclusions based on this old algorithm may be suspect. This paper also investigates the claims made by Rulequest Research that their C5.0 decision
tree algorithm performs better than C4.5, especially on larger data sets.
2
Methodology
The three decision tree learners that are evaluated in this paper are all related. The C4.5 learner is an open source, free version of the decision tree rule creation algorithm created by Ross Quinlan [2]. C5.0 is the commercial and updated version of C4.5 from Rulequest Research, which is supposed to be superior to C4.5 (see www.rulequest.com for more details). The J48 learner is a version of the C4.5 algorithm implemented as part of the WEKA data mining platform [3]. The terms WEKA and J48 may be used interchangeably in this paper. The data sets used in our analysis are listed in Table 1. Most of the data sets are from the UCI repository [1]. Table 1 shows the size of each data set as well as the degree of class imbalance by showing the percentage of examples belonging to the minority class. In the remainder of the paper data sets are referred to using the data set number provided in the first column of Table 1. TABLE 1: DATA SET DETAILS # 1 2 3 4 5 6 7 8 9 10 11 12 13 14 15
Name adult band breast-wisc echocardiogram weather car hepatitis blackjack contraceptive hypothyroid horse-colic liver sonar vote hungarian-heart
Size 5,000 538 699 74 1,000 1,728 155 150,000 1,473 3,163 300 345 208 300 294
% Minority 24% 42% 35% 32% 40% 30% 20% 36% 27% 48% 36% 42% 47% 39% 36%
All experiments were run for C4.5, C5.0 and J48 using the default decision tree settings and ten-fold cross validation. The default parameters were used for each of the classifiers tested. The data partitioning for the cross validation was done external to the three classifier induction programs to ensure that each of the three classifiers were induced using precisely the same data partitions. In addition to tracking the accuracy and error rate of each decision tree (based on test set performance) we also tracked the F-measure, which balances the importance of precision and recall. A confusion matrix for a two class problem is shown in Table 2. Accuracy is the fraction of examples classified correctly and is calculated as (TP+TN)/(TP+TN+FP+FN), with error rate (ER) equaling 1 – accuracy. TABLE 2: CONFUSION MATRIX Predicted Class P Actual Class
N
P
TP (True Positive)
FN (False Negative)
N
FP (False Positive)
TN (True Negative)
Accuracy is a poor measure when there is substantial class imbalance in a data set and for that reason we also track the Fmeasure, which balances the performance of the two classes. The F-measure is defined below, where recall and precision are defined as: Recall = TP/(TP + FN) Precision = TP/(TP + FP) F-Measure =
2 × Recall × Precision ⎯⎯⎯⎯⎯⎯⎯⎯⎯ Recall + Precision
Finally, we used a t-test to determine if the observed differences in classifier performance are statistically significant. The results of the t-tests are reported, along with the performance results, in Section 3.
3
Results
The results for all three decision tree algorithms, for both F-measure and error rate, are shown in Table 3. For each data set and each performance metric, the best value is highlighted by underlining it (note that higher F-measure values are better). From the results in Table 3 it is clear that C4.5 consistently yields the best value for both F-measure and error rate. Furthermore, C5.0 outperforms J48, although the relative differences are much smaller.
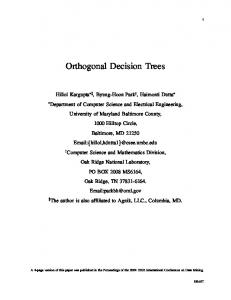
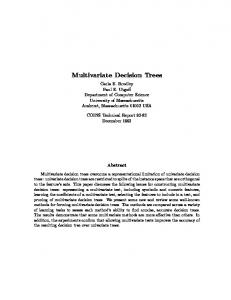
TABLE 3: STATISTICS FOR C4.5, C5.0 AND J48 (WEKA) ALGORITHMS F-measure Error Rate # C4.5 C5.0 J48 C4.5 C5.0 J48 1 .922 .908 .908 .119 .146 .144 2 .486 .705 .447 .286 .243 .303 3 .981 .958 .958 .024 .054 .054 4 .989 .970 .970 .013 .040 .040 5 .699 .626 .633 .209 .302 .289 6 .996 .958 .954 .004 .057 .063 7 .957 .858 .902 .071 .232 .161 8 .509 .480 .489 .271 .276 .278 9 .525 .410 .396 .201 .214 .214 10 .946 .916 .920 .005 .007 .007 11 .925 .888 .886 .100 .150 .150 12 .735 .563 .587 .194 .336 .313 13 .952 .692 .697 .043 .266 .288 14 .975 .958 .947 .030 .050 .063 15 .919 .902 .842 .105 .125 .214 Ave. .834 .786 .761 .112 .168 .172 These results are surprising. First, C4.5 outperforms C5.0, the newer and more advanced commercial version of C4.5. While most of the claimed superiority of C5.0 over C4.5 has to do with large data sets (and we have relatively few truly large data sets), there is no acknowledgement that C5.0 does worse on small data sets—yet that is exactly what we see. Perhaps the biases built into C5.0 that permit it to do well on large data set cause it to perform poorly on smaller data sets. But if this were true, it should be possible to use different biases based on training set size or simply use C4.5 for small data sets. We also see that J48 does not perform similarly to C4.5 and in fact performs much more similarly to C5.0 than to C4.5. We cannot explain this given that J48 is supposed to be a reimplementation of C4.5. Table 3 clearly shows which method performs best but the magnitudes of the differences are only apparent with careful study. Figures 1 and 2 depict these differences visually. Figure 1 provides a scatter plot for F-measure performance and Figure 2 a scatter plot for error rate performance, where each data point corresponds to a data set and two different learning methods. To avoid overcrowding, each figure only compares the performance of C4.5 versus C5.0 and C4.5 versus J48 and does not directly compare C4.5 and C5.0. If two methods perform identically all points would be clustered around the line y=x. For F-measure, points below the line y=x indicate that C4.5 performs better while for error rate points above the line indicate that C4.5 performs better. Figures 1 and 2 indicate that C4.5 consistently performs better for both measures and that these differences are quite substantial since the data points tend to fall quite far from the line y=x.
In order to analyze the claim that C5.0 works better on larger data sets, we partitioned the data sets into two groups based on their sizes and then analyzed the results. One group, which we refer to as “smaller”, contains the nine data sets with fewer than one thousand records and the remaining six data sets are referred to as “larger.” The performance for these two partitions, for both F-measure and error rate, are shown in Table 5.
C5.0 & J48 F-measure
1
C4.5 vs. C5.0
0.9
C4.5 vs. J48 0.8 0.7 0.6 0.5
TABLE 5: AVERAGED PERFORMANCE BASED ON SIZE
0.4 0.3 0.3
0.4
0.5
0.6
0.7
0.8
0.9
C4.5
1
Data Sets
C4.5 F-measure
Figure 1: Comparison of F-measure Results
All Smaller
.35
(1000)
.25
Abs. diff
.20
C5.0
J48
F-meas
ER
F-meas
ER
F-meas
ER
.835
.112
.787
.167
.770
.172
.873
.108
.826
.178
.798
.188
.767
.135
.717
.168
.717
.166
.106
.027
.109
.010
.081
.022
.15
C4.5 vs. C5.0 .10
C4.5 vs. J48
.05 .00 .00
.05
.10
.15
.20
.25
.30
.35
C4.5 Error Rate
Figure 2: Comparison of Error Rate Results We ran a t-test to do pairwise comparisons of the three methods and the results are shown in Table 4. The first column specifies which algorithms are being compared while the second column specifies which algorithm appears to perform best. The last two columns provide the confidence levels for this observation. The higher the confidence the more sure we can be that the observed differences are real and not due to chance. Note that a common threshold for confidence is 0.90 and based on that we cannot conclude with a high level of confidence that all of the differences are statistically significant. TABLE 4: T-TEST RESULTS Confidence F-meas ER .90 .90
Algorithms
Best
C4.5 vs. C5.0
C4.5
C4.5 vs. J48
C4.5
.68
.72
C5.0 vs. J48
C5.0
.84
.88
Based on the results in Table 4 we can be confident that for both F-measure and error rate C4.5 outperforms C5.0. The results also indicate that the differences between C5.0 and J48 may be statistically significant, but not at the 0.9 confidence threshold.
If we look at the absolute difference between the two partitions, C5.0 does have a bigger absolute difference between the two partitions for error rate (.027 vs. .010), but not Fmeasure. However, error rate was the only metric considered in the original claims for C5.0 being superior to C4.5. If we look at the differences between C4.5 and C5.0 or between C5.0 and J48, we see the same patterns as before, although the superiority of C4.5 over C5.0 is less for the larger partition. It is also helpful to look at the data set with the largest number of records. The blackjack data set (#8) has 150,000 records and for this C4.5 only narrowly beats C5.0 and J48. In fairness we should point out that our “larger” data sets are not all that large and we are currently in the process of evaluating much larger datasets to extend these results.
4
Conclusion
Our results indicate that C4.5 performs consistently better than C5.0 and J48 (at least on relatively small data sets) and appears to perform as well on the “larger” data sets, although no very large data sets were evaluated. In many cases the differences appear to be substantial, for both error rate and Fmeasure. It appears that the inductive bias for C5.0 is such that it is not well suited to small data sets. If this is in fact the case, it might be possible to adjust this bias based on the data set size so as to improve its performance on small data sets without necessarily harming its performance on larger data sets. Our analysis would benefit from additional large data sets (i.e., with more than 100,000 records) and we are currently in the process of evaluating such data sets. Rulequest research also claims that C5.0 is much more efficient than C4.5 in terms of memory and computation time and we hope to comprehensively evaluate this claim in the future. However, we have performed some preliminary tests and based on these the claims seem accurate. We did a preliminary analysis
of the forest-covertype data set, which contains 581,012 examples, and found that on the same computer C5.0 ran in 3.5 seconds whereas C4.5 took about an hour and a half (Rulequest Research quotes a similarly impressive speedup for this data set on their website). Perhaps even more surprising and significant, however, is the results from our comparison of J48 and C4.5. We expected J48 to perform similarly to C4.5 since J48 is supposed to be a reimplementation of C4.5, but our results clearly indicate that J48 consistently performs worse than C4.5 on the data sets that we evaluated and actually performs much more similarly to C5.0. We do not know the reason for this surprising behavior, but it is certainly warrants further study and raises questions about any research that has assumed that J48 is equivalent to C4.5. On the positive side, C4.5 is still frequently used for research and our results suggest that its performance is still impressive, since it performs competitively
with C5.0, a recently updated, commercial decision tree learner.
5
References
[1] D. J. Newman, S. Hettich, C. L. Blake and C. J. Merz. UCI repository of machine learning databases [http://www.ics.usi.edu/~mlearn/ MLRepository.html]. Irvine, CA: University of California, Department of Information and Computer Science. 1998. [2] Quinlan, J. R. 1993. C4.5: Programs for Machine Learning. San Mateo, CA: Morgan Kaufmann. [3] I. H. Witten and E. Frank, Data Mining: practical machine learning tools and techniques, 2nd Edition, Morgan Kaufmann, San Francisco, 2005.