Arterial Stiffness modeling using variations of Pulse Transit Time A. Peulic and E. Jovanov and M. Radovic and I. Saveljic and N. Zdravkovic and N.Filipovic
Abstract— In this paper, a finite elements (FE) modeling is used to model effects of the arterial stiffness on the different signal patterns of the pulse transit time (PTT). Four different breathing patterns of the same subject are measured with PTT signal and corresponding finite element model of the straight elastic artery is applied. The computational fluid structure model provides arterial elastic behavior and fitting procedure was applied in order to estimate stiffness of the artery. It was found that same elastic material characteristics were fitted for four different breathing patterns which validate this methodology for possible noninvasive determination of the arterial stiffness.
I. INTRODUCTION Pulse Transit Time (PTT) represents the time it takes the blood pulse wave to propagate from heart to a peripheral artery measurement site (for example, the finger), and has an important role in noninvasive assessment of blood pressure. The components of photoplethismogram (PPG) signal are not fully understood, it is generally accepted that they can provide valuable information about the cardiovascular system [1]. PTT is measured using electrocardiogram (ECG) and (PPG) [2]. The pulse pressure waveform results from the ejection of blood from the left ventricle into the aorta. There are two main parameters of the wave pulse: the blood velocity and pulse wave velocity. The blood velocity at the aorta is several meters per second and it slows down to several mm/s in the peripheral network while the pressure pulse travels much faster than blood [3]. Pulse wave velocity (PWV) is a direct measurement of arterial stiffness and describes how quickly a blood pressure pulse travels from one point to another in the human body and the time spent for such process, is the PTT [4]. The value of the PWV, is affected by several factors, such as the elasticity of arterial wall, arterial geometry (radius and thickness), and blood density. Typical value ranges from 5 m/s to 15 m/s,depending on the age of people and the state of their arteries [5]. Atherosclerosis is a disease that increases the thickness and rigidity of the arterial blood vessels, causing This work has been partly supported by Ministry of Science of Serbia, Grant No. TR-12007, OI-144028 and FP7 ICT-2007-2-5.3 (224297) ARTreat project. A. Peulic is with Technical Faculty,University of Kragujevac, 34000, Serbia
[email protected] E. Jovanov, is with the Electrical and Computer Engineering, University of Alabama, Huntsville, AL 35899 USA M. Radovic, is with the Bioengineering Research and Development Center Kragujevac. I. Saveljic, is with the Bioengineering Research and Development Center Kragujevac. N. Zdravkovic, is with the Medical Faculty, University of Kragujevac, Kragujevac, Serbia. N.Filipovic, is with the Mechanical faculty, University of Kragujevac, Kragujevac,Serbia.
978-1-4577-0554-0/11/$26.00 ©2011 IEEE
narrowing of artery. The increased inflexibility of the arterial wall increases PWV, since the energy of the blood pressure pulse cannot be stored in an inflexible wall. PWV can be used as a predictor of cardiovascular mortality in hypertensive subjects [6]. In a number of other studies [7][8], when comparing the results of the analysis of heart rate variability and pulse rate variability, some differences are revealed. That can be explained by temporal changes of hemodynamic parameters of the vascular system controlled by vascular regulation. Some authors tried to find characteristics defined in the frequency domain and the characteristics of the vascular system in order to obtain a diagnostic index of the vascular system, which may be used to estimate arterial stiffness [9][10]. In this paper the finite elements modeling of cardiovascular pulsation with combination of the PTT measurements on the finger of left hand is described, and we present experimental measurements, computational strategy and results of modeling validated by experiments. The main aim of this study was to find correlation of the arterial stiffness with PTT. II. EXPERIMENTAL MEASUREMENTS Pulse travel time is measured as time period between contraction of the ventricles and arrival of the blood pulse to the left index finger. Contraction of the ventricles is detected using R peak of the ECG signal; arrival of the blood pulse is detected as the half rise point of PPG signal. Electrodes are connected with wires to the recording device which is sometimes connected with wires to the processing device. This configuration is not convenient to the patient and to the researches too. The wires make some movements difficult and they alter normal behavior of a patient. Taking this into consideration we selected elastic belt with embedded electrodes and capturing device on the belt. The capturing device sends ECG R peak signal wirelessly to the processing board. PPG sensor is attached to the finger or ear and connected to the processing board. Processing board captures ECG signal and PPG signal and determine delay between consecutive R peaks for ECG and PPG signals. For further processing it should have sufficient amount of memory, low frequency clock and timer with capture/compare registers. Processing board can display result on LCD and/or transmit the result to PC via Ethernet or serial line. The overall hardware architecture is shown in figure 1 and PTT timing diagram in figure 2. Precise measurement of the PTT with minimum latency is implemented using digital output of the PPG sensor (OEM III board from Nonin [11]) and custom ECG peak capture board connected to the input pins of timer on the processing board.
Fig. 1.
Hardware architecture
Timer capture/compare registers used input pin interrupts to capture relative timing of ECG and PPG signals. Measured intervals are sent to PC for display and processing.In order to validate modeling of arteries in different physiological conditions, several breathing experiments were conducted. The goal of these experiments were to record difference in RR and PTT measurements due to different breathing patterns and model the changes using Finite Element (FE) modeling. The experiment was conducted in sitting position and consisted of four steps: • normal breathing: 1 minute • paced breathing at 5sec/breath for two minutes • paced breathing at 10 sec/breath for two minutes • normal breathing 1 minute PTT measurements are presented in figure 3 and RR measurements are given in figure 4.
Fig. 2.
PTT illustration
III. C OMPUTATIONAL MODELING RESULTS Computer modeling is a useful tool for the study of dynamic behavior of blood flows in the arteries. PWV provides an assessment of the state of the cardiovascular system. Pressure pulse velocity is determined by elastic and geometric properties of arterial wall. It can be expressed by the Bramwell-Hill equation s V ∆P PWV = (1) ρ∆V where V is blood volume, ∆V and ∆P are the changes of blood volume and pressure, and ρ is the density (of blood). This relation enables the study of compliance (arterial elasticity) by measuring the PWV. Also, Moens-Korteweg equation can be used to determine a PWV s Ehw PWV = (2) 2ρw ri
Fig. 3.
PTT measurements
Fig. 4.
RR measurements
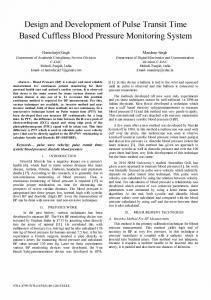
where E is the elastic modulus, ρw is wall density, hw is the thickness of the arterial wall and ri is the internal vessel adius. Relationship between PTT and PWW can be represented as L PTT = (3) PWV where L is the distance the pulse travels (roughly equals to the aorta ascending arch plus arm length). In this paper, we simulate a blood vessel as an elastic tube where fluid flows in a periodic time function, which corresponds to the periodic heart rate. We model the straight artery of length 700 mm, lumen radius 3.8 mm and wall thickness 0.5 mm. The comparison of analytical solution from MoensKorteweg theory [2] and numerical solutions by varying Youngs modulus is shown in figure 5.
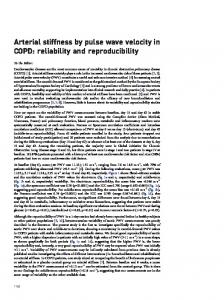
Fig. 6. The velocity magnitude field in the blood vessel for early deceleration flow t=0.4 s,) Deformable walls
Fig. 7. The wall shear stress in the blood vessel model for early flow deceleration t=0.4 s; Rigid walls [Pa]
Fig. 5. Pulse wave velocity as function of Youngs modulus. Comparison of numerical and analytical solution
A very good agreement of numerical solutions with analytical results is achieved, where mean difference of the two curves is 0.10 m/s, standard deviation has a value of 0.0478 m/s, while the standard error is 0.0169. The finite element mesh discretization of the straight blood vessel is implemented. The fluid domain is discretized with structured mesh of 1850 fluid nodes and solid domain contains 1400 solid nodes. Blood is taken as an incompressible Newtonian fluid, which is appropriated for the large arteries. The blood density is ρ=1.025 g/cm3, and the kinematics viscosity is v =0.035 cm2/s [13][14]. The contour slice of velocity magnitude, wall shear stress and effective stress in the wall are shown in figure 6, 7 and 8 for early flow deceleration t=0.4 s, in the case of deformable and rigid walls. The results for wall shear stress show generally lower shear stresses for deformable walls in comparison to rigid wall. This is probably due to more continuous changes of the velocities near the walls (smaller velocity gradient) under pulsatility conditions when the walls are considered as deformable media. The effective stress field in the wall is shown in figure 8. The highest stress concentration is
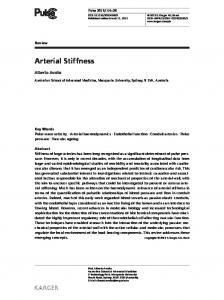
observed at the beginning of pipes. Stress distribution in the walls of blood vessels is important for the behavior of blood vessels as a deformable body. In order to view a more complete fluid-solid interaction, the deformation of the wall during one cycle is presented in figure 9. It shows that more elastic walls (smaller Young ’s modulus) have a greater deformation during the flow of blood, because the pressure change due to blood vessel expanding and contracting. A great attention was devoted to matching the results obtained from our model with the results we obtained measurements described in section experimental measurements. In fact, we were triying to fit Young ’s moduls for four different physiological states (experimental breathing protocols), which represent the relationship between PTT signal and pressure. To fit elasticity modules E1, E2, E3 and E4 (for each breathing pattern) we used a simplex optimization method developed by John Nelder and Roger Mead [14]. This method is extremely simple and involves only function evaluations (no derivatives). Function that was minimized is calculated as a sum of four squared error functions - one for each breathing pattern. These squared error functions represent the difference between measured PTT values and PTT values calculated by substituting E1-E4 in (2). Each pattern of breathing is simulated by time functions of the flow of fluids. As a result of these input functions, we obtained the
Fig. 8. The wall stress in the blood vessel model for early flow deceleration t=0.4 s; Rigid walls [Pa]
PTT for different breathing rhythms of the same subject and compared measurements with simplified finite element fluidstructure interaction model. Numerical simulation analyzed a fluid-structure interaction where fluid and solid domain represent the straight deformable artery segment. The length of numerical model approximately corresponds to the distance from the main aorta root to the finger measurement position of the subject. The simulation results using this simplified approach provide a very good fit with the elastic property of the arterial wall. Therefore, our preliminary results indicate that pulse travel time measurement can be used for noninvasive assessment of the arterial stiffness. The proposed method could allow the implementation of screening diagnostics. For clinical using it is sufficient to register equal duration of ECG signal and the distal arterial pulse, which are carried out with non-invasive methods by means of widely available monitoring devices. R EFERENCES
Fig. 9. Maximal displacement vs time in the blood vessel model during one cycle: Rigid walls
corresponding pulse wave velocities that are inserted in PTT formula (3) and get a set of values for the PTT signal. Our task was to fit the module E, so that the calculated PTT signal corresponds to the measured human values. The resulting Youngs modulus was E1 = 1.0121 MPa, E2 = 1.0179 MPa, E3 = 1.0445 MPa, E4 = 1.0014 MPa. IV. D ISSCUSION AND CONCLUSIONS The proposed model is simplification of simulation for the complex pulsatile flow through arterial system and noninvasive measurement of PTT. The initial results have shown good correlation and validation for estimation of the arterial stiffness. The assumption of the elastic behavior of the walls is used which is simplification of the nonlinear compliance of the arterial wall. Even with this approximation good results are achieved. Stress distribution inside the wall can be variated with different combination of peripheral resistance, compliance. Also shear stress distribution which is crucial factor for activation of endothelial cells and atherosclerosis disease can be fitted with different change of blood viscosity and concentration of LDL and HDL in the standard blood patient analysis. Using of the administering drugs that alter nitric oxide synthesis in the endothelial cells lining blood vessels can be also easy implemented in this model. Primary aim of this study was to evaluate feasibility of estimation of arterial stiffness using PTT measurements. We measure
[1] J.Allen ”Photoplethysmography ant its application in clinical physiological measurement”, Physiological measurement, 28 (3). [2] P.O.Cox, C. Madsen, K. L. Ryan, V. A. Convertino and E. Jovanov,”Investigation of Photoplethysmogram Morphology for the Detection of Hypovolemic States”, 30th Annual International IEE EMBS conference , Vancuver, BC. 5486 - 5489. [3] McDonald, W.W. Nichols and M.F. ORouke, ”McDonalds blood flow in arteries: theoretical, experimental and clinical principles”, Oxford University Press, 1988. [4] A. Steptoe ”Pulse wave velocity and blood pressure changes: calibration and applications”, Psychophysiology, 13 488-493, 1976. [5] Callaghan FJ, Geddes LA, Babbs CF, Bourland JD ” Relationship between pulsewave velocity and arterial elasticity”, Med Biol Eng Comp, 24 (3) 248254, 1986. [6] Laurent S, Boutouyrie P, Asmar R ”Aortic stiffness is an independent predictor of all-cause and cardiovascular mortality in hypertensive patients”,Hypertension, 37 12361241,2001. [7] Constant I., Laude D., Murat I. ”Pulse rate variability is not a surrogate for heart rate variability”, Clinical Science Vol. 97, 391397, 1999. [8] Drinnan M.J ”Relation between heart rate and pulse transit time during paced respiration”, Physiology Measurement Vol.22, 425432,2001. [9] Giardino N.D. ”Comparison of finger plethysmograph to ECG in the measurement of heart rate variability”, Psychophysiology , Vol.39: 246-252,2002. [10] Johansson A ”Estimation of respiratory volumes from the photoplethysmographic signal part.1: experimental results”, Med.Biol.Eng. Comput. ,Vol. 37, 42-47,1999. [11] ıthttp://www.nonin.com/ [12] Y.M. Wong and Y.T. Zhang ” The effects of exercises on the relationship between pulse transit time and arterial blood pressure”, Conf. of IEEE Engineering in Medicine and Biology Society, 5 5576-8. [13] N . Filipovic, M. Ivanovic, D. Krstajic and M. Kojic ”Hemodynamic flow modeling through an abdominal aorta aneurysm using data mining tools”, IEEE Transactions on Information Technology in BioMedicine (in press) [14] Nelder J. and Mead R ” A simplex method for function minimization”, Computer Journal 7 (4), 308-313.