An automatic system for continuous monitoring of CO2, H2S, SO2 and meteorological parameters in the atmosphere of volcanic areas B. Badalamenti,*a M. Liottab and M. Valenzac a
I.N.G.V. Sezione di Palermo, Via Ugo La Malfa, 153, Palermo, Italy. E-mail:
[email protected]; Tel: z39 0916809433; Fax: z39 09116809449 b Dipartimento C.F.T.A., Universita` di Palermo, Via Archirafi, 36, Palermo, Italy. E-mail:
[email protected]; Tel: z39 0916161574; Fax: z39 0916168376 c Dipartimento C.F.T.A., Universita` di Palermo, Via Archirafi, 36, Palermo, Italy. E-mail:
[email protected]; Tel: z39 0916161574; Fax: z39 0916168376
Article
Received 25th May 2001, Accepted 13th July 2001 Published on the Web 25th July 2001First published as an Advanced Article on the web 25th August 2000 An automatic system for the continuous monitoring of CO2, H2S, SO2 and meteorological parameters in atmosphere has been developed. The system has been tested in the laboratory in order to verify the stability and reliability of each sensor and of the whole system. A field test for a period of one month, at the Solfatara of Pozzuoli has also been carried out. The acquired data during the field test reveal a correlation between the wind speed and the concentrations of CO2, H2S, and SO2 in the atmosphere. With a wind speed of over 4 m s21 the concentration of the three gases reached constant background values of 600 ppm for CO2 and about 2 ppm vol. for H2S and SO2. The different ratios of H2S/SO2 measured in the fumaroles (y100) and in the atmosphere (1–0.1) clearly indicate that H2S is oxidized to SO2 during the transport.
Introduction Active volcanic areas are generally indicated by different kinds of degassing, such as fumaroles, mofettes and diffuse soil degassing. The intensity of degassing, as well as the composition of the gaseous manifestations, are strictly related to the state of activity of each volcano. In the last years, several studies carried out in different volcanic areas clearly indicate that the presence of gas hazard is quite recurrent and that it is essentially controlled by the strength of the source, the morphology of the area, and meteorological parameters.1–5 According to the composition of volcanic gases, the main gaseous constituents that could be responsible for the existence of gas hazard are essentially CO2, H2S, and SO2. The last two gases are normally present in areas close to fumaroles and the ratio H2S/SO2 in fumarolic gases can change in a wide range, being essentially controlled by the temperature and oxygen fugacity values of fumaroles (at higher temperature and fO2, SO2 is more abundant while H2S is the dominant species at lower temperatures and fO2).6 The CO2 is always present in all gaseous manifestations such as fumaroles, mofettes, diffuse soil degassing and it is the most abundant species of the incondensable gases. It is then necessary to have the possibility of monitoring the content of these three gases in the atmosphere in order to control the gas hazard in a given area. The main objective of this work was to develop an automatic apparatus for the continuous and remote control of the concentrations of the aforementioned gases in the atmosphere, as well as the meteorological parameters (rain, wind speed and direction, atmospheric pressure and temperature).
Automatic station for continuous monitoring of CO2, SO2, H2S and meteorological parameters Characteristics of the system The system can essentially be divided into three parts: DOI: 10.1039/b104622p
1. Data logger (DL). The DL used has been projected and assembled in the I.N.G.V. electronic laboratory. The main purpose to develop a new data logger was essentially due to the very corrosive environment normally present in volcanic areas. The DL has 15 channels for analog inputs and each one may be connected to one sensor to read what follows: 0–2 V; 0–20 mA; K V, where K is a fixed constant for all the channels. In this way, the sensors normally used to monitor geochemical parameters (thermocouple, thermoresistance, electrochemical sensors, spectrophotometer IR, etc.) can be connected directly to the analog input of the data logger without any use of other transducers. The DL is powered by a 12 DCV (direct current voltage) battery, and the battery is recharged by two solar panels. The total current consumption (electronic and sensors) is 600 mA. It takes a few minutes before reading some geochemical parameters; this depends on the activation of external devices like electrovalves, pumps, etc. It should be necessary to pilot it with a small computer, to run all these operations with a normal DL. In our DL, all these operations are temporised, only once at the boot time of the data logger and then, it repeats automatically the prefixed sequence, in all successive readings. The data logger has 16 channels for digital output, ON/OFF type, and 8 digital input channels. Each one of them can send an alarm message. In the initial boot of the data logger, for each analog channel input, some parameters are memorised as: (i) Interval between successive readings. (ii) Minimum and maximum alarm value of the parameter. (iii) Pre-set to switch on and off a digital output channel at a prefixed time before the analog reading take place. (iv) Data logger with a memory for more than 6000 readings. (v) Maximum power consumption is when the data are discharged via radio. The acquired data, stored in the DL memory, can be remotely discharged through a radio link. If some parameters Geochem. Trans., 2001, 5
This journal is # The Royal Society of Chemistry and the Division of Geochemistry of the American Chemical Society 2001
Table 1 Sensor characteristics
Table 3 Specific characteristics for the different system
Specific characteristics for the H2S electrochemical sensor Model number BSO119 Resolution 0.1 ppm Range of measurement 0–50 ppm Temperature coefficient ¡0.3% signal uC21 Specific characteristics for the SO2 electrochemical sensor Model number BSO111 Resolution 0.1 ppm Range of measurement 0–20 ppm Temperature coefficient ¡0.1% signal uC21 Specific characteristics for the CO2 sensor. The sensing element is an infrared spectrophotometer Model number BSO103 Resolution 10 ppm Range of measurement 0–3000 ppm Zero drift 0.1% full scale uC21 Power consumption 250 mA
Direct computer connection Baud rate Radio modem Baud rate Frequency Maximum distance Cellular modem Baud rate Frequency Coverage
reach values outside the fixed maximum and minimum, a window will automatically send an alarm message. This possibility is a good improvement because it is possible to discharge the data during the day, when the batteries are recharged by the solar panels. This configuration is a good compromise between electric power saving, data archive for research purposes and their immediate disposability for geochemical surveillance of volcanic activity. 2. Sensors. Each remote station is equipped with sensors for: CO2, SO2, H2S and meteorological parameters. The chemical sensors are manufactured by LSI S.p.A. (Laboratori Strumentazione Industriale). The electronic weather monitor (temperature internal and external, relative humidity, barometric pressure, wind speed and direction, rainfall) is a Wm-918, furnished by the Huger Electronics GmbH. The block diagram of the developed station is reported in Fig. 1. 3. Transmission system. The acquired data can be transmitted through direct computer interfacing using RS232, radio modem and cellular modem connection. Table 2 Specification of the electronic weather station Internal temperature Measuring range Accuracy Resolution External temperature Measuring range Accuracy Resolution Relative humidity Measuring range Accuracy (at temp. range 15 to 40 uC) Resolution Barometric pressure Measuring range Accuracy (at temp. range 0 to 50 uC) Resolution Wind speed Measuring range Accuracy (at temp. range 220 to 60 uC) (1) range 2 to 10 m s21 (2) range 10 to 56 m s21 Resolution Wind direction Measuring range Accuracy Resolution Rainfall Daily and cumulative measuring range Rainfall rate measuring range
Geochem. Trans., 2001, 5
0 to 50 uC ¡1 uC 0.1uC typical
from 600 to 9600 bps 600 or 1200 bps VHF or UHF 150 km 9600 bps 900 MHz Depending on the company
Laboratory test In order to verify the performance of the automatic system one month of measurement has been spent in the laboratory. The acquired data regarding CO2, SO2, and H2S concentrations in the atmosphere, internal and external values of temperature, relative humidity and atmospheric pressure, have been reported in Fig. 2. In the same figure a calibration signal of 1000 mV has also been plotted, it has been divided by ten in order to plot all signals in the same figure. Very constant values of this last parameter, (1000 ¡ 2 mV) indicate the good performance of the overall electronics. In other words, the potential error introduced by the electronics of the system is ¡0.2% of the signal. The concentration values of SO2 and H2S have been multiplied by ten in order to plot all signals in the same figure. The output of both sensors was stable, exhibiting variations in the range ¡0.1 ppm. The concentration values of CO2 in Fig. 2 have been divided by ten. All recorded values, corrected for the zero shift, are in the range 350–700 ppm. The peaks have been recorded during daytime when people were working in the lab. Data acquired from 23rd December to the end of the month (holiday period) exhibit CO2 concentration values in the range 350–450 ppm. Temperature changes of a few degrees have been observed in both sensors (internal and external to the box of the station). Of course, the internal sensor always showed higher temperature values than the external one. The same pattern can be observed for what concerns internal and external relative humidity. Naturally, in the last case, the range of variations is wider. Finally, as expected, small changes of a few millibars of pressure have been recorded. All the tested sensors show a very good long-term stability with any drifts of the signal.
240 to 60 uC ¡2 uC 0.1 uC typical 10 to 97% RH ¡5% RH 1% RH 795 to 1050 mbar ¡7 mbar 1 mbar 0 to 56 m s21 — ¡1 m s21 ¡10% 0.2 m s21 0 to 359u ¡8u 1u 0 to 9999 mm 0 to 998 mm h21
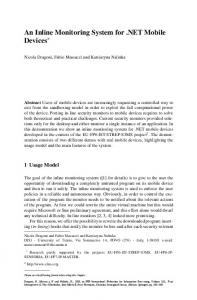
Fig. 1 Block diagram of the automatic station for the continuous monitoring of CO2, H2S, and SO2.
Fig. 2 Hourly data from the automatic system for continuous monitoring of CO2, H2S and SO2, and meteorological parameters recorded in the laboratory.
Field experiments As regards the field test, the Solfatara of Pozzuoli has been selected. The choice of this area has been suggested both for logistic problems (easy to reach) and for the presence of detectable amounts of CO2, H2S and SO2 in the atmosphere. In fact, inside the Solfatara crater there are several fumaroles and intense soil degassing. Previous studies on the concentration of CO2 and H2S in the atmosphere of this area7 clearly indicate the presence of a gas hazard. The automatic station has been placed inside the Solfatara on the eastern side at a distance of about 200 m from the ‘Bocca Grande’ and from the ‘Stufe’ fumaroles (Fig. 3). The choice of the location of the monitoring site was a consequence of the location of the main fumaroles that are chiefly located on the eastern side of the Solfatara. The station worked for about one month (18th June–12th July 1999) without any technical problems. The atmospheric
gases were pumped through a Teflon tube with the open external side placed at 1 m from the ground. The pump outlets were connected to the sensors in series. The selected frequency of measurements was 1 h. The wind speed during the period of observation was in the range 0–5 m s21 and the dominant direction was from N–NE (220u). Data related to CO2, H2S, and SO2 are reported in Fig. 4a, 4b, and 4c, respectively. For the CO2 content, variations from about 600 to 2000 ppm have been observed. H2S ranged between 1 and 4 ppm while SO2 changed between 1 and 9 ppm vol. Naturally, the content of the three gases in the atmosphere depends on several factors: (i) strength and location of the source; (ii) meteorological parameters and morphology of the area; (iii) reactions during the transport. During the period of observation we assume that the strength and the location of the source have been constant, as well as the morphology of the area. The observed variations could mainly be related to the other factors such as meteorological parameters and chemical reactions during the transport. Among the investigated species CO2 can be considered, from a chemical point of view, an inert gas while H2S and SO2 can initiate chemical reaction during the transport. In this context we will first analyse the behaviour of CO2 and that of the two other species. CO2 variations
Fig. 3 Map showing the location of the monitoring system inside the Solfatara crater of Pozzuoli.
No clear relationship was found between wind direction and CO2 concentrations. On the other hand, the station was surrounded by gas emissions in all directions. A clear relationship instead was found between CO2 and the wind speed (Fig. 5). Since the wind speed was lower than 4 m s21, the CO2 concentrations changed in a wide range with the amplitude of the variations, generally decreasing as the wind speed increased. With the wind speed above 4 m s21, the CO2 concentration reached a value close to 600 ppm. This value seems to be the background value of the CO2 content in the atmosphere of the Solfatara. Considering that the wind speed is an extremely variable parameter, we computed for each class of wind speed (0–1, 1–2 … 4–5 m s21) the medium value of CO2 concentration. And we have associated this value with a medium value of wind speed for each class. The obtained results are reported in Fig. 6 where it is possible to emphasize a good correlation between both examined parameters. Geochem. Trans., 2001, 5
Fig. 6 Correlation between CO2 and wind speed.
Fig. 7 Inverse correlation between CO2 and wind speed.
H2S and SO2 variations
Fig. 4 (a) CO2 variations in the measuring point of Solfatara of Pozzuoli during the period 18th June–12th July. (b) H2S variations in the measuring point of Solfatara of Pozzuoli during the period 18th June–12th July. (c) SO2 variations in the measuring point of Solfatara of Pozzuoli during the period 18th June–12th July.
The inverse correlation between CO2 and the wind speed can also be observed using average values calculated for every hour of the day (see Fig. 7). During the night a decrease in wind speed and an increase in CO2 concentration are often observed (Fig. 7). The same behaviour has been observed in other volcanic areas investigated to evaluate the gas hazard.8)
As shown in Fig. 4b and 4c, H2S and SO2 concentrations changed in a wide range. The frequency of variations was very high while their amplitude, as observed for CO2, was related to the wind speed. With the wind speed above 4 m s21 the concentrations of the two gases reached their background values close to 2 ppm (Fig. 8). No clear correlation was found between H2S and SO2 for the whole period of observation. If we consider a twelveterms moving average of H2S and SO2 concentrations (Fig. 9), periods of good correlation (from 19th to 30th June) can be observed. On the contrary, there are periods that exhibit significant changes in the SO2 content at rather constant H2S values. On the other hand, the abundance of H2S and SO2 in the atmosphere is highly dependent on the strength of the source as well as the chemical reactions during the transport. The H2S content in the source gases (fumaroles) was 0.05% vol. The SO2 content was below the detection limit of the analysed fumarolic gases (5 ppm by gas chromatography), the H2S/SO2 ratio being higher than 100. This ratio is completely different from the ratio measured in the atmosphere that changed between 1 and 0.1, it is 2–3 orders of magnitude lower than that of the source gases. The explanation for this observation must take into account the reaction during the transport. The most probable reactions that produce SO2 starting from H2S are the following: H2 SzO3 ~SO2 zH2 O H2 SzO~OHzHS H2 SzOH~HSzH2 O
Fig. 5 Correlation between CO2 and wind speed.
Geochem. Trans., 2001, 5
These reactions are completed in the following way:9
Fig. 9 Moving average of H2S (lower part of the picture) and SO2 concentration values.
Fig. 8 (a) Correlation between H2S and wind speed. (b) Correlation between SO2 and wind speed.
HSzO2 ~SOzOH HSzO~SOzH SOzO~SO2 SOzO2 ~SO2 zO SOzO3 ~SO2 zO2 These mechanisms depend on the temperature, humidity, aerosol, particulate, insulation, and are characterized by rather different kinetics. It is not possible to clarify all possible oxidation mechanisms than can take place inside the Solfatara with the acquired data, even though the variability of the H2S/ SO2 ratio (from 100 in the fumaroles to 1 or 0.1 in the atmosphere), gives evidence of the H2S oxidation.
Conclusions The automatic apparatus developed in this study after the laboratory tests was successfully tested inside the Solfatara of
Pozzuoli. All sensors gave a very good performance in terms of stability and reliability as well as the electronic aspect. The CO2, H2S and SO2 concentrations changed in a wide range in certain correlation with the wind speed. Above a wind speed of 4 m s21 all three monitored species reached a constant value of 600 ppm for CO2, and about 2 ppm for H2S and SO2. These values seem to be the background values inside the Solfatara. The low H2S/SO2 ratio (1–0.1) measured in the atmosphere, compared to the same ratio in the fumarolic gases (100) clearly indicates that H2S undergoes severe oxidations during the transport in the atmosphere. The developed system is able to operate for a long time in severe corrosive conditions, in remote areas with no electric power supply, and is a powerful apparatus to control the gas hazard in volcanic and some industrial areas.
References 1 B. Badalamenti, S. Gurrieri, S. Hauser, F. Parello and M. Valenza, Rend. Soc. Ital. Mineral. Petrol., M. Carapezza Memorial Volume, 1988, 43(4), 893. 2 B. Badalamenti, S. Gurrieri, S. Hauser, F. Tonani and M. Valenza, Rendiconti SIMP, 1984, 39(2), 367. 3 G. Chiodini, F. Frondini and B. Raco, Bull. Volcanol., 1996, 58, 41. 4 T. M. Gerlach, Eos Trans., 1991, 72, 249. 5 G. Graziani, A. Martilli, M. T. Pareschi and M. Valenza, J. Volcanol. Res., 1997, 75, 283. 6 M. Carapezza, P. M. Nuccio and M. Valenza, Bull. Volcanol., 1981, 44, 547. 7 M. Carapezza, S. Gurrieri, M. Nuccio and M. Valenza, Bull. Volcanol., 1984, 47(2), 287. 8 B. Badalamenti, M. Carapezza and A. Scalzo, Gas hazard assessment in a densely inhabited zone near Rome (Cava dei Selci, Alban Hills), in preparation. 9 R. A. Cox and F. S. Sandalls, Atmos. Environ., 1974, 8, 1269.
Geochem. Trans., 2001, 5