roles and decrease overall life satisfaction. A preliminary investigation of the work and non work influences that contributed to faculty role conflict and overall life ...
Articles Effects of Work, Non Work, and Role Conflict on the Overall Life Satisfaction of Pharmacy Faculty Kavita V. Nair and Caroline A. Gaither1 College of Pharmacy, University of Michigan, 428 Church Street Ann Arbor, Ml 48109-1065 For many faculty members, the demands of work and personal lives can lead to conflict between the two roles and decrease overall life satisfaction. A preliminary investigation of the work and non work influences that contributed to faculty role conflict and overall life satisfaction was conducted. Data were collected via a questionnaire, and responses were received from 63 percent of faculty contacted. Respondents were only moderately satisfied with their lives and identified being married, receiving social support from spouses or mates and socializing with friends as non work influences that were related to life satisfaction. Many of these same influences were related to role conflict. Time spent at work was the only work influence that correlated with role conflict (positive) and overall life satisfaction (negative). Differences were also found across selected demographic characteristics. These findings suggest a model that can be used to study work and non work influences on faculty role conflict and overall life satisfaction.
INTRODUCTION
For many faculty members there seems to be an absence of a clear boundary separating their work and their personal lives(1). The centrality of academic roles in the lives of faculty has been extensively investigated, and past research has shown that the typical faculty member regularly works more than forty hours per week, has flexible work schedules that extend into evenings and weekends, and spends a significant amount of time working at home both during the week and on weekends(2-7). In addition, faculty members appeared to limit their social friendships to academic colleagues(8), and tended to tie their vacations to their work by scheduling them to coincide with vacation or work-related conferences(2). Thus it appears that for this group of professionals, work and life away from work (i.e., non work) is a “seamless web” wherein the career is both a vocation and avocation(9). This research suggests that influences outside of work in a faculty member’s life (i.e., non work) play an important role in determining their performance at work as well as in predicting their overall life satisfaction. While the overlap between work and non work may be rewarding, it has the potential to be very stressful. The seamlessness between home and work may allow the work to become obtrusive and all-consuming(10). Research outside of pharmacy indicates that many of the same factors (i.e., irregular work schedules, long hours, high job involvement) that make a faculty’s work and non work life a “seamless” web also cause a high level of role conflict(11). Kopelman et al. (12) define role conflict as the “the extent to which a person experiences pressures within one role that are incompatible with the pressures that arise in 1
Corresponding author
another role”. Role conflict arises due to multiple commitments to different domains of an individual’s life(13). For example, commitment in the non work domain could include participation in activities such as parenting, community work (church or other non-profit organizations), and recreation(14). The conflict between work and non work can be expressed in variety of ways. Greenhaus and Beutell(11) suggest three types of conflict between the work and non work domain: time-based conflict (time spent in one domain affects performance in another domain), strain-based conflict (strain symptoms such as distraction, frustration, inability to relax and irritation experienced by the individual in one domain affects performance in another domain), and behavior-based conflict (where behaviors such as aggression and objectivity required in one domain affect behaviors needed in another domain). Time- and strain-based conflict have received the most empirical support. Studies examining faculty work satisfaction provide evidence for the conflict between the work and non work domains. A Carnegie Foundation study indicated that the extent to which work intruded into a faculty’s personal life was a primary factor influencing overall dissatisfaction as well as satisfaction(15). Another study of the development of faculty careers revealed that tensions between the private and professional lives constrained both the personal and professional career aspirations of the faculty members(1). This study indicated that a continuous tension existed between the demands of personal and family life and the requirements of professional success(1). These findings suggest that conflicting role demands between a faculty member’s professional and personal life can be a source of anxiety for them and may influence their levels of overall life satisfaction. Therefore, the conflict between the work and non work lives of faculty could also be an
American Journal of Pharmaceutical Education Vol. 63, Spring 1999
1
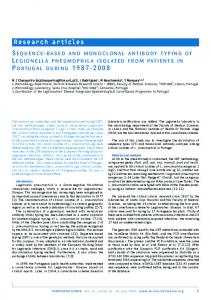
Fig. 1. Relationships between the work and non work influences, gender, role conflict and overall life satisfaction.
important predictor of their overall life satisfaction(1). Much of the research in pharmacy has focused on the work domain of faculty. Studies have focused on the potential predictors of job satisfaction and job stress and the extent of burnout among pharmacy faculty(16-19). These studies indicate that faculty job satisfaction is quite high and comparable to faculty outside of pharmacy(20). Pharmacy faculty members were found to experience a low to moderate level of burnout (with certain groups of faculty experiencing more, i.e., younger faculty)(17). Pharmacy researchers have also identified some evidence of the existence of role conflict. Jackson et al. (17) identified conflict between job duties and family responsibilities among the top ten conditions producing stress in pharmacy faculty. In another study that compared female faculty members in the United States and Canada, 28 percent of the American faculty reported experiencing “major problems” in balancing family responsibilities and workloads(19). Finally, a study by Wolfgang found that time conflict between work and personal activities was one of the top ten “stress producing” job situations for pharmacy faculty(18). While satisfaction with the work domain of faculty within and outside of pharmacy is quite high (76 percent of faculty rated job satisfaction as satisfactory or very satisfactory), the assessment of job satisfaction may fail to fully reflect the tensions and conflicts caused by a high level of commitment to and investment in both the work and non work domains(4). Individuals may not be unhappy with either parts of their lives, yet still feel torn between the demands of each. Studies from the 1970’s indicated that faculty were highly involved with their work roles and had little involvement with family roles(21). More recent studies indicate a high level of conflict for both male and female faculty between the negotiation of the work and non work roles (22). The results of studies investigating the life satisfaction of male and female faculty have been mixed(4,23,24). Several studies have found gender differences in work and non work satisfaction, while other studies have found no differences due to gender(4,23,24). One explanation may be that males and females hold similar work values based 2
on both the socialization process of graduate school and relatively equal occupational status, therefore leading to no differences in regards to gender. On the other hand, many women faculty still bear the burden of family responsibilities in dual-career families and gaps still exist between men and women in regards to pay, promotion and opportunities for grants and administrative posts which can lead to greater dissatisfaction for women faculty(25). Therefore the effects of gender on faculty life satisfaction needs investigation. Given the importance of non work influences in the lives of academics, the overall purpose of this study was to further an understanding of the ways in which work and life away from work are related to role conflict and overall life satisfaction for pharmacy faculty. As no previous investigations have addressed these relationships for this group, this study provides preliminary data on possible relationships between these constructs. In addition, the study examines how gender, marital status, academic rank, number of dependent children and the amount of time spent in work and non work activities may be differentially related to role conflict and life satisfaction, respectively for pharmacy faculty. OBJECTIVES AND STUDY FRAMEWORK
Based on the preceding literature, the following objectives were developed: 1. Investigate the relationships between selected demographic characteristics, work and non work influences, and role conflict for pharmacy faculty. 2. Examine the relationship between role conflict and overall life satisfaction of pharmacy faculty. 3. Identify the work and non work influences on role conflict and overall life satisfaction for pharmacy faculty. The study framework is adapted from a model of life satisfaction developed by Olsen and Near(4). In this model, characteristics of the work and non work domains are viewed as causes of work and non work satisfaction, which in turn influence overall life satisfaction. In addition, characteristics of the work and non work domains
American Journal of Pharmaceutical Education Vol. 63, Spring 1999
also influence overall life satisfaction through the mediating effects of role conflict between the two domains. However, work and non work satisfaction may not be the best predictors of role conflict, as individuals may not be dissatisfied with either their work or non work roles but may experience conflict in trying to balance both domains(4). Therefore, for this study, work and non work satisfaction was not assessed. The proposed model serves as a framework to assess the unique associations between work and non work domain characteristics, role conflict and overall life satisfaction. A visual representation of the above objectives is shown in Figure 1. As there is limited research on pharmacy faculty in this area, this study is an initial investigation that examines the relationship between the proposed constructs. The study is exploratory in nature and focuses on suggesting relationships on which future research can be based. METHODS
Study Sample. The sample consisted of faculty members (n=68) from a college of pharmacy in a large mid-western university. The sample included tenure and non-tenure track faculty with at least a 50 percent appointment to the college. Adjunct faculty were excluded. Measures Overall Life Satisfaction. Life satisfaction was measured using a general question on overall life satisfaction rated on a five-point scale. Respondents were asked to indicate to what extent they agreed with the statement, “I am very satisfied with my present lifestyle”. Subjects responded using a five-point scale: To no extent at all (=1), to some extent (=2), moderately (=3), to a good extent (=4) and to a great extent (=5). Linn et al. (26) used a similar scale to measure satisfaction with life in general in a sample of medical school faculty. Non Work Domains Influencing Overall Life Satisfaction. The non work domains examined in this study were identified from a study by Kirchmeyer(27) and adapted for the study’s respondents by sending electronic messages to a selected sub sample of faculty. The electronic message consisted of an open-ended question that asked the study participants to indicate the non work domains they participated in outside of their work. Based on the results of the electronic message, three non work domains were examined in this study: social support from a spouse or a partner for one’s work (two items), involvement in community activities such as religious congregations and volunteer groups (one item) and socializing with friends (two items). Two items developed by Holohan et al. (28) were used to measure the extent of social support received from a spouse or partner for one’s work, i.e., “My spouse/mate provides me with a great deal of emotional support for my work” and “My spouse or mate is very supportive of the work I do.” Subjects responded using a five-point scale (1 = to no extent at all, 5 = to a great extent). For the other non work domains, items were developed specifically for this study. Regarding the domain of community involvement, respondents were asked to what extent they agreed with the statement, “I am an active member of various volunteer groups such as church and other community groups”. Similar statements were developed for assessing
involvement in other non work domains. Subjects responded using the same five-point scale described previously. In addition, information on marital status and number of dependent children was collected. Role Conflict Between Work and Non Work Domains. Role conflict was operationalized using time-and strainbased conflict(11). Six items, based on a scale by Shamir et al. (29) were used to measure time-based conflict which included working on weekends and vacations (one item), being unable to spend time with the family (three items), spending most evenings doing work-related activities (one item), and being free to do what one liked after work (one item). Seven items from an eight-item index developed by Kopelman et al. (12) were used to measure strain-based conflict. Respondents were asked to evaluate the extent to which they experienced certain feelings of strain in moving from one domain to another which included feelings of difficulty, tiredness, distraction, irritability, inability to relax, needing to talk about their frustrations and demands placed on their health. These items were rated on the same five-point scale mentioned previously. Work Domains Influencing Overall Life Satisfaction. Five items were used to represent the work domains. These items included the amount of time spent at work per week, academic rank (assistant, associate or full-professor), highest academic degree earned, discipline, and social support obtained from co-workers (two items). These items were similar to ones used in a previous study of faculty (1) and were felt to adequately represent the work domain. Items measuring co-worker social support were developed specifically for the study and were based on those used by Wolfgang(30) in a study of pharmacists. Perceptions of the Centrality of Work. In order to determine the extent to which work is a central component of the lives of faculty, three items, developed specifically for this study, were used. Faculty were asked to indicate on the five-point scale previously described to what extent they wanted to be recognized as a high level professionals. They were also asked to indicate the extent to which they wanted to maximize their personal development, and the extent to which they felt that they could use their talents and abilities outside of work. Time Spent Doing Work and Non Work-Related Activities. In order to determine the amount of time that faculty members spent doing work and non work activities in an average week, respondents were asked to indicate the number of hours per week that they spent doing various activities. The different activities included time spent at work, time spent doing work-related activities outside of work (such as reading journal articles), time spent in recreational activities (such as jogging), time spent in social activities (such as visiting friends), time spent in participative activities (such as engaging in a favorite hobby) and time spent in maintenance activities (such as housekeeping activities). Information was also collected regarding gender and years in an academic position. Data Collection The above information was put into a two-page ques
American Journal of Pharmaceutical Education Vol. 63, Spring 1999
3
Table I. Demographic characteristics of the study sample (N=43) Demographic characteristics Percent response Gender Male 56 Female 44 Number of dependent children 0 children 34 1 child 30 2 or more children 36 Highest degree earned PharmD 50 PhD 43 MS/Other 7 Marital status Married 78 Divorced/Separated 12 Never married 10 Academic rank Assistant Professor 36 Associate Professor 33 Full Professor 21 Other (Lecturer/Instructor) 10 Years in academia 0-7 years 17 8-15 years 44 15 or more years 39 Discipline Clinical Practicea 57 Pharmaceutics 18 Medicinal Chemistry 15 Pharmacy Administration 10 a
Includes clinical, non tenure and tenure track faculty.
tionnaire. The questionnaire was placed in the mail boxes of all faculty members at the college of pharmacy. Prior to receiving the questionnaire, faculty were sent an electronic mail message indicating that they would be receiving a questionnaire regarding their work and non work lives and that their response was needed. The questionnaires were not coded in any fashion to assure anonymity. Approximately two weeks later, a second electronic message was sent to all faculty thanking them for their participation and urging those who did not respond to do so as soon as possible. Data Analysis
Two types of analyses were performed to examine the relationships between the variables in the study. First, bivariate relationships were examined between selected demographic characteristics, non work influences and role conflict, respectively using Student’s f-tests and one way analysis of variance followed by Scheffe’s post hoc comparisons. Second, zero order correlations were computed to examine the associations among the variables in the suggested model. The decision to limit the analyses to examining correlations among variables was due to the exploratory nature of the study. SPSS for Windows 6.0 was used for the analyses and the significance level was determined at P< 0.10. RESULTS
The aforementioned data collection procedures resulted in a response rate of 63 percent (n = 43). As shown in
4
Table II. Average time spent at work and in various non work activities Average number of hours per week ± SD 48.42 ± 11.45
Time spent At work In non work activities: Doing work related activities at home 9.00 ± 5.65 In recreational activities (e.g., sports, jogging) 5.62 ± 4.52 In social activities (e.g., visiting friends, entertaining) 4.70 ± 4.48 Participative activities (e.g., in a favorite hobby) 3.83 ± 5.54 In maintenance activities (taking care of children, cleaning the house, grocery shopping, watching TV, sleeping, talking on the phone, etc.) 79.38 ±32.54 Total 150.95
Table I the majority of the sample were clinical (tenure and non-tenure track) faculty members (57 percent), married (78 percent), had a PharmD degree (50 percent) and had one or more dependent children (66 percent). Seven percent of the sample were single with dependent children and 14 percent were single with no dependent children. The sample had approximately equal numbers of male (56 percent) and female faculty members (44 percent). An equal number of male and female faculty had dependent children (27 percent and 26 percent, respectively). Each of the academic units within the college of pharmacy was represented. Table II shows the distribution of time spent in work and non work activities. Pharmacy faculty spent an average of 48 (SD = 11.45) hours per week at work (range 23 - 70 hours) and an average of 18 (SD = 8.82) hours per week (range = 2 - 32.75 hours) in various non work activities. On average, nine hours were spent outside of work hours doing work-related activities such as reading journal articles, grading student assignments and preparing lecture notes (range = 0 20 hours). Faculty spent approximately six hours or less a week socializing with friends, engaging in a recreational activity, or engaging in a favorite hobby (range = 0 - 2 0 hours for all activities). Most of the time spent outside of work appeared to be devoted to various maintenance activities such as cleaning the house, grocery shopping and sleeping (range = 30 - 117 hours). Approximately 17 hours of the week were not accounted for by our sample. Descriptive Statistics for the Study Items
The means, standard deviations and frequency distributions of the items are presented in Table III. The non work influence with the highest mean was social support received from a spouse or mate for one’s work (mean = 4.00). More than two thirds of the respondents (76.9 percent) agreed to a large extent that their spouse or mate provided them with emotional support for their work. Faculty did not appear to be actively involved in socializing with friends (mean = 2.30) or in community-related activities (mean = 1.98). Approximately half the sample (46 percent) reported that they were not active members in various community activities. Faculty were also more
American Journal of Pharmaceutical Education Vol. 63, Spring 1999
Table III. Descriptive statistics for all study items Mean
SD
(5) Great extent
4.00
0.95
33.3
43.6
12.8
10.3
0
3.78 2.30 3.00
1.18 1.21 1.30
30.8 7.0 16.3
38.5 11.6 20.9
12.8 14.0 20.9
12.8 39.5 30.2
5.1 27.9 11.6
1.98
1.23
9.3
4.7
7.0
32.6
46.5
3.31 3.35 2.73 2.56 3.44 2.84
1.10 1.11 1.15 1.26 1.24 1.23
19.0 18.6 9.3 9.3 20.9 16.3
21.4 27.9 16.3 16.3 34.9 9.3
31.0 23.3 20.9 16.3 20.9 25.6
28.6 30.2 44.2 37.2 14.0 39.5
0 0 9.3 20.9 9.3 9.3
2.63 2.70
1.20 1.29
7.3 9.3
19.5 18.6
19.5 27.9
36.6 20.9
17.1 23.3
3.00
1.30
20.9
18.6
25.6
23.3
11.6
2.81
1.16
9.3
20.9
20.9
39.5
9.3
2.81 2.80
1.16 1.16
4.7 11.9
30.2 14.3
20.9 19.0
30.2 47.6
14.0 7.1
2.81
1.30
14.3
19.0
11.9
42.9
11.9
Centrality of work: 19. I want to maximize my personal development 20. I want to be recognized as a high level professional 21. I use a lot of my talents and abilities away from work
4.40 4.53 3.24
0.77 0.74 1.12
56.1 67.4 16.7
26.8 18.6 26.2
17.1 14.0 21.4
0 0 35.7
0 0 0
Work domains: 22. I can talk to my co-workers about my personal concerns and difficulties 23. I have a number of close friends at work
2.57 2.74
1.13 1.18
7.1 9.3
16.7 20.9
14.3 46.5
50.0 9.3
11.9 0
Overall life satisfaction: 24. I am very satisfied with my present lifestyle
2.98
1.16
7.1
31.0
26.2
23.8
11.9
Item description Non work influences: 1. My spouse or mate is very supportive of the work that I do 2. My spouse or mate provides me with a great deal of emotional support for my work 3. I visit informally with friends more that once a week 4. I prefer to make friends outside of work 5. I am an active member of various volunteer groups such as church and other community groups Role conflict (Time-based conflict): 6. I am free to do what I like after I get off work 7. My work takes away from my weekend and vacation time 8. I spend most of my evenings doing work-related activities 9. I frequently have to go to work when I am needed at home 10. I spend most evenings with my family 11. My work takes up the time I’d like to spend with my family Role conflict (Strain-based conflict): 12. My job makes it difficult to be the kind of parent or spouse that I would like to be 13. My work puts great demands on my health 14. After work, I often come home too tired to do some of the things that I like to do 15. After a frustrating day at work, I remain distracted for the rest of the day 16. After a frustrating day at work I talk to someone about my frustrations 17. After a frustrating day at work I am often irritable at home 18. The demands of my job make it difficult for me to be relaxed at home
a
(4) Good extent
(3) Moderately
(2) Some extent
(1) No extent
b
Mean scores were based on a Likert scale ranging from 1 = agree to no extent at all to 5 = agree to a great extent.
inclined to engage in social relationships outside of work (mean = 3.00). Overall, pharmacy faculty experienced moderate amounts of role conflict (average of all time-and strainbased conflict items = 2.90) between their work and non work lives. They experienced moderate amounts of time conflicts between their work and non work roles (average of all time conflict items = 3.04). In particular, they felt that their work takes away from their weekend and vacation time (mean = 3.35). However, a majority of pharmacy faculty (55.8 percent) spent most evenings with their family. Approximately, 40 percent of the respondents agreed to a large extent that they were free to do what they liked after work. In a similar fashion, pharmacy faculty appeared to experience moderate amounts of strain-based conflict in the form of tiredness, distraction and irritation when they got home after a day’s work (average of all strain conflict
items = 2.80). A majority of the sample experienced at least some amounts of irritability (47.6 percent) and distraction (39.5 percent) when they got home from work. As to be expected from this group of professionals, work appeared to be a central part of their lives. Eighty-six percent of the respondents agreed to a large extent that they wanted to be recognized as a high level professionals. In addition, pharmacy faculty felt strongly about maximizing personal development (mean = 4.40). A majority of the sample felt (42.9 percent) that they could use their talents and abilities to a large extent outside of work. Turning to overall life satisfaction, pharmacy faculty were only moderately satisfied with their present lifestyles. Approximately 12 percent were not satisfied at all. Relationships Between Demographic Characteristics and Study Variables
Gender. Student’s t-tests revealed significant differences
American Journal of Pharmaceutical Education Vol. 63, Spring 1999
5
Table IV. Relationships between gender, non work influences and role conflict Item descriptiona Gender Meanb 1. I prefer to make friends out of work Men 2.64 Women 3.32 2. I spend most evenings with my family Men 2.95 Women 3.95 3. I am free to do what I like after I get off work Men 3.54 Women 2.94 4. After a frustrating day at work I talk to someone about my Men 2.23 frustrations Women 3.37 5. I want to maximize my personal development Men 4.10 Women 4.67
SD 1.18 1.34 1.21 1.13 1.10 1.06 0.97 1.07 0.83 0.59
t (P value) 1.732 (0.091) 2.696 (0.010) 1.749 (0.088) 3.585 (0.001) 2.431 (0.083)
a
Statistically significant differences were found for the following items using an independent sample’s t- test at (P