Vol 444 | 7 December 2006 | doi:10.1038/nature05269
ARTICLES Thymic selection threshold defined by compartmentalization of Ras/MAPK signalling Mark A. Daniels1, Emma Teixeiro1, Jason Gill2, Barbara Hausmann1, Dominique Roubaty1, Kaisa Holmberg3, Guy Werlen4, Georg A. Holla¨nder2, Nicholas R. J. Gascoigne3 & Ed Palmer1 A healthy individual can mount an immune response to exogenous pathogens while avoiding an autoimmune attack on normal tissues. The ability to distinguish between self and non-self is called ‘immunological tolerance’ and, for T lymphocytes, involves the generation of a diverse pool of functional T cells through positive selection and the removal of overtly self-reactive thymocytes by negative selection during T-cell ontogeny. To elucidate how thymocytes arrive at these cell fate decisions, here we have identified ligands that define an extremely narrow gap spanning the threshold that distinguishes positive from negative selection. We show that, at the selection threshold, a small increase in ligand affinity for the T-cell antigen receptor leads to a marked change in the activation and subcellular localization of Ras and mitogen-activated protein kinase (MAPK) signalling intermediates and the induction of negative selection. The ability to compartmentalize signalling molecules differentially in the cell endows the thymocyte with the ability to convert a small change in analogue input (affinity) into a digital output (positive versus negative selection) and provides the basis for establishing central tolerance. Thymocyte selection occurs through interactions of the T-cell antigen receptor (TCR) with specific complexes of self-peptide and the major histocompatibility complex (pMHC) expressed on thymic antigenpresenting cells (APCs). Weak TCR–pMHC interactions do not support thymocyte survival (death by neglect); strong interactions lead to thymocyte apoptosis, lineage deviation or receptor editing (collectively called negative selection); and interactions between these extremes lead to the development of mature T cells (positive selection)1. The TCR is an unusual receptor that can signal different cell fates, and two models have been proposed to describe how this differential signalling occurs2. The avidity model suggests that the level of TCR occupancy determines selection outcome. This model arose from studies in which strong agonist ligands administered at extremely low doses lead to positive selection3,4. In many cases, however, the lymphocytes generated in this way develop into CD4-expressing (CD41) regulatory T cells5,6 or represent a distinct lineage of CD8aa1 T cells with regulatory properties7–9. The affinity model proposes that selection outcome is established by the affinity of the TCR for a pMHC complex. In support of this, kinetic proofreading predicts that the length of TCR engagement determines positive and negative selecting signals10,11. The importance of ligand affinity and half-life are well documented12–15. TCR–pMHC affinities measured by surface plasmon resonance (SPR) illustrate the correlation among ligand affinity, half-life and selection outcome; however, SPR experiments have been unable to resolve the contribution of the co-receptor16,17, which is known to be crucially important for the selection decision18. In addition, these assays cannot assess the contribution of TCR extrinsic factors necessary for the translation of ligand engagement such as glycosylation state19 or membrane microenvironment20.
A longstanding issue remains concerning how the TCR reads the parameters of ligand engagement and signals these distinct cell fates. The role of MAPKs in selection has been well studied21. Phosphorylation of extracellular-signal-regulated kinase (ERK) is essential for positive selection but its role in negative selection is less clear21–25. Negative selection is dependent on activation of Jun amino-terminal kinase (JNK)26; however, positive and negative selectors can activate both pathways. Therefore, it is not clear how activation of ERK and JNK establishes selection outcome unless another level of regulation controls their function. We have used the OT-I TCR to address these issues. We identified variants of the agonist peptide that define the boundary between positive and negative selection. Although ligands lying close to the selection boundary bind the TCR with only slightly different affinities, positive and negative selecting ligands organize early TCR signalling intermediates into distinct subcellular compartments. These findings elucidate part of the mechanism used by thymocytes to interpret selecting ligands and have implications for central tolerance and autoimmunity. Defining the thymic selection threshold The OT-I TCR recognizes the chicken ovalbumin peptide, SIINFEKL (OVA), presented by Kb as an agonist. We generated OVA variants to establish a hierarchy of ligands with a wide range of potencies and to narrow the gap between positive and negative selecting ligands described for this system27. Expression of CD69 is considered to be a reflection of the capacity of a ligand to induce TCR signals independent of selection outcome28. Therefore, peptides were tested for their ability to induce CD69 expression on pre-selection CD41CD81
1 Laboratory of Transplantation Immunology and Nephrology, Department of Research, University Hospital–Basel, Hebelstrasse 20, 4031 Basel, Switzerland. 2Pediatric Immunology, Center for Biomedicine and The University Children’s Hospital of Basel, Mattenstrasse 28, 4058 Basel, Switzerland. 3Department of Immunology, The Scripps Research Institute, 10550 North Torrey Pines Road, La Jolla, California 92037, USA. 4Department of Cell Biology & Neuroscience, Rutgers, The State University of New Jersey, 604 Allison Road, Piscataway, New Jersey 08854-8082, USA.
724 ©2006 Nature Publishing Group
ARTICLES
NATURE | Vol 444 | 7 December 2006
OVA Q4 Q4R7 T4 Q4H7 Q7 G4 E1
60 40 20
–14
VSV
–12 –10 –8 Log [Peptide (M)]
OVA
Q4
–6
–4
Q4R7
T4
2 µM
CD4
10 Q4H7
4 Q7
E1
G4
30
5
5
T4
20 µM 57
43
49
10
32
a
c
% of CD8 SP thymocytes
CD8β 80
OVA Q4 Q4R7 T4 Q4H7 Q7 G4 E1 VSV
CD8αβ cells
60 40 20 0 100
101
102 103 104 1/ligand potency (normalized to OVA)
105
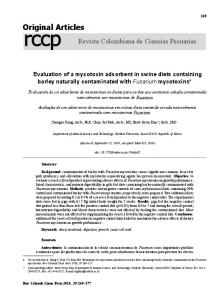
Figure 1 | Defining ligand potency and the thymic selection boundary. a, OT-I pre-selection thymocytes were stimulated with peptide-pulsed T2 Kb-expressing APCs and the CD69 response was determined. Numbers on the right represent 1/(ligand potency) normalized to OVA. b, FTOCs were performed to establish the ability of a peptide to induce positive or negative selection (presence or absence of CD8ab single-positive cells, respectively). Shown are the CD4/CD8b expression profiles for peptide doses of 2 mM (top) and 20 mM (bottom). The number in each dot plot is the percentage of CD8ab single-positive thymocytes. c, Percentage of CD8ab single-positive (SP) thymocytes generated in FTOC as a function of normalized ligand potency for all peptides at a dose of 20 mM. Error bars are s.d.
c 75
Q4R7 T4 Q4H7
–9
–8
–7
–6
–5
Log [Tetramer (M)]
b 75
6.0
6.0
6.0
5.5
5.5
5.5
OVA
25
Q4R7 Mut Kb VSV WT Kb T4 Mut Kb Q4H7 Mut Kb
ln Geometric MFI
0 –16
1 39 81 122 167 268 7,515 56,524
MFI (% of max)
b
80
by mature peripheral T cells (Supplementary Fig. 1). Despite its ability to induce negative selection at high doses in FTOC, T4 was a poor antigen for peripheral T cells. These data imply that the selection border defined in FTOC is relevant for peripheral T cells and demonstrate the sharpness of the threshold. To estimate the TCR affinity of the ligands comprising the selection boundary, we measured tetramer binding; which correlates with monomeric TCR–pMHC affinities30,31, is performed on live cells and involves the participation of CD8 (refs 32, 33). The binding characteristics of tetramers were determined on pre-selection OT-I doublepositive thymocytes at 37 uC (ref. 33). The dissociation constant (Kd) was calculated by nonlinear regression analysis and confirmed by homologous competition experiments (data not shown). The tetramer binding curves for Q4R7 (weakest negative selector), T4 (border ligand) and Q4H7 (strongest positive selector) overlapped (Fig. 2a). Their Kd values (Q4R7, 48 6 9.5 nM; T4, 55 6 10.1 nM; Q4H7, 51 6 9.1 nM; n 5 7, P 5 0.455) and their half-lives (t1/2) were not significantly different (Table 1). However, heterologous competition assays showed that Q4R7 was more efficient than Q4H7 at inhibiting the binding of OVA tetramers (data not shown). A tetramer can bind to a thymocyte through CD8 alone19, the TCR alone, or the TCR and CD8. We therefore considered the possibility that, despite quantitative similarities, there may be qualitative differences in how each ligand is bound to the thymocyte. To dissect these differences, tetramer binding in the absence of CD8 participation was quantified by using Kb tetramers carrying the D227K mutation (hereafter termed the Kb mutant), which precludes CD8 binding34. Without CD8 participation, binding differences between Q4R7 and Q4H7 were readily seen (Q4R7 Kb mutant, 282 6 49 nM; Q4H7 Kb mutant, 721 6 51 nM; n 5 4, P # 0.02). The Kd for the T4 Kb mutant tetramer (576 6 97 nM) lay between that of the Q4R7 and that of Q4H7 Kb mutant tetramers. We determined binding to CD8 on preselection double-positive thymocytes using wild-type Kb tetramers loaded with the null peptide VSV (Fig. 2b and Table 1). The Kd of Kb binding to only CD8 (490 6 89 nM) was similar to the Kd of T4 Kb mutant tetramers binding to only the OT-I TCR (576 6 97 nM; n 5 4, P 5 0.29). Therefore, at the boundary between positive and negative selection, the pMHC affinity for the TCR was roughly equal to its affinity for CD8. To evaluate the individual contributions of the TCR and CD8 to ligand binding, tetramer dissociation assays were done in the
MFI (% of max)
a
% of CD69+ thymocytes
double-positive thymocytes from OT-I transgenic Rag2/2b2m2/2 mice (hereafter called ‘pre-selection OT-I double-positive thymocytes’). Potencies were calculated by correcting the effector concentration for half-maximum response (EC50) values for small differences in peptide affinity for Kb and were normalized to OVA (Fig. 1a and Supplementary Fig. 1). The selection potential of ligands was tested in fetal thymic organ culture (FTOC)29. OVA, Q4 and Q4R7 induced a loss of doublepositive thymocytes, generated only limited numbers of CD42CD8b1 (CD8ab single-positive) thymocytes and were classified as negative selectors. In contrast, Q4H7, Q7, G4 and E1 induced positive selection, resulting in substantial numbers of CD8ab single-positive thymocytes29 (Fig. 1b). By plotting 1/(ligand potency) versus the production of CD8ab single-positive cells (Fig. 1c), an abrupt transition from positive to negative selection was observed. The weakest negative selector, Q4R7, was only twofold more potent than the strongest positive selector, Q4H7. Importantly, altering peptide dose did not change the selection outcome in FTOC. Q4R7 remained a negative selector and Q4H7 remained a positive selector over a broad range of concentrations (data not shown). T4 was the only peptide that showed variation in selection outcome on the basis of peptide dose (Fig. 1b). The potency of the T4 peptide was between Q4R7 and Q4H7. In addition, only negative selecting ligands (OVA . Q4 . Q4R7) induced a Ca21 flux or cytolysis
Q4R7
5.0
5.0 0
Q4H7 6.0
5.5
5.5
5.0
5.0 100
5.0 0
100
6.0
0
T4
100
G4
0
100
anti-CD8β anti-Vα2
0
100
Time (s)
25 –9
–8
–7
–6
–5
Log [Tetramer (M)]
Figure 2 | Ligand affinity and contributions of CD8 and TCR to ligand binding. a, b, OT-I double-positive thymocytes were incubated at 37 uC with Kb (WT) tetramers (a) or Kb D227K (Mut) tetramers (b), and tetramer binding was quantified by flow cytometry. A representative experiment (n $ 6) is shown. c, Pre-selection thymocytes were stained with tetramers as in a, and then incubated with monoclonal antibody to either Va2 or CD8b to prevent rebinding of dissociating tetramers. Tetramer binding is shown as the natural log (ln) of the geometric MFI versus time (n $ 3). 725
©2006 Nature Publishing Group
ARTICLES
NATURE | Vol 444 | 7 December 2006
The spatial compartmentalization of Ras These data raise the issue of how, at the selection border, a small increase in ligand affinity leads to subtle changes in p23-f and ZAP-70 phosphorylation, but to marked changes in downstream signalling events. Studies suggest that the kinetics of ERK induction is dependent on the subcellular localization of both ERK and its upstream intermediates35,36. To examine the role of cellular localization of signalling molecules in thymic selection, pre-selection OT-I double-positive thymocytes were stimulated as in Fig. 3 and analysed by confocal microscopy. On stimulation, ZAP-70 is
a
b 100
50
125
T4 Q4H7
75 100 200 Time (s)
c
Q4R7
OVA
OV A
Tet Time (min) p23 pζ p21
VSV
300
100 200 Time (s)
Q4
Q4R 7
T4
300
Q4H7
30
Signalling kinetics at the selection threshold Given these subtle differences, we wanted to determine how positive and negative selecting ligands induce divergent signals. Kb tetramers were used to stimulate pre-selection OT-I double-positive thymocytes. Tetramer concentration was adjusted to achieve equal thymocyte occupancy for each ligand (Fig. 3a–e). OVA tetramers induced maximal Ca21 flux, whereas the null ligand gave no response. The negative selector Q4R7 induced a rapid flux, whereas the positive selector Q4H7 induced Ca21 flux at a slower rate (Fig. 3b). The 23kDa phosphorylated species of CD3-f (p23-f) was efficiently induced by stimulation with OVA tetramer. Although the kinetics remained similar, induction of p23-f and ZAP-70 phosphorylation decreased incrementally in line with ligand potency (OVA . Q4 . Q4R7 . T4 . Q4H7; Fig. 3c, e, and data not shown). The induction of p23f and ZAP-70 phosphorylation by VSV resembled the non-stimulated control. Induction of LAT phosphorylation was quantitatively and kinetically distinct between negative and positive selectors (Fig. 3d, e). The negative selectors OVA, Q4 and Q4R7 induced a strong early peak of LAT phosphorylation that gradually declined over time. In contrast, T4 and the positive selector Q4H7 were weak inducers of LAT phosphorylation at all time points and the peak of LAT phosphorylation was delayed. Stimulation with OVA induced strong and transient ERK phosphorylation, peaking at ,1 min. The peak of ERK phosphorylation for the negative selectors Q4 and Q4R7 was slightly delayed, and the amount of phosphorylation induced correlated with the potency of the ligands (OVA . Q4 . Q4R7). However, the positive selector Q4H7 induced less phosphorylation of ERK more slowly. Thus, beginning with LAT, positive and negative selectors induced signals in a quantitatively and kinetically distinct manner. This observation cannot be explained by differences in occupancy because the thymocytes were loaded with equivalent amounts of ligand.
Tubulin Tet
d
Time (min)
OV A
Q4
Q4R7
T4
Q4H7
VS V
.2 5 1 5 10
presence of antibodies that block rebinding to CD8 or the TCR (Fig. 2c). OVA and Q4R7 tetramers dissociated faster when their rebinding to the TCR was blocked. The dissociation of the T4 tetramer was nearly equal under both conditions, whereas tetramers of the positive selecting ligands Q4H7 and G4 dissociated more quickly when rebinding to CD8 was blocked. Taken together, these data indicate that binding of negative selecting ligands is dominated by the TCR, whereas binding of positive selecting ligands is more dependent on CD8; they also highlight the origin of the observed binding differences.
Tet addition
* Kd values were determined from nonlinear regression analysis of tetramer binding curves with pre-selection double-positive thymocytes at 37 uC. The ‘6’ value represents the 95% confidence interval from the nonlinear regression analysis. { Half-life (t1/2) values were calculated as described in Methods.
30 .2 5 1 5 10
80 6 19 31 6 8 20 6 8 ,12 ,12 ND
FL4/FL5
257 6 35 99 6 39 79 6 19 73 6 26 61 6 16 ND
30 .2 5 1 5 10
Negative Negative Negative Border Positive None
39 6 9.6 241 6 52 282 6 49 576 6 97 721 6 51 No binding
30 .2 5 1 5 10
3.7 6 0.7 29 6 7.2 48 6 9.5 55 6 10.1 51 6 9.1 490 6 89
30 .2 5 1 5 10
OVA Q4 Q4R7 T4 Q4H7 VSV
recruited to the plasma membrane through its association with phosphorylated CD3-f. We found that 95% of OVA-stimulated thymocytes induced recruitment of ZAP-70 phosphorylated at residue 319 to the plasma membrane within 2 min (full, 54%; partial, 41%). With Q4R7, 89% of cells showed plasma membrane recruitment of phosphorylated ZAP-70 (full, 56%; partial, 43%). In contrast, the positive selector Q4H7 induced much less localization of phosphorylated ZAP-70 to the plasma membrane (full, 12%; partial, 31%) and these differences remained after 10 min (Fig. 4a and Supplementary Fig. 2). Specific residues of phosphorylated LAT recruit Grb2–SOS, an adapter and guanine nucleotide exchange factor (GEF) module important for Ras activation in negative selection37,38. The negative selectors OVA and Q4R7 efficiently recruited both Grb2 (100% OVA, 97% Q4R7) and SOS (99% OVA, 100% Q4R7) to the plasma membrane. None (0%) of the thymocytes stimulated with the positive selector Q4H7 showed this pattern of plasma membrane recruitment of Grb2–SOS (Fig. 4b). Phospholipase Cc1 is also recruited to phosphorylated LAT and, once activated, generates diacylglycerol (DAG)37. DAG activates RasGRP1, a GEF important for Ras activation in positive selection39. The negative selectors OVA and Q4R7 recruited RasGRP1, Ras and Raf-1 to the plasma membrane in 100% of the thymocytes analysed. In contrast, these molecules colocalized to the Golgi when stimulated with the positive selector Q4H7 (Fig. 4c, d, f, and Supplementary Figs 2 and 3). The trafficking patterns of Ras are dependent on acylation
N S .2 5 1 5 10
Selection
N S .2 5 1 5 10 .2 5 1 5 10 .2 5 1 5 10 .2 5 1 5 10 .2 5 1 5 10
Kd WT (nM)* Kd mutant (nM)* t1/2 WT (s){ t1/2 mutant (s){
MFI (tetramer)
Peptide
p38 p36
pLAT
Low exp.
pERK1/2
High exp.
Tubulin
e Fold increase
Table 1 | Quantification of tetramer binding
18
pζ
pLAT
6
pERK
OVA Q4 Q4R7 T4 Q4H7 VSV
2 12 4
0.25 1 5 10
6
2
1
30
0.25 1
5
10
0.25 1
5
10
Time (min)
Figure 3 | Differences in TCR proximal signal induction distinguish positive and negative selecting ligands. a, Pre-selection OT-I double-positive thymocytes were incubated with concentrations of various peptide–Kb tetramers that gave equivalent occupancy. b, Ca21 flux was measured by flow cytometry. c, d, Induction of phosphorylation of p23-f (c) LAT and ERK (d) was determined by western blot analysis of lysates of OT-I pre-selection double-positive thymocytes, stimulated with tetramers as in a. Two exposures are shown for the phosphorylated ERK blots (d). Antibody to tubulin was used as a loading control (c, d). e, Kinetics of the induction of p23-f, LAT and ERK phosphorylation is shown as the fold increase over nonstimulated cells using antibody to either tubulin (phosphorylated CD3-f and LAT) or ERK-2 (phosphorylated ERK) as a loading control.
726 ©2006 Nature Publishing Group
ARTICLES
NATURE | Vol 444 | 7 December 2006
because inhibition of the palmitoylation cycle with 2-bromopalmitate blocked its movement40 (data not shown). These data also suggest that Ras is active in both compartments because only the activated form of Ras can recruit Raf-1 (ref. 36). The negative selectors also targeted phosphorylated ERK to the plasma membrane within 2 min, where it remained concentrated at 10 min. In contrast, the positive selecting ligands induced an accumulation of phosphorylated ERK throughout the cell, especially at later times. With both types of selecting ligand, phosphorylated JNK accumulated throughout the cell with similar kinetics (Fig. 4e and data not shown)41. The net result is that only negative selectors induce segregation of phosphorylated ERK and phosphorylated JNK. Therefore, a key distinction between positive and negative selecting ligands is how they compartmentalize the MAPK signalling intermediates that have a role in regulating cell fate decisions. To test the idea that signalling and compartmentalization patterns predict selection outcome, we studied the OVA Kb mutant ligand. We considered that the loss of CD8 participation observed with this ligand should decrease the potency of a negative selector below the selection threshold and convert it into a positive selector, as shown in CD8a-null mice42. OVA presented by Kb mutant APCs induced CD69 expression with a potency in the range of positive selectors (Supplementary Fig. 4), and OVA Kb mutant tetramers induced Ca21 flux similar to that induced by Q4H7 Kb wild-type tetramers. OVA Kb mutant and Q4H7 Kb wild-type tetramers induced LAT and ERK phosphorylation with similar kinetics (Fig. 5a–c). Furthermore, OVA Kb mutant tetramers induced localization patterns of Grb2, SOS, RasGRP1, Ras, Raf-1, phosphorylated ERK and phosphorylated JNK that closely resembled those induced by positive selectors (Fig. 4 and Supplementary Figs 2 and 3). To confirm that this signalling profile leads to bona fide positive selection, we established reaggregated thymic organ cultures with pre-selection OT-I double-positive thymocytes, B6 Rag2/2b2m2/2 fetal thymic epithelium, and T2 wild-type Kb or T2 mutant-Kb APCs pulsed with Q4H7 or OVA as a source of MHC molecules43. In
a
ζ
2 min pZAP Merge
ζ
10 min pZAP Merge
cultures lacking peptide, thymocytes remained double positive, whereas Q4H7-pulsed T2 wild-type Kb APCs induced positive selection (Fig. 5d). Reaggregates with OVA-pulsed T2 wild-type Kb APCs generated about 20-fold fewer cells, indicative of negative selection; however, cultures containing T2 mutant Kb APCs pulsed with OVA induced robust positive selection. These results argue that ligand potency establishes a compartmentalization pattern of the signalling machinery that predicts selection outcome. Discussion Our data provide insight into central tolerance by defining the boundary between positive and negative selection and by describing how thymocytes interpret ligands lying close to this boundary to generate differences in TCR proximal signals. Although pre-selection thymocytes respond to a wide range of ligands, the transition from positive to negative selection occurs across an extremely narrow range of ligand potency. The border peptide T4 functions as a negative selector at high concentrations, behaves as a positive selector at physiological doses, and is a poor antigen for peripheral OT-I T cells at all doses. In contrast, Q4R7, which is only 1.5 times more potent than T4, functions as a negative selector at all concentrations. Therefore, there is only a narrow window in which self-reactive thymocytes can potentially escape negative selection. These data document a sharp selection threshold that is established in the thymus, maintained in the periphery, and emphasizes the fidelity of central tolerance. The binding characteristics of ligands comprising the selection boundary are strikingly similar. Only after analysing the individual components of thymocyte–tetramer interactions are the subtle differences between these ligands revealed. At the selection threshold, negative selecting ligands have a slightly higher TCR affinity than their positive selecting counterparts, consistent with previous studies12–15. At the selection border, the TCR–pMHC affinity is similar to the CD8–pMHC affinity. In the context of kinetic proofreading, we can imagine that interactions longer than the lifetime of the
2 min Raf-1 RasGRP Merge
c
10 min Raf-1 RasGRP Merge
e
pJNK
OVA
OVA
OVA
Q4R7
Q4R7
Q4R7
Q4H7
Q4H7
Q4H7
OVA Mut
OVA Mut
OVA Mut
NS
NS
NS
b
Grb-2
2 min SOS
Merge
Grb-2
10 min SOS Merge
d
Raf-1
OVA
OVA
Q4R7
Q4R7
Q4H7
Q4H7
OVA Mut
OVA Mut
NS
NS
2 min Ras
Merge
Raf-1
10 min Ras Merge
2 min pERK
Merge
pJNK
10 min pERK Merge
f Membrane Golgi
Figure 4 | Differential compartmentalization of early signal intermediates by positive and negative selecting ligands. Confocal analysis was done on pre-selection OT-I double-positive thymocytes stimulated, as in Fig. 3, for the indicated times and subjected to intracellular staining. a, CD3-f (green) and ZAP-70 phosphorylated on residue 319 (red); b, Grb2 (green) and SOS (red); c, Raf-1 (green) and RasGRP1 (red); d, Raf-1 (green) and Ras (red);
e, phosphorylated JNK (green) and phosphorylated ERK (red). f, Membrane-specific (LAT) and Golgi-specific (c-1 adaptin) stains are shown as localization controls. The cells shown in each panel are representative of n $ 70 tetramer-bound cells from three independent experiments. NS, non-stimulated. 727
©2006 Nature Publishing Group
ARTICLES
NATURE | Vol 444 | 7 December 2006
CD8–pMHC complex allow Lck (carried by CD8) sufficient access to the TCR–CD3 complex to generate the signals necessary to induce negative selection, whereas shorter interactions lead to positive selection. Heterologous competition assays and the differential contributions of CD8 and TCR to ligand binding suggest, however, that negative selecting ligands may enhance the formation of the tripartite CD8–TCR–pMHC complex44. Therefore, other parameters of ligand engagement and/or the geometrical orientation within the tripartite complex may also be involved in establishing differences in thymocyte signalling. The mechanism used by thymocytes to convert small changes in analogue input (affinity) to a digital output (positive versus negative selection) begins very early in the TCR signalling cascade. Slight increases in affinity across the selection threshold generate incremental increases in the induction of p23-f and ZAP-70 phosphorylation; a
175
FL4/FL5
OVA 125 OVA Mut 75
VSV
Q4H7 0
100
200
OVA WT
b
NS .25 1
300 Time (s)
OVA Mut
400
Q4H7 WT
500 VSV WT
5 10 .25 1
5 10 .25 1
5 10 .25 1
5 10
8
pLAT 1 9
8
6
4 5
5
7
6 6
7
8
2 2
2
1
1 7 31 15 7
2 3
7
7
3 3
8 13
0 0
0
0
pERK
Tubulin
c Fold increase
pLAT
pERK
6
30
4
20
2
10
0.25 1
5 Time (min) No peptide
d
OVA OVA Mut Q4H7 VSV
10 0.25 1
5 Time (min)
Q4H7
5,050
10
OVA
11,879
568 T2 WT Kb
69
2,743
2,719
9,289
CD4
2
T2 Mut Kb 7
6
39
CD8β
Figure 5 | Signalling and compartmentalization profiles are predictive of selection outcome. a, b, OT-I pre-selection double-positive thymocytes were stimulated with tetramers and the Ca21 flux (a) and pattern of LAT and ERK phosphorylation (b) was determined as in Fig. 3. Numbers below the blots indicate the fold induction. c, Induction kinetics for phosphorylated LAT and phosphorylated ERK, determined as in Fig. 3 (mean 6 s.d.; n 5 4) d, Reaggregate thymic organ cultures containing E15.5 TECs from Rag2/2b2m2/2 mice, OT-I pre-selection double-positive thymocytes and either T2 wild-type Kb or T2 D227K (Mut) Kb peptide-pulsed APCs. The number of thymocytes recovered in each reaggregate culture (top right) and the percentage of CD8ab single-positive thymocytes (bottom right) are indicated.
however, negative selectors induce more efficient concentration of phosphorylated ZAP-70 at the membrane. This observation suggests that enhanced phosphorylation of LAT induced by negative selectors may be explained by an increase in the local concentration of this kinase. This leads to activation and translocation of RasGRP1 from the cytosol to the plasma membrane and recruitment of Grb2–SOS to phosphorylated LAT, resulting in activation of the Ras/Raf-1/ERK cascade at the plasma membrane. In stark contrast, positive selectors have no affect on the localization of Grb2–SOS, but induce recruitment and activation of RasGRP1, Ras, Raf-1 and ERK at the Golgi. Of note, plasma-membrane-localized Ras, Raf-1 and ERK are extremely sensitive to low signal input35. Moreover, the activity of plasmamembrane-localized Ras is negatively regulated by the Ca21-dependent RasGAP, CAPRI36,45, which may account for its transient activation. The kinetics of activation of the Ras/Raf-1/ERK cascade at the Golgi is slower and not subjected to stringent negative regulation35,36,45. Taken together, these data suggest a mechanism underlying the kinetic differences in ERK activation observed with positive and negative selecting ligands22,41. Considering the competing roles of phosphorylated ERK and phosphorylated JNK in thymic selection21,26, the retention of ERK at the plasma membrane may enable phosphorylated JNK and other effector molecules to initiate negative selection successfully. These events are the first steps in a process that must continue for some time to achieve a final commitment to selection46,47. METHODS Mice. All mice were bred in our colony and handled in accordance with Swiss laws. CD69 assays. APCs expressing wild-type Kb or D227K mutant Kb MHC (a gift from T. Potter) were pulsed with peptide and incubated with pre-selection OT-I double-positive thymocytes (a ratio of one APC to two thymocytes) for 16 h and analysed by flow cytometry with Tree Star software. CD69 dose response curves were analysed by nonlinear regression using GraphPad software. FTOC, Ca21 flux and MHC I tetramers. FTOC assays, Ca21 flux assays, and tetramer production were done as described29,32. Quantification of tetramer binding. Pre-selection OT-I double-positive thymocytes were stained with tetramers as described33. Kd was determined by nonlinear regression analysis of the geometric mean fluorescence intensity (MFI) versus tetramer concentration curves (see Supplementary Information for details). Tetramer rebinding was blocked with antibody to Kb (Y3), Va2 (B20) or CD8b (53.5.8)32. Half-lives were calculated as described33. Western blotting. Thymocytes were stimulated with pMHC tetramers at 37 uC, lysates were subjected to western blot analysis, and bands were quantified by densitometry48,49. An anti-phosphotyrosine monoclonal antibody (4G10) was used to detect phosphorylated CD3-f and phosphorylated LAT; polyclonal antibodies were used to detect phosphorylated ERK1/2. The identity of phosphorylated proteins was confirmed with antibody to LAT or ERK2, or rabbit antiserum to CD3-f (a gift from B. Alarcon). Confocal microscopy. Tetramer stimulated double-positive thymocytes were stained, examined by confocal microscopy and quantified with LSM510 META software (Carl Zeiss) and ImageJ (NIH)48. Blind analyses of localization patterns for each condition, performed by six individuals, determined cells representing the majority population (n . 70; see Supplementary Information for details). Reaggregate thymic cultures. Reaggregate cultures were established from embryonic day (E15) thymic epithelial cells (TECs) from B6 Rag2/2b2m2/2 embryos, OT-I pre-selection double-positive thymocytes and T2 APCs at a ratio of 10/30/1 (TECs/thymocytes/T2 APCs) and analysed as described50. Received 6 July; accepted 18 September 2006. Published online 1 November 2006. 1. 2. 3. 4. 5.
Starr, T. K., Jameson, S. C. & Hogquist, K. A. Positive and negative selection T cells. Annu. Rev. Immunol. 21, 139–176 (2003). Germain, R. N. The T cell receptor for antigen: signaling and ligand discrimination. J. Biol. Chem. 276, 35223–35226 (2001). Sebzda, E. et al. Positive and negative thymocyte selection induced by different concentrations of a single peptide. Science 263, 1615–1618 (1994). Ashton-Rickardt, P. G. et al. Evidence for a differential avidity model of T cell selection in the thymus. Cell 76, 651–663 (1994). Fontenot, J. D. & Rudensky, A. Y. A well adapted regulatory contrivance: regulatory T cell development and the Forkhead family transcription factor Foxp3. Nature Immunol. 6, 331–337 (2005).
728 ©2006 Nature Publishing Group
ARTICLES
NATURE | Vol 444 | 7 December 2006
6.
7.
8.
9. 10. 11. 12. 13. 14. 15.
16. 17. 18. 19. 20. 21. 22. 23. 24.
25.
26. 27. 28.
29. 30. 31.
32.
Sakaguchi, S. Naturally arising Foxp3-expressing CD251CD41 regulatory T cells in immunological tolerance to self and non-self. Nature Immunol. 6, 345–352 (2005). Leishman, A. J. et al. Precursors of functional MHC class I- or class II-restricted CD8aa1 T cells are positively selected in the thymus by agonist self-peptides. Immunity 16, 355–364 (2002). Yamagata, T., Mathis, D. & Benoist, C. Self-reactivity in thymic double-positive cells commits cells to a CD8aa lineage with characteristics of innate immune cells. Nature Immunol. 5, 597–605 (2004). Hogquist, K. A., Baldwin, T. A. & Jameson, S. C. Central tolerance: learning selfcontrol in the thymus. Nature Rev. Immunol. 5, 772–782 (2005). McKeithan, T. W. Kinetic proofreading in T-cell receptor signal transduction. Proc. Natl Acad. Sci. USA 92, 5042–5046 (1995). Goldstein, B., Faeder, J. R. & Hlavacek, W. S. Mathematical and computational models of immune-receptor signalling. Nature Rev. Immunol. 4, 445–456 (2004). Alam, S. M. et al. T-cell receptor affinity and thymocyte positive selection. Nature 381, 616–620 (1996). Davis, M. M. et al. Ligand recognition by ab T cell receptors. Annu. Rev. Immunol. 16, 523–544 (1998). Liu, C. P., Crawford, F., Marrack, P. & Kappler, J. T cell positive selection by a high density, low affinity ligand. Proc. Natl Acad. Sci. USA 95, 4522–4526 (1998). Williams, C. B., Engle, D. L., Kersh, G. J., Michael White, J. & Allen, P. M. A kinetic threshold between negative and positive selection based on the longevity of the T cell receptor–ligand complex. J. Exp. Med. 189, 1531–1544 (1999). Garcia, K. C. et al. CD8 enhances formation of stable T-cell receptor/MHC class I molecule complexes. Nature 384, 577–581 (1996). Wyer, J. R. et al. T cell receptor and coreceptor CD8aa bind peptide–MHC independently and with distinct kinetics. Immunity 10, 219–225 (1999). Zamoyska, R. et al. The influence of the Src-family kinases, Lck and Fyn, on T cell differentiation, survival and activation. Immunol. Rev. 191, 107–118 (2003). Daniels, M. A. et al. CD8 binding to MHC class I molecules is influenced by T cell maturation and glycosylation. Immunity 15, 1051–1061 (2001). van Leeuwen, J. E. & Samelson, L. E. T cell antigen-receptor signal transduction. Curr. Opin. Immunol. 11, 242–248 (1999). Alberola-Ila, J. & Hernandez-Hoyos, G. The Ras/MAPK cascade and the control of positive selection. Immunol. Rev. 191, 79–96 (2003). Werlen, G., Hausmann, B., Naeher, D. & Palmer, E. Signaling life and death in the thymus: timing is everything. Science 299, 1859–1863 (2003). Palmer, E. Negative selection—clearing out the bad apples from the T-cell repertoire. Nature Rev. Immunol. 3, 383–391 (2003). Bommhardt, U., Scheuring, Y., Bickel, C., Zamoyska, R. & Hunig, T. MEK activity regulates negative selection of immature CD41CD81 thymocytes. J. Immunol. 164, 2326–2337 (2000). Mariathasan, S. et al. Duration and strength of extracellular signal-regulated kinase signals are altered during positive versus negative thymocyte selection. J. Immunol. 167, 4966–4973 (2001). Dong, C., Davis, R. J. & Flavell, R. A. MAP kinases in the immune response. Annu. Rev. Immunol. 20, 55–72 (2002). Alam, S. M. et al. Qualitative and quantitative differences in T cell receptor binding of agonist and antagonist ligands. Immunity 10, 227–237 (1999). Hare, K. J., Jenkinson, E. J. & Anderson, G. CD69 expression discriminates MHCdependent and -independent stages of thymocyte positive selection. J. Immunol. 162, 3978–3983 (1999). Hogquist, K. A. et al. T cell receptor antagonist peptides induce positive selection. Cell 76, 17–27 (1994). Savage, P. A., Boniface, J. J. & Davis, M. M. A kinetic basis for T cell receptor repertoire selection during an immune response. Immunity 10, 485–492 (1999). Crawford, F., Kozono, H., White, J., Marrack, P. & Kappler, J. Detection of antigenspecific T cells with multivalent soluble class II MHC covalent peptide complexes. Immunity 8, 675–682 (1998). Daniels, M. A. & Jameson, S. C. Critical role for CD8 in T cell receptor binding and activation by peptide/major histocompatibility complex multimers. J. Exp. Med. 191, 335–346 (2000).
33. Rosette, C. et al. The impact of duration versus extent of TCR occupancy on T cell activation: a revision of the kinetic proofreading model. Immunity 15, 59–70 (2001). 34. Potter, T. A., Rajan, T. V., Dick, R. F. II & Bluestone, J. A. Substitution at residue 227 of H–2 class I molecules abrogates recognition by CD8-dependent, but not CD8independent, cytotoxic T lymphocytes. Nature 337, 73–75 (1989). 35. Harding, A., Tian, T., Westbury, E., Frische, E. & Hancock, J. F. Subcellular localization determines MAP kinase signal output. Curr. Biol. 15, 869–873 (2005). 36. Mor, A. & Philips, M. R. Compartmentalized Ras/MAPK signaling. Annu. Rev. Immunol. 24, 771–800 (2006). 37. Sommers, C. L., Samelson, L. E. & Love, P. E. LAT: a T lymphocyte adapter protein that couples the antigen receptor to downstream signaling pathways. BioEssays 26, 61–67 (2004). 38. Gong, Q. et al. Disruption of T cell signaling networks and development by Grb2 haploid insufficiency. Nature Immunol. 2, 29–36 (2001). 39. Dower, N. A. et al. RasGRP is essential for mouse thymocyte differentiation and TCR signaling. Nature Immunol. 1, 317–321 (2000). 40. Rocks, O. et al. An acylation cycle regulates localization and activity of palmitoylated Ras isoforms. Science 307, 1746–1752 (2005). 41. Werlen, G., Hausmann, B. & Palmer, E. A motif in the ab T-cell receptor controls positive selection by modulating ERK activity. Nature 406, 422–426 (2000). 42. Goldrath, A. W., Hogquist, K. A. & Bevan, M. J. CD8 lineage commitment in the absence of CD8. Immunity 6, 633–642 (1997). 43. Hare, K. J., Jenkinson, E. J. & Anderson, G. In vitro models of T cell development. Semin. Immunol. 11, 3–12 (1999). 44. Yachi, P. P., Ampudia, J., Gascoigne, N. R. & Zal, T. Nonstimulatory peptides contribute to antigen-induced CD8–T cell receptor interaction at the immunological synapse. Nature Immunol. 6, 785–792 (2005). 45. Bivona, T. G. et al. Phospholipase Cc activates Ras on the Golgi apparatus by means of RasGRP1. Nature 424, 694–698 (2003). 46. Liu, X. et al. Restricting Zap70 expression to CD41CD81 thymocytes reveals a T cell receptor-dependent proofreading mechanism controlling the completion of positive selection. J. Exp. Med. 197, 363–373 (2003). 47. McNeil, L. K., Starr, T. K. & Hogquist, K. A. A requirement for sustained ERK signaling during thymocyte positive selection in vivo. Proc. Natl Acad. Sci. USA 102, 13574–13579 (2005). 48. Teixeiro, E. et al. T cell division and death are segregated by mutation of TCRb chain constant domains. Immunity 21, 515–526 (2004). 49. Teixeiro, E., Fuentes, P., Galocha, B., Alarcon, B. & Bragado, R. T cell receptormediated signal transduction controlled by the b chain transmembrane domain: apoptosis-deficient cells display unbalanced mitogen-activated protein kinases activities upon T cell receptor engagement. J. Biol. Chem. 277, 3993–4002 (2002). 50. Anderson, G., Jenkinson, E. J., Moore, N. C. & Owen, J. J. MHC class II-positive epithelium and mesenchyme cells are both required for T-cell development in the thymus. Nature 362, 70–73 (1993).
Supplementary Information is linked to the online version of the paper at www.nature.com/nature. Acknowledgements We thank R. Clark and T. Potter for hospitality and for providing OT-I Rag2/2b2m2/2 mice; S. Jameson for Kb plasmids; G. de Libero and A. Schrum for reading the manuscript; V. Ja¨ggin for assistance with the Ca21 flux analysis; and E. Wagner and W. Ha¨nggi for animal husbandry. This work was supported by grants from Novartis, the Swiss National Science Foundation, the US Cancer Research Institute (to M.A.D. and K.H.), Hoffmann La Roche, and the NIH (to N.R.J.G.). Author Information Reprints and permissions information is available at www.nature.com/reprints. The authors declare no competing financial interests. Correspondence and requests for materials should be addressed to E.P. (
[email protected]).
729 ©2006 Nature Publishing Group