Artificial and natural intelligence integration Juan C. Alvarado-Pérez1 & Diego H. Peluffo-Ordóñez2
[email protected],
[email protected] Universidad de Salamanca Universidad Cooperativa de Colombia
Abstract. The large amount of data generated by different activities academic, scientific, business and industrial activities, among others- contains meaningful information that allows developing processes and techniques, which have scientific validity to optimally explore such information. Doing so, we get new knowledge to properly make decisions. Nowadays a new and innovative field is rapidly growing in importance that is Artificial Intelligence, which involves computer processing devices of modern machines and human reasoning. By synergistically combining them –in other works, performing an integration of natural and artificial intelligence-, it is possible to discover knowledge in a more effective way in order to find hidden trends and patterns belonging to the predictive model database. As well, allowing for new observations and considerations from beforehand known data by using data analysis methods as well as the knowledge and skills (of holistic, flexible and parallel type) from human reasoning. This work briefly reviews main basics and recent works on artificial and natural intelligence integration in order to introduce users and researchers on this field integration approaches. As well, key aspects to conceptually compare them are provided. Keywords: Data mining, visualization, machine learning.
1
Introduction
The human being is intuitive and deductive as well as has a convergent and divergent thought, having then the virtue of interpreting the world possible in a holistic, panoramic, parallel, flexible and contextual way, allowing for a quickly integrated sight of problems and taking out general concept for doing mind maps and establishing dynamic relationships among objects. All aforementioned is provided by imagination, creativity and spontaneity being characteristics that make a person able to give different meanings to the same term (i.e. the word love may be mean something different regarding adfa, p. 1, 2011. © Springer-Verlag Berlin Heidelberg 2011
the point of view). Also, such a virtue makes a human being able to interpret different and ambiguous feelings such as irony, moods and sarcasm [1], which cannot be interpreted by machine as feelings. This is due to the data interpretation by a machine that is deterministic. Nevertheless, there exists inherent subjectivism associated with the analyst experience, which may bias the outcomes when analyzing data. To deal with this drawback, objective processes become necessary for supporting the process of decision making [2]. A human being is rounded by different aroma, tastes, smelling, feelings, sounds and colors that are perceived and internalize through senses, who build a subjective concept from them. However, visual stimulus are the ones that give the most information to the brain so this process makes the sight the widest bandwidth sense, because it permits to perceive a lot of varied information from the environment [3]. Broadly speaking, it means that “a picture is worth a thousand words” so if representative, such picture will facilitate human to build a mind map for concepts or problems learning. At present, modern technology is making that images tell histories from big data, taking them into a multimedia and multidimensional world where human being is able of manipulating and interacting with data to build a complex-reality representation in a graphic fashion, as well as identifying underlying patterns and/or models [4]. Our world perception has been encoded by different symbols such as: letters, numbers, diagrams, general data, etc., which should be intelligible for human beings. Thus, some visualization approaches are used that provide a real semiotic ability for human interpretation, so it uses different types of resources such as colors, forms, textures and geometrical representations based on psychological phenomena like color interpretation, preattentive process, context and reference interpretation [5]. There several tools for intelligent visualization [6], providing a semiotic relationship with explored data –by telling the data’s story in a graphic, suitable and efficient way. This work presents a briefly review on artificial and natural intelligence integration. The remaining of this paper is organized as follows: Section 2 starts by introduction what artificial and natural intelligence integration consists in. Then, section 3 outlines ways to integrate Information Visualization and Data Mining. Finally, section 4 draws the conclusions and final remarks.
2
Artificial and natural intelligence integration
The modern computer and its emergent systems have implicitly generated a scenario where a human being and machine competition takes place, in which the latter has gradually increased its involvement into exclusively human beings activities. However, a machine might not be seen as a human being replacement since they both have special characteristics (as mentioned above) making them essentially different from each other. In this connection, it is worth to underline that under a proper integration of artificial –by machines- and natural –by human beings- intelligence may perform better and more robust processes. This means that an integrated system can be formed so that improved outcomes are reached. For instance, computers are deterministic, objective, tireless and untiring, as well as have a high processing ability. Meanwhile, human beings have flexible, parallel and dynamic thought within a holistic context viewpoint. In this sense, by joining the characteristics from both approaches, versatile and suitable systems able to generate solutions benefitting society can be accomplished. Even though the two studied approaches are essentially different, they may have similar properties to be exploited to improve the system performance. On one hand, computers can be flexible (just like human beings) by adding to them some autonomous learning techniques such as fuzzy logic [7]. On the other hand, human brain is divided into two hemispheres, being the right one in charge of creativity and feeling, meanwhile the left one provides the logic [8], which is closer to the way how machines process the information. Indeed, many learning and processing systems for computers emulate somehow the brain behavior as it is the case of neural networks [7]. By doing an adequate synergetic integration between human beings skills and computer abilities involving the best properties from each one, artificial intelligence along with natural intelligence may reach both accurate calculation ability as well as holistic and flexible learning processes. Then, aimed at providing a robust and proper data exploration, an integrated system may discover innovative and useful knowledge in a more efficient way in comparison with traditional approaches [9]. Within integration frameworks, Data Mining (DM) algorithms are able to exhaustively explore and analyze data by taking advantage of information visualization (IV) techniques that facilitates
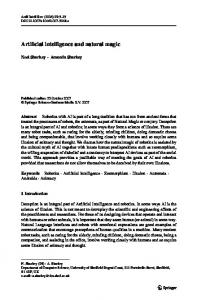
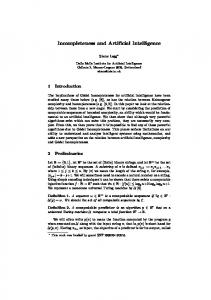
human interpretation. In fact, visualization processes are aimed at providing users with an efficient way to interpret data making the DM outcomes more intelligible and facilitating mind map building in a graphic way [10] –in this way the holistic and flexible human being thought is involved. In this sense, automatic learning and DM is on the computer side while the IV on the human interpretation side as explained in Fig. 1. Integrated systems work iteratively and interactively demanding often a high computational cost as well as a strongly collaborative work between analyst and machine [11].
Data
Mining
Patterns
Hypothesis
DATA MINING
HUMAN
MACHINE
VISUALIZATION Data
Interpretation
Mapping
Display
Patterns
Hypothesis
K N O W L E D G E
Fig. 1. Integrating human beings in machine, through knowledge discovery process
3
Ways to integrate Information Visualization and Data Mining
DM and IV are fields that have been independently created and developed, being the former able to process data outputting if-then rules and patterns while the latter represents data in an easy-to-interpret fashion without using additional algorithm support. By construction, these methods were no intended to interact with each other. Nonetheless, approaches to integrate DM and IV have been proposed [12]. Following are described approaches to integrate DM and IV, namely: Computer visualization, visually improved data mining.
3.1
Computer visualization (V++)
The V++ objective is to make a data representation allowing for detecting and drawing patterns through computationally optimal views. This approach
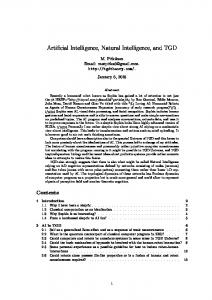
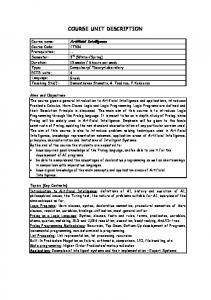
is mainly a visual technique that takes advantage of computer algorithms such as those based on DM. Visualization attempts to reveal and visualize the most relevant patterns, that is to say those ones being more informative regarding some criteria. Thus, intended to facilitate human interpretation, visualization allow for low-dimensional data representation (2 or 3 dimensions). Nonetheless, when dealing with big data, the original data space embedding space into a lower dimension space is not a trivial task. For instance, just look at a 2D conventional screen, which itself is inherently limited by its available rectangular space. Indeed, the most common (being feasible and real) representation relies on a 2D plotting whether n-dimensional data (n >3) or even one-dimensional data (normally an extra corresponding axis is used, i.e. the axis of ordinal numbers being the simplest one). On this regard, available 2D representation must be optimally utilized for visualization purposes, and then an intrinsic bi-dimensional space for properly representing of data should be determined. To this end, there are different approaches such as: data projection, dimensionality reduction, multidimensional scaling, and data clustering [13]. Properly set, visualization approaches along with human interaction may reach the best 2D representation according to the user’s needs. In Fig. 2, the V++ process is shown. Notice that the symbol ++ means that visualization is improved by DM techniques. V Pattern
V Projection
V Mapping
+ Reduction
+ Checking
+ Refinement
Fig. 2. V++ Process
3.2
Visually improved data mining (M++)
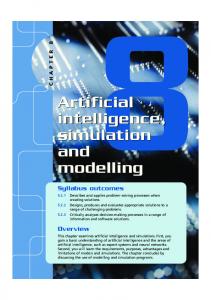
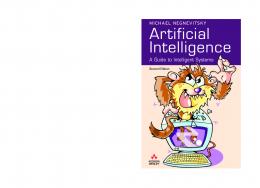
The core of this type of combination relies on the DM techniques. Meanwhile, VI is an additional stage to visualize and validate the DM outcomes. This is done through an interactive interface allowing for not only interpreting the extracted model by the DM, but also visually verifying, assessing and refining the model outputted by the DM techniques. In this way, a clear interaction between analyst and model takes place, which allows a deeper comprehension of the underlying data information [14]. In other words, DM
is in charge of innovative and useful patterns discovery, while IV only generate a visual representation of them. Fig 3. shows graphically the stages of the M++ process. Symbol ++ denotes DM is supported by IV. Exploration M
Pattern
M
Model
visual alternatives
M
+
Filtering
+
Fig. 3. Process in M++
3.3
DATA MINING AND VISUALIZATION INTEGRATION (VM)
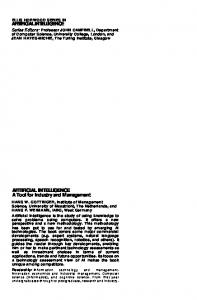
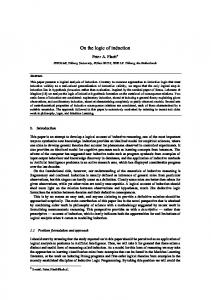
VM techniques involve IV and DM, in which both fields are equally important. In fact, they combine in a synergic way the parallel thought from the human being with the processing capability of computers. Doing so, the best from the machine and human world converge to a meaningful data analysis and interpretation [15]. Two types of VM approaches are explained below. INTEGRATION BLACK BOX WITH FEEDBACK (VM-IBBF): In this approach, algorithms are black boxes, that is, the analyst cannot observe the way the DM algorithm internally works. Nevertheless, user may modify parameters whose effect is automatically reflected in the IV process, yielding then an adaptive approach. In other words, VM-IBBF creates a feedback loop between IV and DM reaching more meaningful alternatives and models, according to the user’s criterion. INTEGRATION WHITE BOX (VM-IWB): This type of integration requires a strong joint effort between analyst and machine. Hence, every single stage of the DM algorithms can be observed so that model building process is easily accessed and modified. So, VM-IMB provides better understanding and allows users customize the algorithms. The interactive and iterative process of VM-IMB is shown Fig. 4.
Data + Model
Data
Scheme Change
Mining
Mapping
Model
Handling
Visualization
Fig. 4. Interactive and Iterative process in the Integration White Box: VM
4
CONCLUSIONS AND FINAL REMARKS
This work presents a brief review of the basics and approaches for artificial and natural intelligence integration. Within the context of this paper is concerned in, artificial intelligence is associated with DM (how to computer explore and analyze data). Correspondingly, natural intelligence refers to IV which allows for an intelligible human interpretation. The emerging field of IV aims to describe, explore and analyze data in order to discover underling knowledge from data. The processes for knowledge extraction and schematic representation of reality by visual models are transversal topics very useful in several fields involving data. Nonetheless, such processes performance is strongly dependent on the nature of data as well as the right use of the data processing techniques. Given this, the synergic integration of artificial and natural intelligence represents a good alternative. Indeed, by properly mixing the holistic, flexible and parallel interpretation from human beings and the high computing storing capabilities of machines it is possible to discover relevant (even unexpected) new patterns within big data sets in an effective way. It is important to remark that due to the high demand of computational load, integration approaches are often implemented on parallel and distributed architectures such as computer clusters and grids, which in turn contribute to significantly improve the performance in terms of time processing and accuracy.
References [1] N. V. Diaz y I. Serrano-Garcia, «¿Pensabas que emocionarse era sencillo? Las emociones como fenómenos biológicos, cognoscitivos y sociales // Did you think it was easy to get excited about? Emotions such as biological, social and cognitive phenomena», Rev. Puertorriqueña Psicol., vol. 13, n.o 1, ene. 2014. [2] S. Tufféry, Data Mining and Statistics for Decision Making. John Wiley & Sons, 2011. [3] R. Pethuru, «Data Visualization: Creating Mind´s Eye», en Handbook of Research on Cloud Infrastructures for Big Data Analytics, IGI Global, 2014. [4] K. Cook, R. Earnshaw, y J. Stasko, «Guest Editors’ Introduction: Discovering the Unexpected», IEEE Comput. Graph. Appl., vol. 27, n.o 5, pp. 15-19, sep. 2007. [5] D. Keim, G. Andrienko, J.-D. Fekete, C. Görg, J. Kohlhammer, y G. Melançon, «Visual Analytics: Definition, Process, and Challenges», en Information Visualization, A. Kerren, J. T. Stasko, J.-D. Fekete, y C. North, Eds. Springer Berlin Heidelberg, 2008, pp. 154-175. [6] L. C. Koh, A. Slingsby, J. Dykes, y T. S. Kam, «Developing and Applying a UserCentered Model for the Design and Implementation of Information Visualization Tools», en 2011 15th International Conference on Information Visualisation (IV), 2011, pp. 90-95. [7] M.-J. Huang, Y.-L. Tsou, y S.-C. Lee, «Integrating fuzzy data mining and fuzzy artificial neural networks for discovering implicit knowledge», Knowl.-Based Syst., vol. 19, n.o 6, pp. 396-403, oct. 2006. [8] M. Roselli, «Maduración cerebral y desarrollo cognoscitivo», Rev. Latinoam. Cienc. Soc. Niñez Juv., vol. 1, n.o 1, may 2011. [9] I. Kononenko y M. Kukar, Machine Learning and Data Mining. Elsevier, 2007. [10] D. Torres Ponjuán, «Aproximaciones a la visualización como disciplina científica», ACIMED, vol. 20, n.o 6, pp. 161-174, dic. 2009. [11] F. Alonso, L. Martínez, A. Pérez, y J. P. Valente, «Cooperation between expert knowledge and data mining discovered knowledge: Lessons learned», Expert Syst. Appl., vol. 39, n.o 8, pp. 7524-7535, jun. 2012. [12] E. Bertini y D. Lalanne, «Surveying the complementary role of automatic data analysis and visualization in knowledge discovery», en Proceedings of the ACM SIGKDD Workshop on Visual Analytics and Knowledge Discovery: Integrating Automated Analysis with Interactive Exploration, 2009, pp. 12–20. [13] D. H. Peluffo-Ordóñez, J. A. Lee, y M. Verleysen, «Short Review of Dimensionality Reduction Methods Based on Stochastic Neighbour Embedding», en Advances in Self-Organizing Maps and Learning Vector Quantization, T. Villmann, F.-M. Schleif, M. Kaden, y M. Lange, Eds. Springer International Publishing, 2014, pp. 65-74. [14] D. A. G. Aguilar, C. S. Guerrero, y R. T. S. and F. G. Penalvo, «Visual Analytics to Support E-learning», ene. 2010. [15] Kai Puolamäki, Alessio Bertone, Roberto Therón, Otto Huisman, Jimmy Johansson, Silvia Miksch, Panagiotis Papapetrou, y Salvo Rinzivillo, «Chapter 4 in Mastering The Information Age – Solving Problems with Visual Analytics», en Mas-
tering the Information Age Solving Problems with Visual Analytics, Daniel Keim, Jörn Kohlhammer, Geoffrey Ellis and Florian Mansmann., Germany, 2010.