Oct 25, 2010 - error; LSU AgCenter, Louisiana State University Agricultural Center;. SBC, Schwarz Bayesian criterion. Published in Crop Sci. 51:21â31 (2011) ...
RESEARCH
Artificial Neural Network Models as a Decision Support Tool for Selection in Sugarcane: A Case Study Using Seedling Populations Marvellous M. Zhou, Collins A. Kimbeng,* Thomas L. Tew, Kenneth A. Gravois, and Michael J. Pontif
ABSTRACT Artificial neural network (ANN) models are mathematical models based on biological neural networks; they are a supervised learning method and use pattern learning from a training dataset that is a subsample of the whole dataset to produce predictions of response variables. We demonstrate the potential of an ANN model as a tool for selection in sugarcane. Cane yield components, namely stalk number, stalk height, and stalk diameter, were measured on individual seedlings and used as predictor variables to produce a selection decision (reject or select a seedling) based on an ANN model. Compared with the currently used visual method of selection, the difference in cane yield between the mean of the selected and rejected seedlings was greater for seedlings selected by the ANN model. The difference increased when similar selection intensity was applied in both selection methods. The ANN model selected fewer seedlings with cane yield lower than the population mean and rejected fewer seedlings with higher cane yield compared with the visual method. The ANN model compels the breeder to consider all traits simultaneously when deciding whether to select or reject a clone, which is likely to be more efficient than judging the merit by considering each trait independently. The ANN model can be a valuable tool to determine selection rates to be applied in selecting sugarcane families during seedling selection.
M.M. Zhou and C.A. Kimbeng, School of Plant, Environmental and Soil Sciences, Louisiana State Univ. Agricultural Center, 104 M.B. Sturgis Hall, Baton Rouge, LA 70803; M.M. Zhou, current address: South African Sugarcane Research Institute, 170 Flanders Dr., Private Bag X02, Mount Edgecombe, KwaZulu-Natal, ZA 4300. T.L. Tew, USDA-ARS, Sugarcane Research Unit, 5883 USDA Rd., Houma, LA 70360. K.A. Gravois and M. Pontif, Sugar Research Station, Louisiana State Univ. Agricultural Center, 5755 LSU Ag Rd., St Gabriel, LA 70776. Received 4 Feb. 2010. *Corresponding author (ckimbeng@ agcenter.lsu.edu). Abbreviations: AIC, Akaike information criterion; ANN, artificial neural network; ASE, average squared error; FPE, fi nal prediction error; LSU AgCenter, Louisiana State University Agricultural Center; SBC, Schwarz Bayesian criterion.
A
n artificial neural network model, often called an ANN model, is a mathematical or computational model based on biological neural networks (Nelson and Illingworth, 1991). The ANN model is a supervised learning method and uses pattern learning from training data to produce models that generate predictions of response variables (Nelson and Illingworth, 1991; Masters, 1993). It consists of a layered, free-forward, and completely connected network restricted to a single direction of flow (Nelson and Illingworth, 1991). It has an input layer, a hidden layer, and an output layer. The ANN models complex relationships between input variables and outputs (Fausett, 1994; Gurney, 1997). The model must be “trained” by processing data with input and output patterns similar to the data to be predicted. The model detects similarities in new input data and uses these similarities to generate output predictions (Smith, 1993). The logistic function calculates probabilities used to make predictions (Allison, 2003; Published in Crop Sci. 51:21–31 (2011). doi: 10.2135/cropsci2010.02.0057 Published online 25 Oct. 2010. © Crop Science Society of America | 5585 Guilford Rd., Madison, WI 53711 USA All rights reserved. No part of this periodical may be reproduced or transmitted in any form or by any means, electronic or mechanical, including photocopying, recording, or any information storage and retrieval system, without permission in writing from the publisher. Permission for printing and for reprinting the material contained herein has been obtained by the publisher.
CROP SCIENCE, VOL. 51, JANUARY– FEBRUARY 2011
21
Agresti, 2007). Multiple linear regression equations form the linear predictors (Hertz et al., 1990; Agresti, 2007). The ANN models have been used in financial risk management (Huang et al., 2004; Sethuraman, 2006), process control in manufacturing (Lee and Paik, 2006), predicting credit scores and interest rates (Perkins and Brabazon, 2006), and predicting fish abundance (Iglesias et al., 2006). In predicting credit card scores and interest rates using ANN models, for example, the applicant’s payment history and other variables are used to calculate the probability that the applicant will make loan repayments at a particular interest rate using data from other individuals as the training data set. The probabilities determine the relative risk of the applicant and are used to determine the interest rates on credit cards or loans. Agronomic applications of ANN models include yield prediction (Kaul et al., 2005; Ji et al., 2007), disease prediction (Batchelor et al., 1997), soil-water retention estimations (Schaap and Bouten, 1996), and crop development modeling (Elizondo et al., 1994). Starrett et al. (1997) reported that an ANN model performed better (r 2 = 0.984) than a regression model (r 2 = 0.780) when predicting applied N leaking below the root zone of turf grass. According to Batchelor et al. (1997), ANN models produced better results than traditional statistical methods when predicting soybean rust. Recently, the ANN model was used to classify green tea [Camellia sinensis (L.) Kuntze] accessions into taxonomic groups using leaf morphological measurements as input variables (Pandolfi et al., 2009). The same group of researchers used the ANN model to classify Japanese Camellia (Camellia japonica L.) using phyllometric and fractal parameters (Mugnai et al., 2008). In this paper, we demonstrate how the ANN model concept can be applied as a decision support tool for selection in sugarcane. We use two seedling populations from two different sugarcane breeding programs in Louisiana. During seedling selection, stalk diameter, stalk length, and stalk number are commonly used to evaluate cane yield (Chang and Milligan, 1992). These yield components (Kang et al., 1983, 1991; Milligan et al., 1990) can be used as input variables in the ANN models to predict the probability of either selecting or rejecting a seedling. During selection, the decision to select or reject a seedling depends on the combination and magnitude of these yield components. The outcome or response variable would be to either select (1) or reject (0) a seedling, which is binary in nature. In this case, a training dataset consisting of previously defined response variables (select or reject) and the input or independent variables (cane yield components) are used by the ANN model to determine the logistic regression function. Then a new dataset consisting of input variables is fed into the logistic regression function, which produces probabilities of either selecting or rejecting a seedling as the output. 22
The objective of this study was to evaluate the potential of using the SAS enterprise miner (SAS Institute, 2007) ANN model as a decision support tool for selection in sugarcane. We built and used an ANN model to identify seedlings with high cane yield potential at the seedling stage of two independent sugarcane breeding programs. The yields of seedlings selected using the ANN models were compared with those selected using the currently used visual method.
MATERIALS AND METHODS Populations and Measurements Data were collected from seedlings raised from true seed at the USDA Agricultural Research Service (ARS) Ardoyne Research Farm at Schreiver, LA., and Louisiana State University Agricultural Center (LSU AgCenter) Sugarcane Research Station at St. Gabriel, LA. Seedlings in sugarcane refer to the initial unselected plants grown from true seed obtained after crossing. The seedlings from 17 crosses grown at the USDA and 5 crosses grown at the LSU AgCenter (Table 1) were first raised in the greenhouse and then transplanted into the field as single plants in the spring (April) of 2002 along with seedlings in the regular breeding program. In the USDA breeding program, 60,000 seedlings are grown whereas in the LSU AgCenter program about 85,000 seedlings from about 130 crosses each year are grown. The seedlings from each cross are usually planted in unreplicated tworow plots with varying number of seedlings per cross, depending on the importance of the cross, with the elite crosses typically having more than 500 seedlings. However, in this study, for the USDA population, the seedlings of each cross were divided and transplanted as two replications. In each plot, two rows were planted, each row containing 16 seedlings. In 2003, eight seedlings (four from each row per plot) were randomly chosen from each plot and used for data collection. At the LSU AgCenter, five crosses (Table 1), each with more than 500 seedlings, were selected from the seedling program. Thirty seedlings per cross were randomly chosen in 2003. The chosen seedlings from the two populations were evaluated visually to determine if they would have been selected (1) or rejected (0). The decision to select (1) or reject (0) a seedling in this study was based on a consensus between two experienced sugarcane breeders. Scrutiny by two breeders is not typically practiced during routine selection and it usually takes less time, than was the case in this study, to appraise seedlings. As is customary, dry leaves of the seedlings at the LSU AgCenter were stripped off before selection whereas those of the USDA seedlings were not. For the chosen seedlings in each of the populations (USDA and LSU AgCenter), the number of stalks per stool was recorded, stalk height was measured from the base of the stool to the topmost visible dewlap, and stalk diameter was measured at the center of the stalk on three randomly chosen stalks using a caliper and without reference to the bud. The seedling cane yield was calculated based on an empirically derived formula (De Sousa-Vieira and Milligan, 1999) (Eq. [1]). Their calculation assumed the sugarcane stalk was a perfect cylinder with specific gravity of one as empirically determined from previous studies (Miller and James, 1974; Gravois et al., 1991; Chang and Milligan, 1992).
WWW.CROPS.ORG
CROP SCIENCE, VOL. 51, JANUARY– FEBRUARY 2011
Table 1. Cross showing female and male parents of sugarcane seedlings planted at the USDA and Louisiana State University Agricultural Center (LSU AgCenter) sugarcane research farms. Cross
Female parent
Male parent
Cross
306 3055 3074 3093 3101 3107 3111 3174 3249
Crosses evaluated at the USDA research farm Ho94-856 HoCP96-540 3255 HoCP00-945 HoCP99-866 3256 HoCP00-950 HoCP96-540 3257 HoCP00-945 HoCP96-540 3276 HoCP99-866 HoCP96-540 3322 HoCP00-950 LCP85-384 3328 HoCP99-866 LCP85-384 3345 HoCP00-945 LCP85-384 3417 N27 LCP85-384
XL01-001 XL01-050 XL01-059 XL01-215 XL01-460
Crosses evaluated at the LSU AgCenter research farm HoCP92-624 HoCP91-552 LCP86-454 LCP85-384 HoCP95-951 HoCP96-540 TucCP77-42 LCP85-384 Ho95-988 L99-238
Seedling cane yield (kg) = ndπr 2L/1000
[1]
where n = seedling stalk number, d = density at 1.0 g cm−3, r = stalk radius (in cm), and L = stalk height (in cm).
Data Analysis Using Artificial Neural Networks The training data consisted of 20% (30 seedlings grown at the LSU AgCenter) and 10% (28 seedlings grown at the USDA) of the original data. The input variables were stalk number, stalk height, and stalk diameter and the response was either to select (1) or reject (0) a seedling as determined by two experienced sugarcane breeders at each location. The training data were run in SAS enterprise miner (SAS Institute, 2007) to produce the coefficients of the multiple linear regressions. The data collected from 150 LSU AgCenter and 272 USDA seedlings constituted the prediction data. In the prediction data, the response values to either select (1) or reject (0) a seedling were coded as missing values and needed to be estimated by the model. The model selection criterion used was “average error” and the network architecture was the “generalized linear model.” The training technique used was the “Levenberg-Marquadt” set at 50 preliminary runs.
Coefficients of the Prediction Model, Probability Values, and Fit Statistics The ANN models use the training dataset to calculate coefficients of the prediction model, which represents the relative weighting of each input variable. The probability of either selecting or rejecting a seedling is calculated by multiplying the values of stalk number, stalk height, and stalk diameter by their respective coefficient as shown in Eq. [2] (for the data from the LSU AgCenter seedlings) and Eq. [3] (for the data from the USDA seedlings). p( Y = 1) = {exp[–50.2 + (1.38 × stalk no.) + (6.16 × stalk height) + (11.2 × stalk diam.)]} /{1 + exp[–50.2 + (1.38 × stalk no.) + (6.16 × stalk height) + (11.2 × stalk diam.)]}, [2]
CROP SCIENCE, VOL. 51, JANUARY– FEBRUARY 2011
Female parent
Male parent
HoCP00-945 HoCP00-950 L98-207 TUCCP77-42 TUCCP77-42 HoCP91-555 HoCP91-555 HoCP91-555
Ho94-856 Ho94-856 Ho94-856 HoCP99-866 L98-207 LCP85-384 L98-207 TUCCP77-42
p( Y = 1) = {exp[–18.1 + (0.04 × stalk no.) + (2.73 × stalk height) + (5.71 × stalk diam.)]} /{1 + exp[–18.1 + (0.04 × stalk no.) + (2.73 × stalk height) + (5.71 × stalk diam.)]}, [3] Only one probability (p) can be modeled: in this case, the probability to select. The probability to reject was, therefore, 1 – p. To predict a response, a threshold probability must be specified. If the probability to select is modeled, the response would be to select when the probability value was equal to or greater than the threshold value and to reject when the probability value was less than the threshold. In SAS ANN models, the default threshold is 0.5. Larger threshold values produce more stringent selection criteria and vice versa. The ANN model analysis produces six fit statistics that represent parameters that can be used to compare the model or equation for their ability to account for the variability in the data. The average profit (prediction power) was estimated as the correlation between the response variable (1 or 0) and probability (Agresti, 2007). A higher profit would mean the probability value was highly predictive of the response variable. The misclassification rate was estimated as the proportion of total observations that were classified by the model into different response categories from what was observed. Lower values would indicate correct model classification and accurate training dataset. The average squared error (ASE) was calculated as: ASE = SSE/N = (OR – Pp)2/N,
[4] in which SSE is the sum of the squared error, OR is the observed response, Pp is the prediction probability, and N is the number of observations in the training dataset. Smaller values would indicate better model fit. The fi nal prediction error (FPE) was estimated as: FPE = [SSE(N + P)]/[N(N – P)], [5] in which P is the number of parameters including the intercept. The FPE is an adjustment to ASE using (N + P)/(N – P). The adjustment penalizes for overparameterization (model complexity) or the inclusion of too many input variables. Overparameterization inflates FPE and increases prediction errors. It is generally desirable to achieve the best model fit by specifying the
WWW.CROPS.ORG
23
Table 2. Model fit statistics from artificial neural network analysis of sugarcane seedling data from the USDA and Louisiana State University Agricultural Center (LSU AgCenter) populations. Model fit statistics Average profit Misclassification rate Average squared error Final prediction error Akaike information criterion (AIC) Schwarz Bayesian criterion (SBC)
LSU AgCenter
USDA
0.61 0.07 0.06 0.08 19.79 25.52
0.36 0.11 0.13 0.17 31.72 37.05
simplest or most parsimonious model. As with ASE, lower values would indicate better model fit. The Akaike information criterion (AIC) (Akaike, 1974) and Schwarz Bayesian criterion (SBC) (Schwarz, 1978) were used to compare the relative model fit for two or more models. Lower values indicated better model fit.
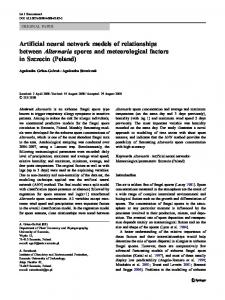
RESULTS Model Fitness and Probability Values The fit statistics produced higher prediction power for the LSU AgCenter than the USDA dataset (Table 2). Misclassification, ASE, FPE, AIC, and SBC values were greater for the USDA population, indicating poorer model fit of the data compared with that from the LSU AgCenter population. The distribution patterns of the two populations were evaluated graphically by plotting the estimated seedling cane yield (on the x axis) against their corresponding probability value (on the y axis). The LSU AgCenter data followed closely the theoretical, logistic cumulative distribution function (Casella and Berger, 2003) compared with the USDA data (Fig. 1). The distribution patterns depicted trends that were similar to the fit statistics (Table 2), confi rming the larger variability found within the USDA than the LSU AgCenter data.
The probability to either select or reject a seedling as calculated using Eq. [2] (for the LSU AgCenter data) and Eq. [3] (for the USDA data) are shown in Tables 3 and 4. The p(Y = 1) is the probability to select and p(Y = 0) is the probability to reject a seedling. The threshold probability value used was 0.5. When p(Y = 1) was equal to or greater than 0.5, the seedling was selected and categorized as select (1); otherwise it was categorized as reject (0). The column labeled ANN in Tables 3 and 4 represents the predicted categories. The input variables are included in the output and can aid the breeder in deciding what to do with borderline seedlings. Generally, seedlings were selected using higher probability values from the LSU AgCenter (Table 3) than the USDA (Table 4) population probably because the USDA population included a random sample of crosses from that program whereas the LSU AgCenter population involved elite crosses. Eighteen of 30 LSU AgCenter seedlings were selected with probability values ranging from 0.58 to 1.00 (mean = 0.88). Nine of 30 USDA seedlings were selected with probability values ranging from 0.53 to 0.91 (mean = 0.72). This indicated a greater precision of selection from the LSU AgCenter compared with the USDA population, reflecting the effect of the relative variability for cane yield in these populations, as depicted in Fig. 1 and 2. In Fig. 1, when the threshold for selecting a seedling was set at a probability value of >0.5, seedlings meeting this criterion had an estimated seedling cane yield greater than 7.5 kg, whereas in Fig. 2, using the 0.5 threshold, seedlings with estimated cane yield as low as 3.5 kg were included.
Discriminating Ability of Artificial Neural Network Models Versus Visual Selection The means for seedling stalk number, stalk height, stalk diameter, and estimated cane yield were calculated for each group of selected and rejected seedlings. The difference
Figure 1. The logistic cumulative distribution functions for estimated seedling cane yield (in kg) (x axis) plotted against posterior probabilities (y axis) for the Louisiana State University Agricultural Center (LSU AgCenter) (a) and USDA (b) populations.
24
WWW.CROPS.ORG
CROP SCIENCE, VOL. 51, JANUARY– FEBRUARY 2011
Table 3. Probability of selecting [p(Y = 1)] or rejecting [p(Y = 0)] a seedling, the predicted selection decision by the artificial neural network (ANN) model, the selection decision by the visual method (Visual), stalk number (Stalks), stalk height (Height), stalk diameter (Diameter), and seedling cane yield (Cane) for the first 30 seedlings derived from the Louisiana State University Agricultural Center (LSU AgCenter) population. Seedling
p(Y = 1)
p(Y = 0)
ANN
Visual
Stalks
Height (cm)
Diameter (cm)
Cane (kg)
1 2 3 4 5 6 7 8 9 10 11 12 13 14 15
1.00 0.09 0.31 1.00 1.00 0.01 0.00 1.00 0.00 0.87 0.03 1.00 0.91 0.13 1.00
0.00 0.91 0.69 0.00 0.00 0.99 1.00 0.00 1.00 0.13 0.97 0.00 0.09 0.87 0.00
1 0 0 1 1 0 0 1 0 1 0 1 1 0 1
1 0 0 1 1 0 0 1 0 1 0 1 1 0 1
23 11 9 25 20 12 12 16 4 11 10 17 10 6 14
237 225 250 240 250 190 170 240 240 235 240 260 240 240 245
1.70 1.68 1.93 2.12 1.70 1.51 1.34 1.84 2.11 2.00 1.63 2.33 2.13 2.25 2.08
12.38 5.49 6.59 21.19 11.35 4.08 2.88 10.21 3.36 8.12 5.01 18.85 8.56 5.73 11.66
16 17 18 19 20 21 22 23 24 25 26 27 28 29 30
0.90 1.00 0.34 0.01 0.00 0.91 1.00 0.33 1.00 0.58 0.00 1.00 0.74 1.00 0.84
0.10 0.00 0.66 0.99 1.00 0.09 0.00 0.67 0.00 0.42 1.00 0.00 0.26 0.00 0.16
1 1 0 0 0 1 1 0 1 1 0 1 1 1 1
0 1 0 0 0 1 1 1 1 1 0 1 1 1 1
14 23 10 10 8 16 19 11 13 10 8 19 14 18 13
220 230 220 205 240 230 230 215 255 235 230 240 230 220 235
1.75 1.90 1.98 1.72 1.68 1.45 1.72 1.88 2.23 1.98 1.48 1.63 1.58 1.66 1.74
7.41 15.00 6.78 4.77 4.26 6.08 10.16 6.57 12.95 7.24 3.17 9.52 6.32 8.57 7.27
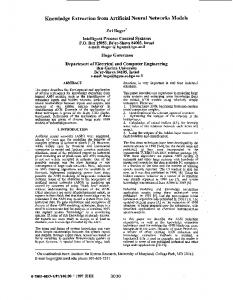
between the means of the selected and rejected seedlings was calculated and expressed as a percentage of the rejected seedlings (Table 5). This metric was used to describe and evaluate the discriminating ability of the ANN models and the visual method. A large percentage of the difference between the means of the selected and rejected seedlings was used as an indicator of greater discriminating ability. The ANN models produced greater discrimination between the selected and rejected seedlings than the visual method (Table 5, Fig. 2). The ANN models were twice (for the LSU AgCenter population) and 1.5 times (for the USDA population) more discriminating between the selected and rejected seedlings than the visual method. The seedlings selected by the ANN models produced more stalks than those selected by the visual method. These selected seedlings also produced thicker stalks for both populations and longer stalks for the USDA population. Further evaluation of the discriminating ability was done for each of the five families from the LSU AgCenter population (Table 6). The ANN model produced greater discrimination between the selected and rejected seedlings CROP SCIENCE, VOL. 51, JANUARY– FEBRUARY 2011
than the visual method for all the families. The seedlings selected by the ANN model also produced more stalks than those selected by the visual method. The stalks were thicker than those selected by the visual method. The magnitude of the discrimination of the ANN model was greater than that of the visual method, where the ANN model selected more seedlings than the visual method, for example, families XL01-001, XL01-050, XL01-059, and XL01-460 (Table 6). Where the number of seedlings selected was equal, for example, family XL01-215, the discriminating ability of the ANN model was very similar to that of the visual method.
Selection Efficiency of Artificial Neural Network Models Versus Visual Selection Improving selection efficiency is a challenge shared by sugarcane breeders. Selection efficiency is the ability to discard a seedling that would eventually produce low cane yield and/or select a seedling that would produce high cane yield. The number of seedlings selected by one method and rejected by the other and the number that performed better or worse than the population mean
WWW.CROPS.ORG
25
Table 4. Probability of selecting [p(Y = 1)] or rejecting [p(Y = 0)] a seedling, the predicted selection decision by the artificial neural network (ANN) model, the selection decision by the visual method (visual), stalk number (Stalks), stalk height (Height), stalk diameter (Diameter), and seedling cane yield (Cane) for the first 30 seedlings derived from the USDA population. Seedling
p(Y = 1)
p(Y = 0)
ANN
Visual
Stalks
Height (cm)
Diameter (cm)
Cane (kg)
1 2 3 4 5 6 7 8 9 10 11 12 13 14 15 16
0.53 0.05 0.08 0.53 0.33 0.05 0.12 0.11 0.75 0.07 0.48 0.91 0.03 0.85 0.29 0.02
0.47 0.95 0.92 0.47 0.67 0.95 0.88 0.89 0.25 0.93 0.52 0.09 0.97 0.15 0.71 0.98
1 0 0 1 0 0 0 0 1 0 0 1 0 1 0 0
0 0 0 1 0 0 0 0 1 0 0 1 0 1 0 0
19 10 22 20 19 6 15 5 15 4 14 6 11 24 7 11
231 188 168 206 201 188 206 208 224 178 193 239 163 208 229 163
1.95 1.67 1.78 2.07 1.95 1.72 1.73 1.77 2.18 1.83 2.13 2.40 1.70 2.30 1.87 1.67
13.11 4.12 9.20 13.87 11.41 2.62 7.27 2.56 12.55 1.87 9.63 6.49 4.07 20.75 4.40 3.93
17 18 19 20 21 22 23 24 25 26 27 28 29 30
0.35 0.02 0.28 0.23 0.13 0.87 0.75 0.14 0.12 0.29 0.11 0.48 0.70 0.61
0.65 0.98 0.72 0.77 0.87 0.13 0.25 0.86 0.88 0.71 0.89 0.52 0.3 0.39
0 0 0 0 0 1 1 0 0 0 0 0 1 1
1 0 0 0 0 0 0 0 0 0 0 0 1 0
10 15 20 9 11 5 5 10 2 4 24 2 8 10
213 191 226 216 203 216 249 224 185 224 211 224 211 229
1.97 1.45 1.78 1.86 1.78 2.43 2.13 1.72 1.93 1.92 1.62 2.08 2.25 2.08
6.49 4.73 11.25 5.28 5.56 5.01 4.44 5.21 1.08 2.60 10.44 1.52 6.71 7.78
Figure 2. Comparison of mean cane yield (in kg) for the seedlings selected and rejected using visual and artificial neural network models for the Louisiana State University Agricultural Center (LSU AgCenter) (a) and USDA (b) populations.
are shown in Table 7, whereas the mean performance of these seedlings is shown in Table 8. Generally, the visual method rejected more higher-yielding seedlings and 26
included more lower-yielding seedlings than the ANN model, indicating lower selection efficiency of the visual method (Table 7, Fig. 3). Seedlings selected by the ANN
WWW.CROPS.ORG
CROP SCIENCE, VOL. 51, JANUARY– FEBRUARY 2011
Table 5. Means for stalk number (Stalks), stalk height (Height), stalk diameter (Diameter), and cane yield (Cane) for seedlings selected (S) and rejected (R) by the visual and artificial neural network selection methods and the means expressed as a percent of rejected [(S – R)/R%] for the Louisiana State University Agricultural Center (LSU AgCenter) and USDA populations. Selection method Population LSU AgCenter
USDA
Trait
Rejected
Visual Selected
Stalks Height (cm) Diameter (cm) Cane (kg) Stalks Height (cm) Diameter (cm) Cane (kg)
9.74 211 2.17 7.62 12.17 207 1.73 6.02
15.58 228 2.17 12.62 11.89 222 2.13 9.37
(S – R)/R% 60 8 0 66 −2 8 24 56
Artificial neural network Rejected Selected (S – R)/R% 7.83 216 1.99 5.08 11.89 205 1.70 5.65
14.28 219 2.24 12.01 13.08 226 2.17 10.44
82 1 13 136 10 10 27 85
Table 6. Difference between the means of the selected and rejected seedlings expressed as a percent of the rejected seedlings for the seedlings selected using the visual method (Visual) and the artificial neural network (ANN) model for stalk number (Stalks), stalk height (Height), stalk diameter (Diameter) and cane yield (Cane) and the number of seedlings selected (No. Selected) for the individual crosses derived from the Louisiana State University Agricultural Center (LSU AgCenter) population. Trait Stalks Height (cm) Diameter (cm) Cane (kg) No. Selected
XL01-001 Visual ANN 89 −1 3 104 16
104 −1 6 126 21
XL01-050 Visual ANN 72 9 7 115 6
76 5 16 166 16
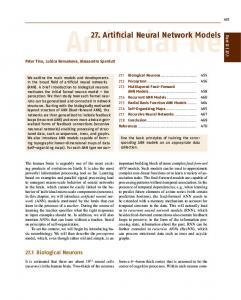
models but rejected by the visual method (Table 8) produced 75% (in the LSU AgCenter population) and 51% (in the USDA population) more cane yield than seedlings that were rejected by the ANN models but selected by the visual method (Table 8). The ANN model was, however, less effective when selecting from the USDA population. Recognizing that the USDA data provided a poorer fit to the model (Table 2, Fig. 1) than did the LSU AgCenter data, with experience, one could learn to adjust the threshold probability for the ANN model to further improve selection efficiency when dealing with this type of data.
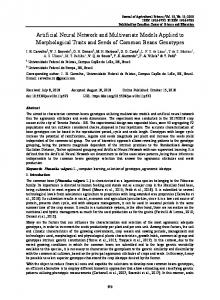
Seedling Cane Yield Increased with Increasing Probability Value We investigated the relationship between the estimated probability and cane yield value assigned to each seedling. The ANN output data were ranked in ascending order of probability. The 150 LSU AgCenter seedlings and the 272 USDA seedlings were divided into 10 groups each. Group 1 had the lowest probability of selecting a seedling and group 10 the highest. The means of each group for each trait were calculated. The means (on the y axis) were plotted against group probability rankings (on the x axis). The trends for cane yield and stalk number from the LSU AgCenter population were very similar and increased with probability rankings (Fig. 4). The trends for stalk height and diameter were less similar to that for cane yield and marginally increased with probability rankings. From the USDA population, the trends for diameter and stalk height were very similar to that for cane yield and CROP SCIENCE, VOL. 51, JANUARY– FEBRUARY 2011
XL01-059 Visual ANN 50 4 2 59 10
88 9 6 144 14
XL01-215 Visual ANN 71 7 7 119 18
77 7 6 126 18
XL01-460 Visual ANN 45 0 −14 73 7
60 2 14 100 27
Table 7. Number of seedlings that were rejected using artificial neural network (ANN) (after being selected during visual) and selected using ANN (after being rejected during visual), and numbers rejected (after producing higher cane yield than population mean) or selected (after producing lower cane than population mean) for the Louisiana State University Agricultural Center (LSU AgCenter) and USDA populations. Seedling numbers LSU AgCenter Rejected Selected USDA Rejected Selected
Rejected and Selected and produced higher produced lower cane yield cane yield
3/57 42/93
Visual = 21 ANN = 0
Visual = 17 ANN = 17
13/46 20/226
Visual = 88 ANN = 79
Visual = 14 ANN = 12
increased with probability rankings. The trend for stalk number showed no clear pattern across probability rankings. Stalk number was less important in determining cane yield in this population, probably because dry leaves were not stripped off the stalks as was done with the LSU AgCenter population. This made this trait more difficult and less efficient to appraise.
Artificial Neural Network Models Versus Visual Method at Identical Selection Rates Comparison of the ANN model and the visual method at different selection rates obscured their impact on selection. A more balanced comparison should use identical selection rates. Therefore, to produce a balanced comparison of the ANN models and the visual method during seedling selection, identical selection rates were used within each
WWW.CROPS.ORG
27
Figure 3. The mean cane yield (in kg) for the seedlings rejected by the artificial neural network (ANN) model and selected by the visual method (Rejected) and seedlings selected by the ANN model and rejected by the visual method (Selected) for the LSU AgCenter and USDA populations. Table 8. Means of the rejected and selected, and the difference of the means of selected (S) and rejected (R) expressed as a percent of rejected [(S – R)/R%] for stalk number, stalk height, stalk diameter and seedling cane yield for the Louisiana State University Agricultural Center (LSU AgCenter) and USDA populations. Trait Stalk number Stalks height (cm) Stalk diameter (cm) Cane yield (kg) † ‡
Rejected†
LSU AgCenter Selected‡
(S – R)/R%
Rejected
USDA Selected
(S – R)/R%
10.00 215 1.91 6.17
12.21 205 2.39 10.78
22 −4 25 75
11.31 212 1.97 7.09
14.65 226 2.12 10.74
30 7 8 51
Rejected refers to seedlings selected by the visual method and rejected by the ANN model. Selected refers to seedlings rejected by the visual method and selected by the ANN model.
population. From the LSU AgCenter population, 57 out of 150 seedlings (38%) were selected by the visual method whereas from the USDA population, 46 out of 272 (17%) were selected. From the LSU AgCenter population, the ANN model selected 96 out of the 150 seedlings (64%) and from the USDA population, 53 out of the 272 seedlings (19%). To produce identical comparisons, the visual selection rates within each population were used as standard for the ANN models. The number of the ANN modelselected seedlings was adjusted to equal that of the visual method after ranking the probability values. The means of the highest 38% for the LSU AgCenter population and 17% for the USDA population were used for the comparison (Table 9). The seedlings selected by the ANN model produced 16% (in the LSU AgCenter population) and 8% (in the USDA population) more cane yield than those selected by the visual method. The seedlings selected by the ANN model produced 8% more stalks that were thicker than those selected by the visual method. The selection rates achieved in this study (38% for the LSU AgCenter and 17% for the USDA populations) are atypical of the 5% (at the LSU AgCenter) and 10% (at the USDA) rates practiced in the regular breeding programs. In this study seedlings were selected for cane yield components alone and not for cane 28
yield components and Brix as is usually the case during routine seedling selection.
DISCUSSION The ANN model was superior to visual selection in identifying seedlings with high cane yield potential, as evidenced by several comparisons between the two selection methods. For example, the proportion of high yielding seedlings selected by the ANN model was greater than that selected by the visual method. This proportion increased when similar selection rates were used for both methods. Generally, seedlings selected by the ANN model produced more stalks that were thicker and longer than those selected by the visual method. The visual method rejected a greater proportion of seedlings that produced estimated cane yields higher than the population mean compared with the ANN model. A good number of these seedlings rejected by the visual method were selected by the ANN model. Conversely, the ANN model rejected low-yielding seedlings that were selected by the visual method. Because only a limited numbers of seedlings can be advanced to the next stage, the low efficiency of the visual method would greatly reduce the overall efficiency of a selection program. The ANN uses fast and automated computations and was superior to the visual method even for
WWW.CROPS.ORG
CROP SCIENCE, VOL. 51, JANUARY– FEBRUARY 2011
Figure 4. Trends for means of seedling stalk number, stalk height, stalk diameter, and cane yield (in kg) (y axis) plotted against the group probability rankings (x axis) for the Louisiana State University Agricultural Center (LSU AgCenter) (a) and USDA (b) populations. Table 9. Means for stalk number, stalk height, stalk diameter and estimated seedling cane yield of seedlings selected by the artificial neural network (ANN) models and the visual method (Visual), and of seedlings selected by the ANN method expressed as a percent of seedlings selected by the visual method (ANN % Visual) for the Louisiana State University Agricultural Center (LSU AgCenter) (38% selection rate) and USDA (17% selection rate) populations. Trait Stalk number Height (cm) Diameter (cm) Cane yield (kg)
Visual
LSU AgCenter ANN
15.58 228 2.12 12.62
16.77 225 2.24 14.65
a variable dataset with poor model fit, as was the case with the USDA population. A good aspect of the ANN model is that as the breeder gains experience, he/she will be in a better position to recognize data with a poor model fit and adjust the probability threshold accordingly. The ANN model selected seedlings based on those traits that exhibited the largest variability within the population. CROP SCIENCE, VOL. 51, JANUARY– FEBRUARY 2011
ANN % Visual 108 98 106 116
Visual
USDA ANN
ANN % Visual
11.89 222 2.13 9.37
12.87 228 2.19 10.45
108 102 103 108
Conversely, traits with low variability would be less associated with the estimated seedling-cane yield and have little influence in determining the probability value assigned to each seedling. Therefore, the ability of the ANN model to use the most genetically variable traits during seedling selection leads to higher selection efficiency than was the case with the visual method. In this study, the ANN
WWW.CROPS.ORG
29
models selected seedlings that produced more stalks than visual selection. Research done on early selection stages in Zimbabwe showed that stalk number was positively associated with cane yield (Zhou, 2004b). In Louisiana, seedlings producing high stalk number are routinely selected to enhance cane yield and ratooning ability. Because land is always a limiting resource in most breeding programs, the breeder has little choice but to design the best allocation of this resource. The ANN model offers the breeder greater flexibility for adjusting the number of seedlings to advance during seedling selection. The breeder can increase or decrease the number of seedlings to advance by decreasing or increasing the threshold probability. These adjustments can be used to refine the selection process using trait values that can be included in the output, for example, Brix, disease and insect resistance scores that were not used in this study to develop the ANN prediction model. Efficiency is also increased when using the ANN model. For example, to reduce the number of seedlings to be advanced using the visual method, the breeder would have to go back to the field and review all the selected seedlings and decide on the seedlings to discard. To increase the number of seedlings to be advanced, the breeder would have an equally daunting task of physically reviewing all the rejected seedlings to identify those seedlings that would have been included. With the ANN model, this can be easily accomplished by adjusting the probability threshold and associated trait values. Applying the ANN model for seedling selection would require the measurement of variables such as stalk number, stalk height, stalk diameter, Brix, and disease and pest resistance. This could be an added cost in breeding programs, for example, in the United States and Australia, where these traits are not routinely measured at this stage of the program. These traits could be measured before selection on a sample of seedlings from each cross and the ANN model used as a tool to provide guidelines as to what selection rates to apply in each cross during selection. However, in some programs, for example, the Zimbabwe sugarcane breeding program where the cost of labor is relatively cheap and mechanical harvesting of seedlings is sometimes unavailable these variables are routinely measured as a means to evaluate families at the seedling stage (Zhou, 2004a). Measurement costs can be reduced by excluding seedlings that are too inferior and would probably never be selected. Visual scores for stalk number, stalk height, and stalk diameter can be used as input variables. Visual scores would be easier and quicker to collect but may reduce precision. Scores may be more useful as a validation tool and their precision may improve with time as the staff gets more experienced. The success of the ANN model is highly dependent on the amount, suitability, and precision of measurements of the training dataset used (Pandolfi et al., 2009). 30
Pandolfi et al. (2009) noted that the ANN model training data should capture the variation in the population to attain the best results. However, they reported that even when the training data were not statistically representative of the target population, the ANN models appeared capable of generalizations beyond the training data and produced correct results even in different populations. Pandolfi et al. (2009) applied the ANN model for classification of tea accessions. In their study, it was important to capture the variation in the population. This may not be entirely necessary when the ANN model is used as a decision support tool for selection, as the intent is to shift the variation of the population toward seedlings with higher cane yield values. In sugarcane seedling selection, the training data can be collected from part of the seedling population or from special populations created from some elite families. This population would be a reservoir of the ideal trait combinations. With selection, the objective is to shift the population toward a desired direction of trait values such as high cane yield. Therefore, the ideal training data need not have variability similar to that of the target population. Rather, the training data should be a population with the desired combination of trait values that will be mimicked by the selection process. In this case, the ANN models provide the added advantage of allowing the breeder to directionally shift the population toward high cane yield more objectively than the visual method does. In summary, the ANN model is a statistical tool that can be used to increase selection efficiency in a sugarcane breeding program. Here, we have demonstrated the potential of the ANN model as a decision support tool for selection in sugarcane using the seedling population. The ANN model was superior to the visual method in discriminating between seedlings with high and low cane yield. The magnitude of the difference between the selected and rejected seedlings was greater for the ANN model than for the visual method. The magnitude of the difference increased when similar selection rates were applied for the visual method and the ANN model and would have been even larger had we weighed the seedlings to estimate cane yield for the training dataset. The computations in the ANN model are automated by the SAS software and therefore large numbers of seedlings can be evaluated quickly. The output in neural network models provides a decision to select or reject a seedling based on a threshold probability that is user defined. The ANN model compels the breeder to consider all traits simultaneously when deciding whether to select or rejects a clone as opposed to judging the merit of a clone by considering multiple traits independently. Kaul et al. (2005) found that ANN models consistently produced more accurate yield predictions than multiple regression models in soybeans [Glycine max (L.) Merr.] and corn (Zea mays L.). This
WWW.CROPS.ORG
CROP SCIENCE, VOL. 51, JANUARY– FEBRUARY 2011
was apparently because in addition to linear relationships, nonlinear relationships overlooked by other methods can be determined by ANN models with little a priori knowledge of the functional relationship (Elizondo et al., 1994). Where there are labor constraints in the breeding program, the training data can be collected from part of the seedling population. The ANN model can then be used to predict selection rates to be applied in each cross during seedling selection as well as to provide trait weighting insight into the subjective selection process. Acknowledgments This research was supported by a grant from The American Sugar Cane League of the USA, Inc. The sugarcane breeding staff at the USDA and LSU AgCenter provided much needed technical assistance during the field work. Two anonymous reviewers provided critical reviews as well as tremendous insights and input that helped to strengthen the manuscript. All are gratefully acknowledged.
References Agresti, A. 2007. An introduction to categorical data analysis. 2nd ed. John Wiley & Sons, Hoboken, NJ. Akaike, H. 1974. A new look at the statistical model identification. IEEE Trans. Automatic Control AIC 19:716–723. Allison, P.D. 2003. Logistic regression using the SAS system: Theory and applications. SAS Inst., Cary, NC. Batchelor, W.D., X.B. Yang, and A.T. Tschanz. 1997. Development of a neural network for soybean rust development. Trans. ASAE 40:247–252. Casella, G., and R.L. Berger. 2003. Statistical inference. 2nd ed. Thomson Publications, Belmont, CA. Chang, Y.S., and S.B. Milligan. 1992. Estimating the potential of sugarcane families to produce elite genotypes using univariate cross prediction methods. Theor. Appl. Genet. 84:662–671. De Sousa-Vieira, O., and S.B. Milligan. 1999. Intra-row spacing and family x environment effects on sugarcane family evaluation. Crop Sci. 39:358–364. Elizondo, D.A., R.W. McClendon, and G. Hoogenboom. 1994. Neural network models for predicting flowering and physiological maturity of soybean. Trans. ASAE 37:981–988. Fausett, L. 1994. Fundamentals of neural networks. Prentice Hall, Englewood Cliffs, NJ. Gravois, K.A., S.B. Milligan, and F.A. Martin. 1991. Indirect selection for increased sucrose yield in early sugarcane testing stages. Field Crops Res. 26:67–73. Gurney, K. 1997. An introduction to neural networks. UCL Press, London, UK. Hertz, J., R.G. Palmer, and A.S. Krogh. 1990. Introduction to the theory of neural computation. Perseus Books, New York, NY. Huang, S., K.K. Tan, and K.Z. Tang. 2004. Neural network: Theory and applications. Research Studies Press Ltd. Baldock, Hertfordshire, UK. Iglesias, A., B. Arcay, and J.M. Cotos. 2006. Connectionist systems for fi shing prediction. p. 265–296. In J.R. Rabunal and J. Dorado (ed.) Artificial neural networks in real-life applications. Idea Group Publishing, London, UK.
CROP SCIENCE, VOL. 51, JANUARY– FEBRUARY 2011
Ji, B., Y. Sun, S. Yang, and J. Wan. 2007. Artificial neural networks for rice yield prediction in mountainous regions. J. Agric. Sci. 145:249–261. Kang, M.S., J.D. Miller, and P.Y.P. Tai. 1983. Genetic and phenotypic path analysis and heritability in sugarcane. Crop Sci. 23:643–647. Kang, M.S., P.Y.P. Tai, and J.D. Miller. 1991. Genetic and phenotypic path analyses in sugarcane: Artificially created relationships. Crop Sci. 31:1684–1686. Kaul, M., R.L. Hill, and C. Walthall. 2005. Artificial neural networks for corn and soybean yield prediction. Agric. Syst. 85:1–18. Lee, K.C., and T.Y. Paik. 2006. A neural approach to cost minimization in a production scheduling setting. p. 297–313. In J.R. Rabunal and J. Dorado (ed.) Artificial neural networks in real-life applications. Idea Group Publishing, London, UK. Masters, T. 1993. Practical neural network recipes in C++. Academic Press, San Diego, CA. Miller, J.D., and N.I. James. 1974. The influence of stalk density on cane yield. Proc. Int. Soc. Sugarcane Technol. 15:177–184. Milligan, S.B., K.A. Gravois, K.P. Bischoff, and F.A. Martin. 1990. Crop effects on broad sense heritabilities and genetic variances of sugarcane yield components. Crop Sci. 30:344–349. Mugnai, S., C. Pandolfi, E. Azzarello, E. Masi, and S. Mancuso. 2008. Camellia japonica L. genotypes identified by an artificial neural network based on phyllometric and fractal parameters. Plant Syst. Evol. 270:95–108. Nelson, M.N., and W.T. Illingworth. 1991. A practical guide to neural nets. Addison-Wesley Publishing Company, Reading, MA. Pandolfi, C., S. Mugnai, S. Bergamasco, E. Masi, and S. Mancuso. 2009. Artificial neural networks as a tool for plant identification: A case study on Vietnamese tea accessions. Euphytica 166:411–421. Perkins, R., and A. Brabazon. 2006. Predicting credit ratings with a GA-MLP hybrid. p. 220–237. In J.R. Rabunal and J. Dorado (ed.) Artificial neural networks in real-life applications. Idea Group Publishing, London, UK. SAS Institute. 2007. The SAS system for Windows version 9.1.3. SAS Inst., Cary, NC. Schaap, M., and W. Bouten. 1996. Modeling water retention curves of sandy soils using neural networks. Water Resour. Res. 32:3033–3040. Schwarz, G. 1978. Estimating the dimension of a model. Ann. Stat. 6:461–464. Sethuraman, J. 2006. Soft computing approach for bond rating prediction. p. 202–219. In J.R. Rabunal and J. Dorado (ed.) Artificial neural networks in real-life applications. Idea Group Publishing, London, UK. Smith, M. 1993. Neural networks for statistical modeling. Van Nostrand Reinhold, New York, NY. Starrett, S.K., S.K. Starrett, and G.L. Adams. 1997. Using artificial neural networks and regression to predict percentage of applied nitrogen leached under turfgrass. Commun. Soil Sci. Plant Anal. 28:497–507. Zhou, M.M. 2004a. Strategies for variety selection in the breeding program at the Zimbabwe Sugar Association Experiment Station. Proc. South Afric. Sugar Technol. Assoc. 78: 125–131. Zhou, M.M. 2004b. Stalk population control of yield, quality and agronomic traits of sugarcane population in early selection stages. Sugar Cane Int. 22:14–20.
WWW.CROPS.ORG
31