B A S E
Biotechnol. Agron. Soc. Environ. 2001 5 (3), 159–165
Artificial olfaction systems: principles and applications to food analysis Corrado Di Natale (1), Antonella Macagnano (1), Roberto Paolesse (2), Arnaldo D’Amico (1) (1) Department of Electronic Engineering. University of Rome “Tor Vergata”. Via di Tor Vergata, 110. I–00133 Roma (Italy). E-mail :
[email protected] (2) Department of Chemical Science and Technology. University of Rome “Tor Vergata”. Via della Ricerca Scientifica. I–00133 Roma (Italy).
Received 20 June 2001, accepted 28 August 2001. Among the numerous applications of electronic nose technology, the analysis of foodstuff is one of the most promising and also the most travelled road towards industrial applications. On the other hands, since human senses are strongly involved in the interaction with foods the analysis of food provides an excellent field to compare the performances of natural and artificial olfaction systems. The electronic nose, being non-destructive and, in principle, directly correlated with the consumer perceptions, is a good candidate to develop quality evaluation tools for quality assessment. In this paper, the application of electronic nose to the evaluation of quality of foods is discussed. As selected example, the measure of quality of fruit is outlined. The experiments described have been performed with an electronic nose developed by the authors and of which a description is also given. Keywords. Electronic nose, quality, organoleptic analysis, oranges, apples. Systèmes artificiels d’olfaction : principes et applications à l’analyse des aliments. Parmi les multiples applications de la technologie du nez électronique, l’analyse des denrées alimentaires est l’une des applications les plus prometteuses et c’est aussi dans ce domaine que la recherche d’une exploitation industrielle est la plus active. Par ailleurs, compte tenu du fait que nos sens nous permettent une appréciation des aliments, il est possible de comparer les performances des systèmes naturels et artificiels d’olfaction. Le nez électronique étant un système non-destructif en principe bien corrélé à la perception du consommateur, il constitue une piste intéressante pour développer des outils valables d’appréciation de la qualité des aliments. Dans cet article, les applications du nez électronique en rapport avec l’évaluation de la qualité des aliments sont discutées. À titre d’exemple, nous traiterons de la détermination de la qualité de fruits. Les expériences décrites ont été effectuées au moyen d’un nez électronique conçu par les auteurs et une description en est fournie. Mots-clés. Nez électronique, qualité, analyse organoleptique, orange, pomme.
1. INTRODUCTION Food analysis is a complex discipline involving many different basic sciences. A manifold of different principles of instrumental is currently investigated and used for the analysis of foods and beverages. At industrial level, the objectives of these measurements are mostly concerned with the safety (e.g. the search for contaminants), the composition (to individuate the basic constituents), the effects of food treatment and processing, and so on. For each of these aspects, a multitude of techniques are currently studied and developed. Among these, there is an increasing interest for non-destructive methods. These are required to assist in the complex classification of fresh
products, in order to optimize the quality evaluation and to enhance the marketability of the products. Besides the above-mentioned objectives, recently there has been a strong increase for the certification of quality. At the time of strong globalization of productions and markets, quality is becoming one of the latest trend in food marketing. For instance, in the protection of typical products that may be identified with certain animal or vegetable species or with particular production methods. To this regard, we are witnessing the extension of the same classification criteria traditionally adopted for wines to foodstuffs like meats and fruits. Quality is a global character of a food, it is concerned with all the aspects of the interaction
160
Biotechnol. Agron. Soc. Environ. 2001 5 (3), 159–165
between food and consumers. So that, the instruments “par excellence” to determine quality are the human senses. Actually, trained panel of tasters are utilized to determine and label the criteria of quality, to assess the quality of food, and to help the development of new products. Although a science of panel has been assessed since many years (sensory analysis), the operations of panels are affected by imprecision, are scarcely repeatable, and a panel cannot be utilized for routine operation. One of the major difficulties with panels is the comparison of analyses done at different times. For instance, the evaluation of wines performed in two different years may give rise to non comparable results. Notwithstanding these limitations, the importance of panels is growing. As an example, European Union standards to assign market values to olive oils are implemented with the help of panels. For these reasons, it is important to replace the evaluation by the panels with some instrumental technique able to carry out in real-time the same information but in a reproducible and stable way. The information contained in the headspace of foods is mostly studied with the conventional analytical chemistry equipment (such as gas chromatography and mass spectroscopy). Correlation between quality aspects of food and beverage and the composition of their headspace (both in quantitative and qualitative terms) has been found in many different cases, e.g. for fish (Kawai, 1996). Despite these encouraging findings, the measure of the composition of headspaces did not result in any practical instrumentation, of industrial use, to measure the quality. Currently, the information from the headspace is mostly exploited by the human senses of the panels that provide their judgements about the quality of products. The development of artificial olfaction machines (electronic noses) easy to use, portable, and with a simplified sampling method, appears extremely appealing in this field. It could make possible the practical exploitation of a fundamental source of information to determine food and beverage quality. Noteworthy too is the liquid counterpart of electronic noses, namely array of sensors working in solution (the so-called electronic tongue) which are of extreme interest to characterize beverages and, in some cases, foods. For all of these reasons, foods and beverages are the most widely used field of application of electronic noses, even if a certain distance may exist between available results in literature and industrial necessities. In section 2 a survey of the applications available in literature is given with the discussion of general arguments about the application of electronic noses to this field. In section 3 a selected case will present an electronic nose developed by the authors.
C. Di Natale, A. Macagnano, R. Paolesse, A. D’Amico
2. FOOD ANALYSIS WITH ELECTRONIC NOSES It has to be said that many of the papers published in this area originated from the necessity of the electronic nose researchers to test the recognition capabilities of their sensor array. As a consequence, these papers don’t always deal with arguments of interest for food industries. This is the case, for instance, with the classification of wines of different denominations, while the industry in the sector may have been more interested to study differences occurring among wines of the same denomination. A general problem about the application of electronic noses to food analysis is the sampling procedure. Electronic noses do not measure the sample, but rather a sort of image. This image (i.e. the composition of the headspace) may, in some cases, be very different from the sample itself. The concentration in the headspace of a compound present, for instance, in a liquid phase, is related to the vapour pressure and to the liquid phase concentration of the compound, and it is a function of the temperature. This means that more volatile compounds tend to be more abundant in the headspace than their relative abundance in the sample. Furthermore, the headspace changes dynamically with the variation of temperature. It is well known that for each foodstuff an optimal temperature exists at which the richest expression of the aroma is achieved. A classical example of this is found in red wine and spirits (such as cognac). The frame outlined above holds for ideal solutions, namely those for which the mixing enthalpy is zero. In this case, the Raoult’s law applies and changes of temperature produce a sort of scaling of all the headspace concentrations (Alberty, 1983). For nonideal liquids (e.g. water – ethanol mixtures) significant deviations from Raoult’s law can occur, and temperature variations result in a progressive distortion of the headspace composition. Foods are almost always complex and non-ideal mixtures, therefore, sampling has to be carefully designed, and when sensory analysis is involved as a reference method, the use of the same temperature range is a constraint to achieve significant results. 3. A STUDY CASE: LIBRANOSE, THE ROME “TOR VERGATA” ELECTRONIC NOSE Electronic noses have been studied at the University of Rome Tor Vergata since 1990. In 1995 the study of sensors based on porphyrins started. These studied resulted today in LibraNose. LibraNose is based on an array of Thickness Shear Mode Resonators (TSMR) also known in literature as
Artificial olfaction systems in food analysis
Quartz Microbalance (QMB) sensors. The chemical sensitivity is given by molecular film of pyrrolic macrocycles (mostly metalloporphyrins and similar compounds). In the current configuration eight sensors are used (D’Amico et al., 1998). The most well known pyrrolic macrocycles are porphyrins and pthalocyanines. The sensing properties of phtalocyanines have been studied extensively during the past years, while porphyrins were rarely utilized excepted for their optical properties in sensors to be used in solutions. In spite of this, porphyrins are among the most important molecules in Nature, their functions as complexing ligands or redox catalysts are essential for all organisms (Dolphine, 1978). The mimicking of their biological functions has been so attractive that it can be considered important for their choice as fundamental component of sensor systems. A number of features make porphyrins eligible as “sensing material” able to detect the volatile organic compounds. Porphyrins are rather stable and their properties can be fine-tuned by simple modifications of their basic molecular structure. The coordinated metal, the lateral substituents, and the structure of the macrocyclic skeleton influence the coordination and the related sensing properties (Brunink et al., 1996; Di Natale et al., 1998). The adsorption properties of solid state porphyrins are characterized by large sensitivities and wide selectivity: both of these features are particularly appealing for electronic nose applications. While the wide selectivity is generally related to weak interactions (such as Van der Waals force and hydrogen bonding), an additional term, due to the coordination of analytes, has to be taken into account. The double interaction gives rise to a non-linear adsorption isotherm resulting, e.g. from specific π-π interaction between the aromatic systems of porphyrin and an aromatic analyte (such as benzene). This interaction takes place at low concentration of benzene and it is ruled by a Langmuir isotherm while at higher concentration, after the saturation of the specific sites only the non-specific adsorption occurs and the shape of the isotherm becomes linear (Henrytype behaviour) (Paolesse et al., 1999). In general, the selectivity frame of metalloporphyrins towards different analytes depends on several factors, such as lateral substituents, solid phase packing, deposition techniques and so on. Among them, a key factors is the metal coordinated to the porphyrin ligand; coordination of the analyte to the central metal contributes significantly to sensing material–volatile compound interactions. The adsorption of analytes into solid state porphyrin layers induces the variation of physical quantities. Each of these quantities can be transformed in an electrical signal matching the porphyrin layer
161
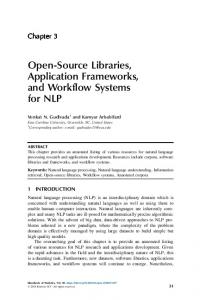
with a proper transducer. Porphyrin-based sensors have been demonstrated to work with different basic transducers such as TSMR, surface acoustic wave, conductivity, work function, and optical properties (D’Amico et al., 2000). TSMR sensors have been chosen for the implementation of a porphyrin-based electronic nose. These sensors consist in a thin slab of crystalline quartz, cut along a certain symmetrical axis, usually AT-cut, to obtain material able to sustain bulk electroacoustical oscillation at frequencies from 5 to 30 MHz. The quartz property making it interesting as sensors is that the resonance frequency is, in a limited linear range, inversely proportional to the mass gravitating onto the surface of the quartz. This behaviour is exploited to turn the quartz into a chemical sensor when some chemically interactive material, able to capture molecules from the environment, is used as coating. First studies on porphyrin-coated QMB evidenced the fundamental properties of these materials, namely the role-played in defining the performances of the sensor by both the metal, in metalloporphyrin complexes, and the lateral substituents. Results always confirmed a wide selectivity range that can be oriented changing the metal and the lateral substituents. This property fits very well with the general requirements of sensors to be employed in electronic noses. In figure 1, a PCA(Principal Component Analysis) score plot shows the aptitude of the LibraNose to distinguish among different volatile compounds. The instrument works linked to an external computer, where a software manages measurements, data collection, and analysis. Pneumatic components (pump and valves) are installed on-board to provide the necessary sample delivery to the sensor chamber (Figure 2).
4. SOME RESULTS OBTAINED IN QUALITY ANALYSIS OF FRUITS 4.1. Oranges experiment This experiment aimed at measuring the aroma decay of oranges over a period of time of about one month. Oranges have been bought over the counter, they were taken from the same crate and likely they have been harvested at the same time and underwent the same post-harvest treatment. Fruits had the same size (same weight and curvature radius, approximately). In order to remove the wax that is normally applied to fruits each orange has been washed with neutral soap, and accurately dried. Single oranges were then placed in non-hermetic bags and stored at room temperature for the whole period of the experiment.
162
Biotechnol. Agron. Soc. Environ. 2001 5 (3), 159–165
C. Di Natale, A. Macagnano, R. Paolesse, A. D’Amico
biplot: (0) normalized scores, (+) loadings 0.5 0.4 0.3
ethanol diethylamine
0.2 0.1
acetic acid
propanal
0 pentane
-0.1 -0.2
dimethylsulphide
-0.3 -0.4 benzene
-0.5 -0.4
-0.3 -0.2
-0.1
0
0.1
0.2
0.3
0.4
0.5
0.6
PC 1 (47.31%)
Figure 1. PCA biplot of scores and loadings of an experiment aimed at evaluating the discrimination of a number of Volatile Organic Compounds (VOC) by means of arrays of porphyrins based QMB sensors. Scores are indicated by circles and loadings by crosses. Loadings from 1 to 7 are related to a Tetraphenylporphyrin functionalized with different metals (in order: Cobalt, Molybdenum, Copper, Iron, Vanadium, Nickel and Chromium) while from 8 to 14 the same Cobalt-tetraphenylporphyrin is used but with different functional groups at lateral positions. The plot points out a different behaviour of the sensitivity according to the used metal ion. It is also worth to note that compounds are separated in four main groups: amines, aromatic compounds, alcohols with acids, and aldehydes with alkanes. The separation indicates the way VOCs interact with porphyrin film. — Graphique ACP (Analyse en composantes principales) reprenant les scores (cercles) et les “loadings” (croix) d’une expérience visant à évaluer la discrimination de composés organiques volatiles au moyen d’un senseur QMB (Quartz Microbalance) à barrette à base de porphyrines. Les “loadings” de 1 à 7 concernent des tétraphénylporphyrines fonctionnalisées à l’aide de divers métaux (dans l’ordre : cobalt, molybdène,cuivre, fer, vanadium, nickel et chrome), tandis que, de 8 à 14, il s’agit d’une tétraphénylporphyrine associée à du cobalt mais comprenant des groupements fonctionnels distincts dans les positions latérales. Le graphique souligne les différences de sensibilité selon l’ion métallique employé. Il en ressort aussi que les composés se séparent en quatre groupes principaux : amines, composés aromatiques, alcools/acides et aldéhydes/alcanes. Cette séparation montre comment le film porphyrinique interagit avec les composés organiques volatiles.
For the electronic nose measurements, each sample was closed in a sealed flask endowed with inlet and outlet valve. Flasks were left at constant temperature (typically 30°C) for 20 minutes in order to reach a stable partial pressure of volatile compounds. The flask headspace was then fluxed inside the sensor chamber of the electronic nose. Considering the
Figure 2. Picture of the currently available versions of LibraNose. The instrument is shown on the left side connected to a notebook computer — Version actuellement disponible du LibraNose. L’instrument se situe à gauche de l’ordinateur portable.
necessary cleaning of the sensors, a single measurement was performed in about 15 minutes. Figure 3 shows the bi-plot of a PLS (Partial Least Square) analysis of data collected in the oranges experiment. The objective of the PLS was the estimation of the storage time. About 90% of the total variance of the data is explained along the first two latent variables. The scores of the data (plotted as circles) put in evidence three main classes. The first is related to the very beginning of the experiment (first and second day), the second class contains a large portion of the experiment up to day 17, while the third class contains data taken after the 24th day. Figure 4 shows the performance of the PLS in estimating the storage days of the oranges. A mean error of about two days is observed. The modification of headspace due to ageing is expected to be a non linear process from a qualitative and quantitative point of view, so that PLS is expected to give only limited performances. Better performances could be achieved using non-linear estimators. It has to be reminded that a reliable neural network model requires a large number of calibration data. For this reason, modelbased algorithms (such as PLS) are here adopted. This choice brings to an underestimation of the achievable results. 4.2. Apples experiment These measurements have been performed at the Flanders Centre for Post-Harvest Technology of the Catholic University of Leuven (Belgium) during a collective experiment in the frame of the European Union funded Concerted Action “Artificial Sensing Techniques Estimating Quality” (ASTEQ).
Artificial olfaction systems in food analysis 0.3
163
Biplot: (o) normalized scores, (+) loadings
35
0.2
30
0.1
true PLS estimated
25
0 20
-0.1 -0.2
15
-0.3
10
-0.4 5
-0.5 -0.6 -0.7 -0.3
0 -0.2
-0.1
0
0.1
0.2
0.3
0.4
0.5
LV 1 (72.66%)
Figure 3. Simultaneous plot of scores and loading of the PLS of oranges experiment data-set. Scores are indicated by circles, the numbers indicate the storage days. Sensors loadings are labelled by crosses — Graphique combiné des scores et “loadings” du modèle PLS (régression par les moindres carrés) du lot de données pour l’essai sur oranges. Les scores sont représentés par des cercles, les nombres indiquent la durée de stockage en jours, les “loadings” sont représentés par une croix.
-5 0
5
10
15
20
25
30
Samples
Figure 4. True and estimated storage days of oranges as evaluated by PLS. Mean errors are approximately of two days — Valeurs réelles et estimées (par PLS) de la durée de stockage des oranges. Les erreurs moyennes sont d’environ deux jours.
40 30
During the week several different techniques have been applied to measure the presence and the amount of mealiness (internal defect due to post-harvest overripening process) and skin damages (bruises and cuts). Only the measurements related to the electronic nose previously introduced are discussed in this paper. In these measurements apples of Cox’s variety were prepared. In the mealiness experiment, apples without mealiness and with two levels of mealiness were selected. The skin damage experiment described here was aimed at detecting the presence of cuts on the apple skin. Cuts were done with a tool that provided gauged and reproducible cuts. Each apple was measured with the same protocol as the one used for oranges and described in the previous sub-section. Figure 5 shows the apple mealiness experiment projected along the first two latent variables obtained by a discriminant analysis calculated with PLS (PLSDA with DA for Discriminant Analysis). In this experiment apples were divided in three classes according to their presumed amount of mealiness. The mealiness was assumed to be present as a post-harvest over-ripening effect. In the plot the classes one and three may be reasonably considered as separated one of each other, while class two is rather spread over the other two classes. An anomalous behaviour has been observed for the samples circled with a continuous line in figure 5. A
20 10 0 -10 -20 -30 -40 100
150
200
250
300
350
400
450
LV 1 (99.28%)
Figure 5. Score plot of the first two latent variables, of PLS-DA, of the apple mealiness experiment. Numbers indicate the class. Class 1 is related to apples without defects, and classes 2, and 3 contain apples with two levels of mealiness. Full circled samples (displayed on the right side of the plot) belong to class 2 but they were found with cuts on the skin. — Graphique représentant les deux premières variables latentes en PLS-DA (DA pour analyse discriminante) de l’expérience portant sur la farinosité des pommes. Les numéros correspondent aux groupes : 1 = pommes sans défaut, 2 et 3 = pommes à deux niveaux distincts de farinosité. L’ellipse en trait continu (partie droite du graphe) reprend des échantillons relevant du groupe 2 mais pourvus d’entailles dans la pelure.
164
Biotechnol. Agron. Soc. Environ. 2001 5 (3), 159–165
close inspection of these samples, which belonged to class 2, revealed the presence of a cut in the skin. It is important to note that the skin damage produces a larger effect than mealiness on electronic nose measurement. It is worth to observe that the first latent variable carries the 99% of the data variance. It is important to consider that the latent variables do not coincide with the principal components, indeed the PLS-DA latent variables are those directions that maximize the class separation. The high percentage of explained variance along the first latent variable indicates that the classes are aligned along a common direction. This could be defined as a sort of “defects growing direction” considering that also the skin damaged samples are plotted, along the same direction, just after the class of more mealy apples. This feature suggests that the headspaces of apples with different mealiness are approximately the same from the qualitative point of view, and they differ mainly for the altered concentrations. This situation leads to a very high correlation among the responses of different sensors, and consequently, to the reduction of meaningful latent variables. The sensitivity of the electronic nose to skin cuts is displayed in figure 6. This figure shows the PLS-DA
40
20
0
-20
-40
-60
-80 100
200
300
400
500
600
700
800
LV 1 (89.20%)
Figure 6. Score plot of the first two latent variables, of PLS-DA, of the apple skin damage experiment. Class label appears in figures. The experiment concerned with three apples. The path, for each apple, leading from no damage to two cuts applied on the skin is also shown — Graphique des scores des deux premières variables latentes en PLSDAde l’essai des pommes entamées au niveau de la pelure. Les numéros de groupes sont renseignés. L’essai portait sur trois pommes. Un tracé indique, par pomme, où elle se situe dans le graphe lorsqu’elle est intacte et ensuite après une ou deux entailles.
C. Di Natale, A. Macagnano, R. Paolesse, A. D’Amico
score plot of the first two latent variables. In this experiment the skin of three Cox’s apples without post-harvest ripening effects (class one of the mealiness experiment), has been artificially damaged with controlled cuts. In the plot three classes appear related to no cuts, one cut, and two cuts. The score plot shows that the electronic nose is more sensitive to the transition between no cut – one cut than to the increase of the entity of the skin damage. Differently from the mealiness experiment, the 99% of the variance is carried by the ensemble of the first two latent variables. This indicates that the sensors correlation is less than in the mealiness case and that beside the concentration effects (due to the fact that the flesh, through the cut in contact with air, is more volatile than the skin) oxidation processes in the flesh give rise to novel volatile compounds.
5. CONCLUSIONS The quality of foods and beverages is certainly among the most explored area of applications of electronic noses. Nonetheless, research in this field was mostly performed at academic level, and in many cases the results are promising but only rarely they met an immediate industrial exploitation. The field still requires an effort in terms of basic research. Previous investigations were essentially focussed on the improvement of sensors, while other items, like for instance the reliability of the sampling systems, have been left a little bit behind. The results achieved so far are a sure basis to build up future developments towards reliable and industrially applicable quality measurement systems. To this regard, the co-operation between electronic nose researchers and food scientists is necessary in order to customize a general-purpose technology (like the electronic nose) to the specific requirements of foods and beverages industries. In these interactions, it has to be considered that the electronic nose is not a classical analytical instrument, it does not provide any separation of component (analysis in Greek means decomposition). For the first time natural olfaction working principle is exploited to obtain a chemical instrument. This is a sort of cultural revolution that has still to permeate the education and the mentality of end-users. Acknowledgement The work described here has been partly funded by the European Union funded Concerted Action “Artificial Sensing Techniques for Estimating Quality” (FAIR5-CT973516).
Artificial olfaction systems in food analysis Bibliography Alberty RA. (1983). Physical Chemistry (sixth edition). New York: Wiley. Brunink JAJ., Di Natale C., Bungaro F., Davide FAM., D’Amico A., Paolesse R., Boschi T., Faccio M., Ferri G. (1996). The application of metalloporphyrins as coating material for QMB based chemical sensor. Anal. Chim. Acta 325, p. 53–60. D’Amico A., Di Natale C., Macagnano A., Davide F., Mantini A., Tarizzo E., Paolesse R., Boschi T. (1998). Technology and tools for mimicking olfaction: status of the Rome Tor Vergata Electronic Nose. Biosens. Bioelectron. 13, p. 711–721. D’Amico A., Di Natale C., Paolesse R., Macagnano A., Mantini A. (2000). Metalloporphyrins as basic material for volatile sensitive sensors. Sens. Act. B. 65, p. 209–215.
165 Di Natale C., Macagnano A., Repole G., Saggio G., D’Amico A., Paolesse R., Boschi T. (1998). The exploitation of metalloporphyrins as chemically interactive material in chemical sensors. Mat. Sci. and Eng. C. 5, p. 209–214. Dolphine D. (ed.) (1978). The Porphyrins, Vol. VI part A and Vol. VII part B. New York: Academic Press. Kawai T. (1996). Fish flavors. Crit. Rev. Food Sci. Nutr. 36, p. 257–298. Paolesse R., Di Natale C., Macagnano A., Sagone F., Scarelli M., Chiaradia P., Troitsky V., Berzina T., D’Amico A. (1999). Langmuir-Blodgett films of a manganese corrole derivative. Langmuir 15, p. 1268–1274.
(8 ref.)