1Faculty of Medicine, University of Brawijaya, Malang, Indonesia. 2Post Graduate
Program in .... Out of the 20 high schools SMP Negeri 5 had the highest ...
The Difference of Food Compositions in Adolescent Metabolic Syndrome in Malang Djanggan Sargowo, MD1, and Sri Andarini, MD1,2 Faculty of Medicine, University of Brawijaya, Malang, Indonesia Post Graduate Program in Biomedicine, Brawijaya University, Malang, Indonesia
1
2
Abstract
Background: Obesity, especially obesity in adolescents, is a worldwide health problem that requires concern because it can continue into adult obesity. About 50% of obese adolescents grow up to be obese adults. It is a concern since it is one of the risk factors associated with cardiovascular events including hypertension, dyslipidemia, insulin resistance and stroke. Visceral obesity correlates with diabetogenic, atherogenic, prothrombotic, pro-inflammation, and abnormal metabolism. The objective of this study was to determine the prevalence of obese adolescents in Malang and to explain the differences in food composition between metabolic and non-metabolic adolescents. Methods: Prevalence of obesity was determined by assessing body mass index (BMI) in 20 Senior and Junior High Schools. Metabolic syndrome was diagnosed using the International Diabetic Federation (IDF) criteria; waist circumference of > 80cm and > 90cm for females and males, respectively, increased triglyceride and decreased HDL concentration levels. The food composition was assessed using food recall. A t test was performed to define the correlation between food intake and the components of metabolic syndrome. Results: The prevalence of adolescent obesity in Malang City reached 3.32%, with the prevalence of obese males higher than that of females, i.e. 54.1% compared to 45.9%. The boys had a higher mean for height and weight than the girls; however, the BMI was actually higher in girls rather than boys. The difference of fat in food composition was significantly higher for the metabolic group (p = 0.031), but carbohydrates were not significantly different between the two groups (p = 0.407). Conclusion: The prevalence of adolescent obesity in Malang City reached 3.32%, with a male prevalence of 54.1% and a female prevalence of 45.9%. From the statistical test, fat intake shows a significant difference between metabolic and non-metabolic groups rather than other food compositions. Keywords: Obesity, Metabolic Syndrome, Adolescent ASEAN HEART J 2012; ; 20 : 35-44 E-Journal : http://www.aseanheartjournal.org
Introduction
Obesity is a new pandemic; it is a preclinical indication of illness associated with life style. Obesity can enhance the development of cardiovascular disease from a metabolic syndrome, thus it is now categorized as a cardiometabolic risk (CMR) factor (1-3). CMR factors include nine components such as the classical components (smoking, high low density lipoprotein - LDL level,
Corresponding author: Djanggan Sargowo, MD Faculty of Medicine, University of Brawijaya, Malang, Indonesia E-mail address:
[email protected]
hypertension, and increased glucose) and the other five risk factors (visceral obesity, low LDL level, insulin resistance, high triglyceride - TG level and inflammation)(4). In Indonesia, the prevalence of CMR can rapidly increase because Indonesians have the Asian genetics but often follow the Western style in eating food. Western people tend to eat food with high energy, sugar and saturated fat, but their physical activity is less since their technology is highly developed. Based on clinical experience in chronological evolution, illness associated with lifestyle can be classified as: level-0 (healthy lifestyle), level-1 (abdominal obesity), level-3 (metabolic syndrome, CMR, pre-diabetes, adolescent pre-diabetes), and level-4 (CMD, type 2 diabetes - T2DM, stroke) (5). ASEAN HEART JOURNAL Vol. 20 No.1 January 2012
36
The Difference of Food Compositions in Adolescent Metabolic Syndrome in Malang
Obesity can be diagnosed by several methods like measuring 1) standard weight, 2) height and weight table, 3) body mass index, 4) waist circumference, 5) waist and hip ratio (WHR), 6) skinfold caliper, or 7) using more advanced technology including computed tomography (CT), magnetic resonance imaging (MRI) and dual energy X-ray absorption. Each method has both advantages and disadvantages. The main problem is in adjusting the standard with the population condition using the same method, e.g. measuring body mass index (BMI) to determine obesity in the American and European population is different from that in Asia, including Indonesia. Metabolic syndrome is not an illness; it is a cluster of metabolic abnormalities such as visceral obesity, increased triglycerides and glucose concentration levels, decreased high density lipoprotein (HDL) and hypertension. This state can develop into cardiovascular disease including stroke by the progression of atherosclerosis (6). There are five recent definitions for metabolic syndrome such as obesity, dyslipidemia caused by increased triglyceride and decreased HDL, insulin resistance or glucose tolerance, and hypertension. The definition of metabolic syndrome was first defined by the World Health Organization (WHO) with the criteria of having insulin resistance and two other criteria (7). The European group then developed the WHO definition by adding the measurement of plasma fasting glucose and established the minimum standard for waist circumference (94 cm and 80 cm for males and females, respectively) (8). The big change in the definition was reported by NCEP ATP III that suggested using three of five criteria to determine metabolic syndrome. The difference between the definition of WHO and the national cholesterol education program adult treatment panel (NCEP ATP) III was on glucose tolerance. Impaired glucose tolerance or insulin resistance became the main component in the WHO definition while the NCEP ATP II only defined plasma fasting blood glucose instead of insulin resistance (9,10). Hence, this study was conducted in order to determine the prevalence of adolescent obesity in Malang City and determine the difference of food compositions between metabolic and non-metabolic adolescents.
ASEAN HEART JOURNAL Vol. 20 No.1 January 2012
Methods
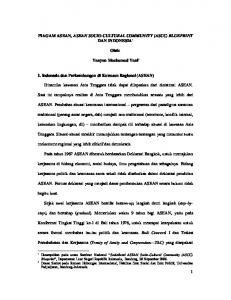
Obesity prevalence was defined by measuring weight and height of students from 20 high schools in Malang City (10 from Junior High and 10 from Senior High Schools) that were randomly chosen. From those students where obesity was detected, an examination was done to determine their metabolic status. A former study found 3 adolescents with metabolic syndrome out of 11 obese adolescents (3). We examined 250 obese students, using the international diabetic association (IDF) criteria, to get 73 metabolic blood samples. For control samples, 77 students were chosen using the criteria of the sample group but adjusted for age, sex and the school (Figure 1). Venous blood was collected from all fasting subjects and then serum was separated from whole blood after centrifugation and immediately kept at -20OC until measurement. Blood pressure measurement using sphygmomanometer and stethoscope. The method used to measure the composition of food consumption is a way to recall 24 hours for 2 days with a span of three days. The data were analyzed using a t test to determine the result from each variable. This research had ethical clearance from The Health Research Ethics Committee of Brawijaya University.
Results
Malang City has 190 Junior and Senior High Schools (BPS, 2007). Out of the 190 schools, 20 were chosen with the details of 10 Junior High Schools and 10 Senior High Schools explained in Table 1. The study resulted in an adolescent prevalence of 3.32% with a ratio of 54.1%: 45.9% for male and female, respectively. Out of the 20 high schools SMP Negeri 5 had the highest prevalence (5.03%) while SMA Negeri 5 had the lowest (1.48%) prevalence (Figure 2). Obese junior high school students came from SMPN 3, 4, 5, 6, 12, and 20 with the number of obese males being higher than females. Obese senior high school students came from SMAN 2, 3, 7, 8, and 9 with the number of obese males being higher than females (Figure 3). From the mean weight, height and BMI, it was suggested that the males had a higher mean height and weight than females; however the mean BMI showed that females were higher than males (Table 2).
37 37
Djanggan Sargowo, MD
Table 1. The distribution of schools, the number of obese students adjusted to sex, examined students and the prevalence of obesity NO 1 2 3 4 5 6 7 8 9 10 11 12 13 14 15 16 17 18 19 20
School’s Name
The number of obesity adjusted to sex
SMP Negeri 1 SMP Negeri 3 SMP Negeri 4 SMP Negeri 5 SMP Negeri 6 SMP Negeri 8 SMP Negeri 10 SMP Negeri 12 SMP Negeri 20 SMP Negeri 21 SMA Negeri 1 SMA Negeri 2 SMA Negeri 3 SMA Negeri 4 SMA Negeri 5 SMA Negeri 6 SMA Negeri 7 SMA Negeri 8 SMA Negeri 9 SMA Negeri 10 Total
M 5 10 11 28 11 8 9 6 5 17 6 15 15 3 7 11 13 15 7 3 205 (54.1%)
F 7 5 7 13 6 10 9 3 11 11 13 12 9 10 8 18 5 12 1 4 174 (45.9%)
Total obese students
Total examined students
Prevalence of Obesity
12 15 18 41 17 18 18 9 16 28 19 27 24 13 15 29 18 27 8 7 379
564 534 509 815 461 579 407 546 592 801 512 674 601 573 483 720 464 655 455 474 11.419
2.13% 2.81% 3.54% 5.03% 3.69% 3.11% 4.42% 1.65% 2.70% 3.50% 3.71% 4.01% 3.99% 2.27% 3.11% 4.03% 3.88% 4.12% 1.76% 1.48% 3.32%
Note: M = male, F= female Table 2. Distribution of weight, height and BMI means based on the obese respondent’s sex Sex Male Female Total mean score
Weight (kg) 79.91 74.48 77.42
Height (cm) 161.77 156.52 159.36
Body mass index 30.38 30.40 30.39
ASEAN HEART JOURNAL Vol. 20 No.1 January 2012
38
The Difference of Food Compositions in Adolescent Metabolic Syndrome in Malang
Table 3. The distribution of metabolic and non-metabolic groups based on sex Sex Male Female Total
Metabolic syndrome 33 (45.20%) 40 (54.80%) 73 (100%)
Non-metabolic syndrome 8 (36.36%) 49 (63.64%) 77 (100%)
Table 4. The differences between metabolic and non-metabolic students based on a t test adjusted to weight, height, BMI, waist circumference, systole and diastole blood pressures, total cholesterol, triglyceride, LDL, HDL, fasting blood glucose, 2h postprandial fasting blood glucose, adiponectin, apoB-100, and carbohydrate, fat and total caloric intake. Variable Weight (kg) Height (cm) BMI (kg/m2) WC (cm) Systole BP (mmHg) Diastole BP (mmHg) Total cholesterol (mg/dl) Triglyceride (mg/dl) LDL (mg/dl) Fasting glucose (mg/dl) 2h Postprandial glucose (mg/dl) HDL (mg/dl) Adiponectin (ng/dl) Apo B-100 (mg/dl) Carbohydrate Fat Total calorie
MS (+) Mean ± SD 81.52 ± 13.87 161.88 ± 8.40 30.92 ± 3.055 93.46 ± 6.22 122.59 ± 9.08 85.27 ± 6.29 198.58 ± 25.01 153.37 ± 19.36 110.25 ± 22.59 84.82 ± 6.45 99.12 ± 7.16 59.10 ± 6.06 78.92 ± 20.83 17.42 ± 15.67 51.41 ± 10.06 35.49 ± 9.28 1552.30 ± 595.64
MS (-) Mean ± SD 51.51 ± 7.54 158.12 ± 7.40 20.65 ± 3.10 69.69 ± 6.14 107.04 ± 7.52 74.02 ± 7.52 145.92 ± 14.21 114.29 ± 13.98 55.47 ± 13.68 83.35 ± 8.35 97.09 ± 7.39 69.91 ± 5.43 117.87 ± 18.13 11.95 ± 5.159 50.18 ± 7.96 32.17 ± 9.46 1401.39 ± 503.42
P