IEEE TRANSACTIONS ON VISUALIZATION AND COMPUTER GRAPHICS, VOL. 12, NO. 5, SEPTEMBER/OCTOBER 2006
ASK-GraphView : A Large Scale Graph Visualization System James Abello, Member, IEEE, Frank van Ham, and Neeraj Krishnan Abstract—We describe ASK-GraphView, a node-link-based graph visualization system that allows clustering and interactive navigation of large graphs, ranging in size up to 16 million edges. The system uses a scalable architecture and a series of increasingly sophisticated clustering algorithms to construct a hierarchy on an arbitrary, weighted undirected input graph. By lowering the interactivity requirements we can scale to substantially bigger graphs. The user is allowed to navigate this hierarchy in a top down manner by interactively expanding individual clusters. ASK-GraphView also provides facilities for filtering and coloring, annotation and cluster labeling. Index Terms— Information Visualization, Graph Visualization, Graph Clustering.
1
INTRODUCTION
Over the past years two of the authors have spent significant time and effort designing, deploying and reviewing visualizations of large graphs. Most current systems are focused on nicely visualizing relatively small graphs [5,14,24] while most of the recent academic techniques in large scale visualization and graph drawing are focused on providing static drawings of relatively large graphs. Often these techniques are only applicable to graphs with specific structural properties. For example, [19] is only truly effective for very sparse or tree-like graphs. Layout techniques such as [18] offer increased scalability but are only really effective on grid-like graphs, such as those resulting from finite element methods. Some of the interaction techniques and systems that have been proposed to navigate graphs (such as [11,12]) use the clustered graph navigation paradigm, which allows the user to navigate a potentially large graph by iteratively expanding or collapsing aggregate (cluster) nodes. However, these proposals assume a hierarchy is given for the input graph, which is rarely the case in practice. Their implementations are also limited in scale, with samples given for graphs of a few hundred nodes. Other techniques, such as [2,3] also use the clustered graph paradigm. They create a hierarchy by using a fast algorithm and then display this hierarchy in an adjacency matrix representation. Because these systems construct a single huge hierarchy for a very large graph, the clustering algorithm used cannot be too sophisticated and often results in suboptimal hierarchies. A second practical problem is that some users find it hard to understand the abstract matrix representations [16] of graphs that are used in these systems. We think that if a desktop node-link graph visualization is to be successfully applied as a practical tool for analysis of large amounts of data it needs to provide at least the following functionality: 1.
A scalable architecture that is able to deal with hierarchical graphs even if they do not fit the RAM of the desktop machine and does not depend on the precise characteristics (such as density or link structure) of the graph (Section 4);
• James Abello is with Ask.com and DIMACS, Rutgers University, E-Mail:
[email protected].
• Frank van Ham is currently with IBM, but this work was performed
while consulting for Ask.com in 2005, E-Mail:
[email protected].
• Neeraj Krishnan is with Ask.com, E-Mail:
[email protected].
Manuscript received 31 March 2006; accepted 1 August 2006; posted online 6 November 2006. For information on obtaining reprints of this article, please send e-mail to:
[email protected].
2.
The ability to automatically cluster large graphs, even if there is no additional hierarchical information available. Note that an often overlooked issue is the fan-out and depth of the hierarchy, which need to be controlled if one wants to navigate a graph interactively (Section 5);
3.
Interactive techniques that allow the user to filter and explore this hierarchy without losing context (Section 6).
We present ASK-GraphView: a system that addresses all of these issues and is currently being used for the analysis of graphs with up to 200,000 nodes. Among the practical use cases of the system are manual inspection and updating of search content, assessment of new clustering approaches and infrastructure maintenance. 2
RELATED WORK
ASK-GraphView combines two major ideas from existing graph visualization systems. For user interaction and navigation it uses a node link layout of a clustered graph, which allows users to arbitrarily expand and collapse clusters to show the subgraph below. This basic idea is described in [12] and a number of experimental implementations based on it have been presented [11,20]. However, all of these implementations assume that the actual cluster hierarchy is either provided in the data or manually supplied by the user. Manually creating a hierarchy for a huge graph with unknown structure is difficult and tedious, and automatically creating a suitable hierarchy for a very large graph in limited time is by no means an easy task either. A second problem with these approaches is that users often tend to lose context when navigating clustered graphs with deeper hierarchies (in our opinion, more than 4 or 5 levels deep). In terms of architecture ASK-GraphView borrows the concepts of memory and disk resident antichains from previous work on large graph navigation [1,2,3] and expands on these by incorporating time constraints. In previous approaches we used matrix oriented views of the antichains, but users often found these views too abstract [16]. Also, these views did not allow inspection of fine graph details and their relationships to the rest of the graph. Our system is probably closest to Tulip [7] which also provides automatic rendering and clustering. The main difference is that Tulip has been set up as a flexible test bed for graph visualizations, allowing (expert) users to compose different layouts and clustering approaches. We instead aimed for a system that can automatically provide a useful visualization of a graph upon loading and is easily accessible to domain experts with no visualization experience. Other related interaction techniques for large graphs include fisheye views
IEEE TRANSACTIONS ON VISUALIZATION AND COMPUTER GRAPHICS, VOL. 12, NO. 5, SEPTEMBER/OCTOBER 2006
4
r
ACIH
ACR
≤ IH edges
Leaves(r) = V
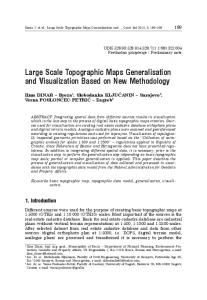
Fig. 1. A hierarchy on an arbitrary input graph G = (V, E). ACR indicates the part of the graph that is processed in RAM. ACIH indicates the part of the hierarchy that is sent to a visualization client for further processing and visualization. For each node in ACIH we ensure that there are no more than IH edges in the subgraph induced by its descendants on ACR below.
of large clustered networks [15,16]. These create an abstraction of the graph based on the positions of one or more foci such that nodes nearer to the focus are displayed in greater detail. The major practical disadvantage of these types of views is that it is very hard to relate two visualizations of the same graph with different foci, even when providing visual cues such as animation or coloring. 3
PRELIMINARY DEFINITIONS
We consider weighted undirected graphs G = (V, E, w) where V and E denote the set of vertices and edges respectively. w is a function that assigns to each edge in E a non-negative real weight. |V| and |E| denote the cardinalities of V and E. A subgraph of G is said to be induced by a subset U of V, if it consists of the nodes in U and those edges in E that have both endpoints in U. We denote an induced subgraph by G(U). A hierarchy tree TG for a graph G is a tree rooted at r whose set of leaves is in one to one correspondence with V. That is, leaves(r) = V, if we denote the set of descendant leaves of a node u in the tree by leaves(u). The set of children of a node u is denoted by children(u). Similarly, the unique parent of u is denoted by parent(u). A (maximal) antichain A in TG is a (maximal) set of nodes in TG such that no two distinct nodes in A are ancestors of one another. An antichain A1 is said to be above another antichain A2 if each node in A1 is an ancestor (not necessary proper) of a node in A2. A maximal antichain A formalizes the notion of abstract views, slices [15] or abridgements [12] and it defines a partitioning of the nodes of G. On this partitioning we can define a macro edge set E’={eab : a ∈ A ∧ b ∈ A : (exy∈ E: x∈ leaves(a) ∧ y∈ leaves(b))} with weights w(eab) =∑w(exy): exy∈ E: x∈ leaves(a) ∧ y∈ leaves(b). The weighted graph (A, E’) is a macro view of G. To make the defining antichain A explicit we refer to it as an A-view of G (see also [1,3]). In other words, the A-view of a graph is a macro graph consisting of the nodes in A and the macro edges connecting them. In the rest of this paper we assume that the visualization client has random access to every macro edge of a view, that is, we have a data structure available that stores both a hierarchy TG and the entire macro edge set on that hierarchy in RAM.
ARCHITECTURE
ASK-GraphView can be viewed as a client server system that builds a data structure (i.e. a hierarchy tree) that treats the available screen (S), random access memory (R) and disk as three buffers of increasing size and with different access characteristics. Although we have previously considered only size constraints [1,2,3], we cannot offer interactive navigation if we do not also consider the temporal dimension. That is, we have to ensure that we are able to process any data that is transferred from disk to RAM (clustering) and from RAM to screen (layout) in reasonable time. To address the first issue, we construct a stack of progressively finer disk resident macro views of our graph, such that the increase in number of edges in successive macroviews is limited (see also Fig. 1). We deal with the second issue by customizing a structural clustering algorithm such that we can guarantee that the fan out of the hierarchy generated by that algorithm is bounded. The rest of this section discusses the system’s time/space parameterized data structure and the direct relation between macroviews and antichains in hierarchy trees. In Section 6.2 we present a notion of graph context that allows the user to explore the graph without exceeding S. 4.1 Constrained Resources In interactive graph navigation our two main bottlenecks are space and time. Space refers both to the maximum size of the graph R which we can still store in RAM and the maximum size S of the graph that we can interactively show on screen (see also [1,2,3]). However, if we want to offer interactive navigation of large graphs we also need to consider the time dimension. The two main bottlenecks here are the time needed for computation of a clustering and the time needed for computation of a layout. IL (Interactive Layout) and IH (Interactive Hierarchy) are interactivity parameters that encode sizes of (sub)graphs for which a drawing and a hierarchical clustering can be computed in desired response times tL and tH (in our case a few seconds). We express IL in terms of the number of nodes and IH in the number of edges in the (sub)graph. Suitable values for IL and IH are obtained experimentally and clearly depend on the sophistication of the desired layout or hierarchy tree computation and the level of required interactivity for both. Given the current state of algorithmic knowledge and typical hardware configurations, it is reasonable to assume that IL < S ≤ IH < R. The parameter IL effectively controls the maximum fan out of nodes in the hierarchy we are using to interactively navigate the graph. A hierarchy that has a maximum fan out of 10,000 is clearly not suitable to use for the interactive navigation of a graph, since it would take us too long to compute a satisfactory layout for a subgraph this big. Apart from this time constraint, IL is also limited by the user’s ability to visually ‘digest’ the new subgraph presented. We determined empirically that IL = 64 provides a reasonable tradeoff between scale and readability. Similarly, IH represents the maximum amount of edges for which we can compute a hierarchy in a few seconds, regardless of the density of the graph. Using the procedures described in Section 5, we are able to hierarchically cluster around 100,000 edges at an interactive rate. Both of these navigation parameters are used to tune system performance in order to offer truly interactive graph navigation. In the following sections we assume that 2 < IL2 < IH and d*IL < S where d is a small non zero integer. Trying to navigate dense graphs with node link diagrams is not really useful and other representations (such as adjacency matrices) might be more suited here. However, theoretically our infrastructure is also able to deal with denser graphs by replacing the clustering and hierarchy tree computation procedures by a simpler version that groups nodes together such that the fan out in the hierarchy tree is at most √IH. A more efficient alternative on weighted input graphs is pruning the graph by weight such that at most |V|√|V| edges remain.
J. ABELLO ET AL.: ASK-GRAPHVIEW : A LARGE SCALE GRAPH VISUALIZATION SYSTEM
The main idea behind the architecture is that by reusing the parameter IH when navigating a macro view of a graph with IH edges, we can expand any node in that macroview to a new subgraph, again with at most IH edges (Fig. 1). Given that the maximum density is |V|√|V|, a subgraph of IH edges consists of at least IH2/3 nodes. For each of these nodes we can then nest a new subgraph of IH2/3 nodes, resulting in a total of IH4/3 nodes below, having at most IH2 edges (given density |V|√|V|). In practice however we cannot possibly create a hierarchy tree for a graph this big because our RAM size R can fit only a limited number of edges, so usually R < IH2. If we use 32 bytes per edge, a server with 2GB of RAM available for edge storage will allow us to store in the order of 16 million edges. This means that undirected graphs with up to 16 million edges are navigable with our software infrastructure (depending on available RAM) and this in turn offers a solution to the interactive navigation of graphs with up to 4,000 vertices with no qualifications. This number might seem disappointing since these graphs are not really that large. However, the real gains of our approach become noticeable by considering graph density, i.e. if |E| < |V|√|V|, |V| lies between 64,000 and 300,000 vertexes. Similarly, if |E| < |V|log(|V|), |V| lies between 300,000 and 16,000,000 vertices. To our knowledge these results represent a substantial improvement over previous work dealing with the navigation of graphs represented by node-link diagrams, without posing qualifications on the actual structure of the graph. In summary, the lower the density of the input graph the larger graph scalability we obtain and improvements in clustering algorithms (i.e. higher IH) will automatically make navigation of larger graphs possible subject to RAM availability. 4.2 Data Structure The fundamental data structure at the server level is a hierarchy tree TG that is parameterized by IH and R. The central idea is to find an antichain ACR whose associated ACR-view can be processed on the available RAM of size R and an antichain ACIH above ACR that can be processed in an interactive fashion. The antichain ACIH is then processed on the client side to create a hierarchy. Should the user require parts of the hierarchy that are below ACIH, the client sends a request to the server for more data which is subsequently processed in a similar manner. We assume throughout that IL < S