Resource
Assembly, Annotation, and Integration of UNIGENE Clusters into the Human Genome Draft Degen Zhuo,1,2,5 Wei D. Zhao,1,2,5 Fred A. Wright,2,5 Hee-Yung Yang,4 Jian-Ping Wang,1,2 Russell Sears,1,2 Troy Baer,3 Do-Hun Kwon,1,2 David Gordon,1,2 Solomon Gibbs,1,2 Dean Dai,4 Qing Yang,1,2 Joe Spitzner,4 Ralf Krahe,2 Don Stredney,3 Al Stutz,3 and Bo Yuan1,2,6 1
Bioinformatics Group, 2Division of Human Cancer Genetics, James Cancer Hospital and Solove Research Institute, The Ohio State University, Columbus, Ohio 43210, USA; 3Ohio Supercomputer Center (OSC), Columbus, Ohio 43212, USA; 4 Labbook.Com, Columbus, Ohio 43229, USA
The recent release of the first draft of the human genome provides an unprecedented opportunity to integrate human genes and their functions in a complete positional context. However, at least three significant technical hurdles remain: first, to assemble a complete and nonredundant human transcript index; second, to accurately place the individual transcript indices on the human genome; and third, to functionally annotate all human genes. Here, we report the extension of the UNIGENE database through the assembly of its sequence clusters into nonredundant sequence contigs. Each resulting consensus was aligned to the human genome draft. A unique location for each transcript within the human genome was determined by the integration of the restriction fingerprint, assembled genomic contig, and radiation hybrid (RH) maps. A total of 59,500 UNIGENE clusters were mapped on the basis of at least three independent criteria as compared with the 30,000 human genes/ESTs currently mapped in Genemap’99. Finally, the extension of the human transcript consensus in this study enabled a greater number of putative functional assignments than the 11,000 annotated entries in UNIGENE. This study reports a draft physical map with annotations for a majority of the human transcripts, called the Human Index of Nonredundant Transcripts (HINT). Such information can be immediately applied to the discovery of new genes and the identification of candidate genes for positional cloning. There are at least three principal products of the Human Genome Project: the sequence itself, the genes, and the map integrating the genes and the sequence. This has been partially accomplished by the release of the human genome draft, which represents 85%–90% of the entire human genome (http://www.ncbi.nlm. nih.gov/genome/seq/HsHome.shtml). The Ensembl consortium has annotated the draft with known transcripts, protein sequences, and hypothetical genes (http://www.ensembl.org). However, most of the transcripts used in the Ensembl database were individual ESTs, which were single pass, potentially highly redundant, and partial cDNA fragments derived from either the 5⬘- or 3⬘ -untranslated regions of human genes (Boguski et al. 1994; Adams et al. 1995; Schuler et al. 1996). We proposed that assembly of individual ESTs into a consensus sequence could provide the basis for 5
These authors contributed equally to this work. Corresponding author. E-MAIL
[email protected]; FAX (614) 688-4761. Article published on-line before print; Genome Res., 10.1101/gr.164501. Article and publication are at www.genome.org/cgi/doi/10.1101/ gr.164501. 6
904
Genome Research www.genome.org
discovery of additional relationships with the genomic sequence, orthologous genes, and/or conserved functional domains. Several groups have compiled sets of human transcripts, generating gene-oriented clusters, indices, or consensus sequences (Boguski and Schuler 1995; Miller et al. 1999; Ewing and Green 2000; Quackenbush et al. 2000). We chose UNIGENE as a starting point to annotate the human genome, because, in contrast to other gene indices, it provides links to the IMAGE, Genemap’99, Locuslink, SAGE, and protein databases, as well as cytogenetic and other mapping information (Boguski and Schuler 1995). The current version of UNIGENE has ∼ 87,000 nonredundant sequence clusters assembled from >2.1 million individual ESTs and other cDNA sequences (http://www.ncbi.nlm.nih/ UniGene/). However, the resulting UNIGENE database is still composed of individual transcripts, each the longest in its progenitor cluster. We thus set out to assemble the UNIGENE database to extend the human transcript consensus. Transcript mapping is used to facilitate gene discovery. Because >370,000 ESTs and other mRNA se-
11:904–918 ©2001 by Cold Spring Harbor Laboratory Press ISSN 1088-9051/01 $5.00; www.genome.org
Human Draft Transcript Map
quences had already been mapped by the international radiation hybrid (RH) consortium (Deloukas et al. 1998), we initially sought to integrate UNIGENE and Genemap’99 to map all the consensus transcripts. However, only ∼ 19,750 UNIGENE clusters were found to contain at least one STS or EST that could be localized on either the GB4 or G3 map—significantly fewer than the 30,000 distinct genes described in Genemap’99 (Deloukas et al. 1998). Thus we were motivated to use the draft of the human genome to map all human genes with sufficient transcript representation. Because >95% of the finished and nonfinished clones sequenced by the Human Genome Project have been physically mapped, and the human genome draft represents >85%–90% of the nonredundant human genomic sequences, global sequence alignments between the consensus transcripts and the working draft were possible. The overall goal of our gene-indexing project is to use the genome draft to develop a transcript map that integrates both positional and functional information for most human genes. We report a computational approach for producing high-quality transcript assemblies. To ensure the integrity of the assembly process, we assessed the Smith–Waterman scores for each individual transcript contributing to the consensus. Unalignable variants and other chimeric contaminants were first identified and removed. When more than one contig was generated from each cluster, consensus sequences were matched to exclude any internal associations. Problematic contigs were reassembled by use of more stringent conditions. Our resulting database, the Human Index of Nonredundant Transcript (HINT), contains a total of 97,687 consensus transcripts, including 61,066 contigs and 36,621 singlets assembled from 87,000 UNIGENE clusters. In addition, 8100 potential splicing variants were identified during the sequence assembly, of which only 5% had been reported previously in the literature. Interestingly, many of the potential variants had unique tissue library profiles in their progenitor clusters, implicating alternative splicing as possibly a highly regulated event. We demonstrate the use of the human genome draft to map all human transcripts. We emphasize the importance of quality control and map integration to resolve ambiguous placements for both the genomic clones and consensus transcripts. Nonoverlapping, high-scoring segment pairs (HSPs) from the same transcripts spliced on the same genomic contig were retained. Remaining overlapping alignments were resolved by scoring both the length and identity of all of the transcripts involved, resulting in the assignment of a unique location for a given cDNA fragment on the human genome. Finished and unfinished genomic clones, along with their aligned transcripts, were physically ordered by integration of the restriction fin-
gerprint map for the genomic clones (Marra et al. 1997), the genomic contigs assembled by Haussler and colleagues (http://genome.cse.ucsc.edu/goldenPath), Genemap’99 (Deloukas et al. 1998), and the e-PCR map developed in this study. The final transcript map was substantiated by comparison of the clone, contig, genetic, and cytogenetic mapping information, and evaluating supporting and conflicting evidence. Together, a total of 59,500 UNIGENE clusters have been mapped, providing an early glimpse of a complete transcript map for the human genome.
RESULTS AND DISCUSSION Assembly of UNIGENE Clusters First, we assembled the UNIGENE clusters. Rather than creating a new gene index, the goal of our assembly was to extend the human transcript consensus to facilitate gene annotation and mapping. Assembly was carried out strictly within each UNIGENE cluster. Chimeric sequences were first identified and removed (see the section concerning splicing variants). A total of 46,202 UNIGENE clusters were each assembled into single contigs (53%), with an additional 7570 UNIGENE clusters resulting in more than one contig (9%). A total of 6240 ESTs were not assembled along with other contigs in the same clusters. Because they represented unique and nonconflicting sequences, these singlets were incorporated into the consensus of their progenitor clusters. A total of 2200 UNIGENE clusters had to be assembled under more stringent conditions (2.5%), during which an additional 3800 chimeric ESTs were identified and discarded as conflicting singlets. A total of 770 UNIGENE clusters, most of which contained either many ESTs and/or very long transcripts, could not be assembled on the basis of our criteria (0.7%). In this case, the longest transcript was used to represent the consensus. The remaining 30,381 UNIGENE singletons (35%) were not assembled. Second, we compared each resulting consensus to its contributing transcripts. The accuracy of sequence assembly can be significantly improved by use of the quality scores derived from the original sequencing traces (Ewing and Green 1998; Ewing et al. 1998). As original chromatograms were not used in our assembly, we applied position-dependent quality scores based on a published assessment of six public sequencing projects (Richterich 1998). In this analysis, it was shown that the first 30 bp had high error rates, in the range of 5%–10%. Toward the end of sequence reads, the error rates generally exceeded 10% between bases 300–700, depending on the template, sequencing chemistries, sequencing machines, or gel length used in each of the six projects (Richterich 1998). We thus applied a conservative approach, by assigning higher
Genome Research www.genome.org
905
Zhuo et al.
quality scores only to the 31–300 base positions for ESTs that were longer than 500 bp. A nearly perfect quality score was given to all bases of known genes (Methods). Many of the UNIGENE clusters (15%) contained at least one known gene. The overall Smith–Waterman scores for the known genes in their corresponding contigs were 1.8% for mismatch, 0.7% for insertion, and 0.5% for deletion, indicating that the resulting consensus was reasonably accurate at the sequence level. Similar overall Smith–Waterman scores were obtained for the remaining transcripts associated with the known genes (mismatch 1.5%, insertion 0.9%, and deletion 0.8%). This accuracy might be partially attributed to the high Phred quality score given to the known genes, which would reduce the contribution from ESTs of potentially poorer qualities. Alternatively, the redundancy of current EST information was high enough that discrepancies due to random sequencing errors had been largely compensated. This appeared to be true as the overall Smith–Waterman scores for rest of the contigs were in the same range (mismatch 1.9%, insertion 1.7%, and deletion 0.9%). Interestingly, no substantial discrepancies in Smith–Waterman scores were observed for the ESTs of different lengths. We believe that the observed accuracy for the resulting contigs could also be attributed to the stringent threshold we set during the assembly process, that any transcripts presenting higher than the accumulative >5% error rate would be discarded as singlets. We speculate that some of the sequence mismatches are due to single-nucleotide polymorphisms (SNPs) in human ESTs (Buetow et al. 1999; Irizarry et al. 2000).
Extension of UNIGENE Consensus Sequences Third, we assessed the benefits of our assembly by comparing each UNIGENE index to its corresponding HINT consensus (Table 1 and Fig. 1). We did not include any of the chimeric ESTs to assure that only unique consensus sequences were compared. We divided the UNIGENE data set into anonymous ESTs and known gene categories using the UNIGENE descriptions (see Methods). Surprisingly, almost 65% (7234) of the 11,191 known genes could be extended further by the assembly process, by an average of 20% (Table 1). In contrast, 30% (22,796) of the 75,925 anonymous EST clusters were extended, and the resulting HINT clusters were an average of 50% longer than their UNIGENE counterparts. This result was somewhat expected, as known genes may have been more easily characterized due to high expression (as evidenced by their greater number of transcripts per cluster, resulting in a greater chance of assembly extension). However, the fulllength mRNA forms an upper limit to proper extension. The majority (72.5%) of the known gene UNIGENE clusters were >1000 bp, while almost all (98.5%) of the
906
Genome Research www.genome.org
Table 1. Benefit Assessment of the Assembly by Comparing the Original UNIGENE Transcripts to Their Corresponding Consensus
UNIGENE clusters Singletons UNIGENE clusters extended Average number of transcripts Average length of UNIGENE (bp) Average length of HINT (bp) UNIGENE clusters unchanged (Non-singletons) Average number of transcripts Average length of UNIGENE (bp)
Known genes
Anonymous ESTs
11191 692 7237 97 2280 2749
75,925 29,689 22,795 18 560 843
3262 86 2833
23,441 4 506
UNIGENE clusters containing known genes or only anonymous ESTs were divided (see Methods). The sizes and lengths for each UNIGENE cluster were based on the original UNIGENE dataset. bp, Base pair.
anonymous EST clusters were 95% crepancies were observed for the clusters or individual of the misplaced ESTs (2601/2695). genes. Thus the cause for the apparent transcript inWe reasoned that sequencing errors, mapping erversion remains to be determined. rors, and other artifacts would otherwise result in such
Genome Research www.genome.org
907
Zhuo et al.
As a third assessment of HINT integrity, we used mapped to the genome as exons, although the computhe human genome draft to integrate and compare our tational evidence awaited further biological confirmaconsensus to Ewing and Green’s (EG) EST assemblies tion. A total of 5363 HINT transcripts had at least one using high-quality traces (Ewing and Green 2000). We exon in complete overlap (allowing up to a 2-bp difattempted to address the following questions: (1) Beference) with an EG exon, while 5675 EG consensus cause the HINT consensus was built without the use of sequences had an exon in common with HINT. Again, original chromatograms, what impact would this have the two values differed because the indices did not on the fidelity of the resulting consensus? (2) How match one to one. The genomic sequence identity of many exonic sequences were in common between the HINT versus EG overlapping exons was about 3% lower two indices, and how much unique transcribed inforthan EG versus HINT overlapping exons (Table 2). mation was contributed from each? The availability of Similar comparisons were given for consensus tranthe draft genome enables a direct comparison of transcripts containing exons that were longer (extended) in script indices. Using BLAST, assembled transcripts from HINT versus EG, truncated in HINT versus EG, and HINT and the EG indices were assigned to the genomic transcripts that overhang, that is, contain overlap that sequences. UNIGENE singletons were not used for represented only a portion of both the HINT and EG these comparisons, as the EG indices were built from exon. multiple ESTs only. The comparisons revealed Table 2. The Integration of HINT Consensus and Ewing and Green’s Assemblies HINT (BLAST score 472, seinto the Human Genome Draft quence identity 93.77%) was about 3% lower in average qualComparison of Mapped Transcripts ity score than the EG assemblies Ewing and (490, 95.43%). This appeared HINT Green (EG) consistent with the overall Smith–Waterman error rates for Transcripts mapped 43,484 29,582 HSP length (kb) 34,226 12,723 HINT (∼ 5%) and the threshold Average BLAST score to genome 472 490 we set (5%) during the assemOverall sequence identity with genome 93.77% 95.43% bly process. The average BLAST Unique transcripts 28,026 11,002 HSP length (kb) 24,568 3,452 scores occupied a limited range Average BLAST score to genome 471 490 (471–475) for UNIGENE clusOverall sequence identity with genome 93.53% 95.18% ters of different sizes, lengths, Comparison of Exons in Transcripts or known genes versus anonymous ESTs. Similarly, sequence HINT vs. EG EG vs. HINT identity for all of these groups Transcripts with an exact exon overlap 5,363 5,675 was near 93%. HSP length (kb) 1,731 1,731 The overlap between the Average BLAST score to genome 475 490 two indices was substantial but Overall sequence identity with genome 93.86% 95.25% not complete (e.g., 62% of the Transcripts with an exon extended 7,580 4,759 HSP length (kb) 4,682 2,129 EG indices appear in HINT). Average BLAST score to genome 472 490 The unique transcripts column Overall sequence identity with genome 93.88% 95.69% in Table 2 enumerates tranTranscripts with an exon truncated 5,142 2,012 scripts that appeared in one inHSP length (kb) 1,724 2,989 Average BLAST score to genome 471 490 dex and not the other. Note Overall sequence identity with genome 93.62% 96.02% that the grouping of ESTs into Transcripts with an exon overhanging 229 850 clusters differed somewhat for HSP length (kb) 253 656 Average BLAST score to genome 463 483 the two indices, so that comOverall sequence identity with genome 91.41% 93.32% parisons of HINT clusters to those of EG were not always (HSP) High-scoring segment pair, representing exons. Average BLAST score was obtained one to one. Because the two inby dividing the total BLAST score by the total length of the HSPs involved, represented as per 100 base pair HSP. Overall sequence identity was similarly averaged by the total dices represented two different length of HSP involved. transcript populations, the (Overlap) HSPs overlap by Ⳳ 2 base pairs on either side between the HSPs of HINT and EG. comparison was narrowed fur(Extended) HSPs from one index were longer than the other one. ther to the overlapping HSPs (Truncated) HSPs from one index were shorter than the other one. In both cases, the positions of two HSPs agreed on either 5⬘ or 3⬘ side of their HSPs within Ⳳ 2 base pairs. within each transcript. For sim(Overhanging) both the 5⬘ and 3⬘ positions of the two HSPs disagreed (> Ⳳ 2 base pairs). plicity, we referred to the (kb) Kilobase pairs. (spliced) segments (HSPs)
908
Genome Research www.genome.org
Human Draft Transcript Map
A majority of the extended and truncated HSPs (>75%) represented either the 3⬘ or 5⬘ end of a gene index, strongly indicating that the difference was largely due to the length of the consensus rather than misassembly. Though it was expected that longer consensus would be generated from the UNIGENE database consisting of a significantly larger population of ESTs, still a significant number of EG consensus was extended further for the corresponding transcripts. We attributed the remaining internal variations (25%) largely to alternative splicing. After the HSPs contributed from the splicing variants in the HINT database were removed (see the section concerning splicing variants), the internal difference dropped to about 15%. To determine whether the remaining internal discrepancies could represent misassembled consensus, we compared EG consensus to known GenBank sequences as well as to TIGR’s HGI. We observed a similar degree of internal variations among all of the gene indices tested, strongly suggesting that alternative splicing might occur as a rather frequent event (B. Yuan, unpubl.). Finally, a minor amount of imperfect (overhanging) overlaps was observed, implicating misassembly, misplacement, or genes on two different strands (Table 2). To distinguish these possibilities, we checked the orientations and evidence of splicing. Interestingly, most of them (∼ 80%) represented HSPs on two different strands with evidence of splicing, suggesting overlapping genes. Though the gene-overlapping issue remains largely unresolved, it appeared that such a phenomenon might occur more frequently in the human genome than previously thought (Burke et al. 1998). An additional 15% appeared to be caused by confusion during the resolution of the BLAST placements (see Methods), suggested by the lack of evidence for splicing and the overall drop of sequence identity (∼ 2%). Similar observations were also made when comparing Ewing and Green’s with other gene indices (B. Yuan, unpubl.). Even so, we still could not rule out completely the possibility of misassembly for at least some of the imperfect or truncated overlaps. The integration of transcript consensus into the human genome draft also allowed us to find overlapping HINT consensus (∼ 5450 HSPs), suggesting agglomerate clusters. A similar phenomenon was also observed (∼ 1570) within Ewing and Green’s index (see Supplementary Tables 4 and 5 at http://pandora.med. ohio-state.edu/HINT;). We were not able to determine whether they were distinct genes, which were either contained in and/or overlapped other genes, or components of the same genes. This issue was complicated further due to the lack of original orientation information for at least some of the consensus. We speculated a majority of them represented fragmented indices, as many of the sandwiched indices were singletons or consensus sequences derived from small clusters (see
Supplementary Tables 4 and 5 at http://pandora.med. ohio-state.edu/HINT). We were surprised by the lack of common consensus between HINT and EG indices (Table 2). Here, it was clearly indicated that the two data sets represented two very different populations of human transcript information, with only ∼ 30% of the UNIGENE index being represented in Ewing and Green’s assemblies. Even though UNIGENE was thought to consist of a majority of human transcript information, still ∼ 15% of Ewing and Green’s assemblies were not represented. Similar observations were made between our HINT and TIGR’s HGI (B. Yuan, unpubl.). This raises the issue that all existing human transcripts including known genes are required to create a complete and nonredundant gene index for the human genome. An estimate of 35,000 human genes was obtained on the basis of Ewing and Green’s assembly (Ewing and Green 2000). At least one major difference between this approach and UNIGENE (Boguski and Schuler 1995) or TIGR’s HGI (Liang et al. 2000) has been that consensus sequences from single unconfirmed ESTs were not included. To address whether singletons represented real genes, we integrated the ∼ 30,000 UNIGENE singletons into the human genome draft, resulting in 16,305 unique placements (see Methods). A total of 3340 singletons had evidence of splicing (see Supplementary Table 6 at http://pandora.med.ohiostate.edu/HINT). Given that 85% of the UNIGENE consensus was placed in the human genome (see the section concerning transcript mapping), still only a small portion of the singletons (15%) could be real genes. Thus, the issue whether or not singletons represent human genes or genomic contaminants and other artifacts remains largely unresolved. Thus, gene counts cannot be based directly on transcript clustering and assembly. Lack of overlapping evidence among individual consensus sequence could significantly inflate the current estimates. This can be particularly true as human transcript information was largely derived from the 3⬘ or 5⬘ termini of human genes. Second, genomic contaminants, artificial or inaccurate ESTs could have inevitably been included in the UNIGENE data sets, which would contribute a significant number of additional singletons as genes. Third, new genes and their representations remain to be discovered, which can be particularly true for genes that are either very low in abundance or expressed only in specific tissues or limited times. Wheelan and Boguski proposed algorithms to identify and annotate all human genes (Wheelan and Boguski 1998). We believed that the integration of all human transcribed information into the genome, together with predicted exons, protein homology, and new algorithms could significantly facilitate the identification and annotation of at least a majority of human transcriptional units.
Genome Research www.genome.org
909
Zhuo et al.
Identification of Splicing Variants in the UNIGENE Database Splicing variants and other chimeric contaminants had to be first identified and removed from each cluster before sequence assembly. In fact, chimerism was indicated as one of the main reasons why no attempt had been made at NCBI to assemble the UNIGENE clusters (http://www.ncbi.nlm.nig.gov/UniGene). For our efforts, only the transcripts with an internal deletion or internal nonoverlapping alignment compared with their consensus were considered as potential splicing variants. A total of 8100 such candidates were identified, consisting of 6500 deletional plus about 1600 insertional variants (see Supplementary Tables 7 and 8 at http://pandora.med.ohio-state.edu/HINT). An additional 14,500 chimeric sequences were identified and discarded on the basis of the fact that the nonoverlapping alignments were only found at their 5⬘ or 3⬘ termini compared with their corresponding consensus. We speculated that these ESTs could largely represent partially processed RNAs or genomic contaminants. The 8100 potential variants were derived from a total of 6713 individual UNIGENE clusters, of which only 287 had more than one variant. This observation indicated that a majority of the alternative splicing events (6426, 80%) was each supported by only one transcript. Our preliminary validations revealed no significant differences in the size distributions for the variants (∼ 505 bp) compared with the rest of the ESTs (∼ 525 bp). Because we placed strict conditions on the formation of the consensus and included the deletion variations that were only internal to a transcript, the possibility of intron contamination was ruled out in the vast majority of the variants we considered. We later also ruled out the possibility of artifacts (genomic contamination or incomplete RNA processing) for a majority of the insertional variants by identifying their alternatively spliced exons in the human genome draft (see Supplementary Table 9 at http://pandora.med. ohio-state.edu/HINT). Because many of the ESTs in the UNIGENE database are single-pass reads of low sequence quality, gross sequence variations found near the 5⬘ or 3⬘ ends of the ESTs were ignored and trimmed before the subsequent round of assembly. Some transcript variations could also be attributed to the hypervariable microsatellites contained in exons. A recent study suggested that such sequence variations could exist in as many as 20% of all human genes (Wren et al. 2000). By use of the program RepeatMasker on the sequences identified as deleted or inserted in this study, no significant simple repetitive sequences were observed. Because splicing variations often resulted in gain or loss of a function, we compared the patterns of protein motifs on the variants to their counterparts. Interestingly, unique exons contributed from 75% of the
910
Genome Research www.genome.org
1300 insertional variants tested contained at least one conserved protein motif, detected by use of the program HMMER and the Pfam database (Bateman et al. 2000). The top three frequently found motifs were kinase (62), tyrosine phosphatase (18), and SH2/SH3 (15) domains, all involved in signal transduction (see Supplementary Table 10 at http://pandora.med.ohiostate.edu/HINT). More extensive molecular analysis on all potential splicing variants is underway. To determine whether any of the variants were tissue, pathology, or development specific, we standardized the vocabularies used to describe each individual cDNA library. Terms were then divided into organ, tissue, cell, pathology, developmental, or experimentally treated categories (see Supplementary Table 11 at http://pandora.med.ohio-state.edu/HINT). The cDNA source for each variant was compared with the profile of all cDNA libraries of its progenitor cluster (see Supplementary Table 12 at http://pandora.med.ohiostate.edu/HINT). By doing so, 40% of the variants were found to be tissue, development, or neoplastic specific, implicating alternative splicing as a potentially highly regulated event. However, because the relative expression level of individual genes and the cDNA libraries used in the EST sequencing project can both affect the relative abundance of a particular tissue source represented in a given UNIGENE cluster, cDNA library profiles could only be used as presumptive evidence when inferring gene expression profiles. This was particularly true in cases where early cDNA cloning efforts were more successful with highly expressed genes. To estimate how many of the splicing variants were potentially novel, splicing-related annotations such as alternative splicing were identified in the SWISSPROT, PIR, and TrEMBL protein databases, as well as GenBank; only ∼ 5% of the variants had previously been identified. However, this estimation was based mainly on the information already annotated in the available sequence databases rather than the entire public literature database. A number of genomewide searches for splicing variants have been similarly conducted by others as well (Burke et al. 1998; Mironov et al. 1999). In the end, the HINT consensus was composed of 61,066 contigs, 36,621 singletons, and 8100 splicing variants, representing the original 87,000 UNIGENE indices.
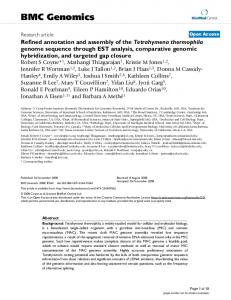
Functional Annotation of the HINT Database Functional annotation was simplified by the use of consensus to represent each gene. To assess the benefits of using our extended consensus on sequence annotation, the original UNIGENE indices and their corresponding consensus sequences were compared for their alignments to protein databases (Fig. 2). More than 13,000 UNIGENE clusters, most of which were
Human Draft Transcript Map
exonic sequences could significantly facilitate the current gene-oriented annotation efforts.
The Draft for Human Transcript Map Our transcript mapping effort faced three major problems: sequence fragmentation and redundancy in the current human genome draft, and paralogous/homologous sequences in the assembled gene index. Genomic sequence fragmentation results in ambiguities for the placement and assembly of genomic sequences. Genomic sequence redundancy results in multiple alignments for the same transcript onto different clones of the human genome. Paralogous and homologous genes, including pseudogenes, result in multiple alignFigure 2 The assembly of human transcripts enabled a greater number of UNI- ments of presumably different transcripts GENE entries with a protein homology. The UNIGENE and HINT consensus se- to the same genomic region. quences were aligned to the SWISSPROT, TrEMBL, and PIR protein databases by We used the program BLAST to inteuse of the program BLASTX. Protein alignments with the highest scores were grate HINT indices into the human genome selected from each UNIGENE and HINT transcript consensus and broken into five groups according to their BLAST scores, ranging from the highest >500 to 100– draft. Multiple alignments were frequently 200 (x-axis). (y-axis) Numbers of transcript consensus. (Open bars) UNIGENE tran- found between one transcript and several scripts; (closed bars) HINT consensus. genomic clones, presumably resulting from the splicing of the transcript, or the sequence redundancy in the genome draft. previously labeled as ESTs, had at least one new putaAlternatively, multiple alignments could be caused by tive annotation based on their homology to known the sequence homology of paralogous and homoloprotein sequences (see Supplementary Table 13 at gous genes or pseudogenes. Thus, the determination of http://pandora.med.ohio-state.edu/HINT). A greater exact associations among genomic clones at the senumber of highly significant hits (BLAST score >400) quence level was essential to resolving these three poswas obtained as the result of the extension (∼ 1,500). sibilities. However, a substantial amount of new protein-related We integrated the BLAST results into the genomic information was obtained with marginal BLAST scores contigs assembled on the basis of the restriction fin(