systematic layout planning and lean manufacturing will achieve potential savings
and improvements. These selected techniques have been directed at ...
ASSEMBLY LINE LAYOUT AND PROCESS OPTIMIZATION AT POWERTECH TRANSFORMERS by
MELANI REYNEKE 27184511 Submitted in the partial fulfillment of the requirements for the degree of BACHELORS OF INDUSTRIAL ENGINEERING in the FACULTY OF ENGINEERING, BUILT ENVIRONMENT AND INFORMATION TECHNOLOGY
UNIVERSITY OF PRETORIA
2010
i|Page
Executive Summary Powertech Transformers, located in Pretoria West, is one of the largest and sophisticated transformer manufacturing plants in the southern hemisphere. The variety of products manufactured is used by local authorities, mines, industrial plants, and the utility industry. The manufacturing plant has experienced problems with the productivity and efficiency of their active assembly area. This project was aimed at optimizing the active assembly line layout and at improving the current process. The selection and implementation of the relevant industrial engineering tools and problem solving techniques helped to achieve this goal. This document describes the situation at Powertech Transformers and how the implementation of systematic layout planning and lean manufacturing will achieve potential savings and improvements. These selected techniques have been directed at improving specifically the material flow and tool usage to ultimately optimize the efficiency and production effectiveness throughout the overall layout area. The future state of Powertech Transformers has a more efficient flow of materials and operations and will ultimately improve the productivity of the area. The improvements will enable the operators and management to have more control over the process and to focus their attention on the quality of the operations and the products. It is expected that with more focus on quality that less products will be faulty, saving time and money.
ii | P a g e
Table of Contents 1. Background and Introduction ................................................................................................................. 1 1.1. Company Profile ........................................................................................................................... 1 1.2. Project Introduction ..................................................................................................................... 2 2. Problem Statement................................................................................................................................. 3 3. Project Aim.............................................................................................................................................. 3 4. Project Scope .......................................................................................................................................... 3 5. Deliverables............................................................................................................................................. 4 6. Literature Review.................................................................................................................................... 5 6.1. Overview....................................................................................................................................... 5 6.2. Operation Analysis........................................................................................................................ 6 6.3. Facilities Planning ......................................................................................................................... 7 6.3.1. Systematic Layout Planning ................................................................................................ 8 6.3.2. Strategic Facility Planning .................................................................................................. 9 6.4. Housekeeping (5s) ...................................................................................................................... 10 6.5. Line Balancing............................................................................................................................. 11 6.6. Training and Award systems ...................................................................................................... 12 6.7. Flow diagrams............................................................................................................................. 12 6.8. Tool Analysis ............................................................................................................................... 13 6.9. Lean Manufacturing ................................................................................................................... 13 6.10. Total Quality Control ................................................................................................................ 14 6.11. Fishbone Diagram (Ishikawa) ................................................................................................... 15 6.12. Gantt Chart ............................................................................................................................... 15 6.13. Queuing Theory ........................................................................................................................ 15 6.14. Critical Path Method (CPM)...................................................................................................... 16 6.15. Selection of Appropriate Methods, Tools and Techniques ...................................................... 17 7. Data Gathering and Analysis................................................................................................................. 17 7.1. Overview..................................................................................................................................... 17 7.2. Layout Data................................................................................................................................. 19 7.3. Tool Analysis ............................................................................................................................... 24 7.4. Material Analysis ........................................................................................................................ 26 7.5. Standard Process Analysis .......................................................................................................... 27
iii | P a g e
8. Conceptual Designs............................................................................................................................... 28 9. Conclusion............................................................................................................................................. 29 10. Reference ............................................................................................................................................ 30 Appendices
List of Figures Figure 1.1: Layout of the Powertech Transformers Plant in Pretoria West ............................................. 1 Figure 1.2: Active Parts Assembly Area ...................................................................................................... 2 Figure 1.3: Cores are Transported via the Overhead Crane ....................................................................... 3 Figure 2: Breakdown Structure of Literature Review ............................................................................... 6 Figure 3.1: Evolution of facilities planning.................................................................................................. 7 Figure 3.2: Modified SLP procedure ........................................................................................................... 8 Figure 3.3: Four-step SFP procedure ......................................................................................................... 9 Figure 4: Strategic priorities of 5s............................................................................................................. 10 Figure 5: Environmental performance factors ......................................................................................... 12 Figure 6: Summary of lean manufacturing .............................................................................................. 13 Figure 7: Fishbone diagram....................................................................................................................... 15 Figure 8: Activity box ................................................................................................................................ 16 Figure 9: Lean manufacturing strategy deployment ............................................................................... 18 Figure 10.1: Flow diagram of the cores being loaded onto the scaffolds ................................................ 19 Figure 10.2: Flow diagram of the Windings.............................................................................................. 20 Figure 10.3: Flow diagram of the materials and operators ...................................................................... 20 Figure 10.4: SLP relationship ratings......................................................................................................... 21 Figure 10.5: Available space in meter per square .................................................................................... 23 Figure 11.1: Toolboxes.............................................................................................................................. 25 Figure 11.2: Conceptual design of the label board................................................................................... 27 Figure 11.3: Example of the job card ........................................................................................................ 27
List of Tables Table 1: Production times and costs.......................................................................................................... 5 Table 2: Process evaluation procedure.................................................................................................... 28 iv | P a g e
Appendices Appendix A: Layout Areas in Figure 1.1 Appendix B: Activities for the Assembly of a Transformer Appendix C: SLP Process Model Appendix D: SFP Process Model Appendix E: Fishbone Diagram Appendix F: Initial layout design Appendix G: CPM applied to the entire production process Appendix H: Tool lists for operators, platforms and the assembly area Appendix I: How the Kanban system works Appendix J: Organization breakdown diagram Appendix K: Process evaluation diagram Appendix L: Conceptual Designs
v|Page
1.
Background and Introduction
1.1. Company Profile Powertech Transformers (previously known as ABB Powertech Transformers) is based in Pretoria West and is 80% owned by the biggest power-electrical group in Southern Africa, Power Technologies (Pty) Ltd. The remaining 20% is owned by Power Matla. The plant in Pretoria West is well equipped and one of the largest and sophisticated transformer manufacturing plants in the southern hemisphere and provides transformers to the African continent. The variety of products manufactured by the company ranges from three-phase and single-phase units, auto-transformers, shunt reactors, rectifier transformers and power distribution products. Powertech Transformers uses standardized design elements and manufacturing procedures that make the production process more flexible. All the separate parts and materials used to build the transformers are custom made by Powertech Transformers to ensure that the final product is of the highest quality. The products are used by local authorities, mines, industrial plants, motor manufacturers and the utility industry.
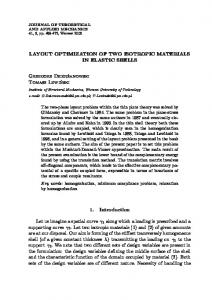
Figure 1.1: Layout of the Powertech Transformers Plant in Pretoria West 1|Page
1.2. Project Introduction Powertech Transformers manufactures all the individual parts for the power transformers. The company’s experience allows them to apply flexible and well co-ordinated manufacturing processes to ensure that the power transformers are of the highest quality. The plant is divided into several sections for each step of the manufacturing process (Figure 1.1). The active parts assembly area (Figure 1.2) will be the focal point in this project. This area consists of six assembly platforms/scaffolds where the individual power transformers are built. The power transformers are designed and manufactured to the customer specifications.
Figure 1.2: Active Parts Assembly Area The iron cores are built in the stacking area. From there the cores are transported via the overhead crane to the active parts assembly area where it is loaded onto an available assembly platform (Figure 1.3). The assembly steps and activities are further discussed in appendix B. The output of the active parts assembly area is the finished assembled power transformer.
2|Page
Figure 1.3: Cores are transported via the overhead crane
2.
Problem Statement
Powertech Transformers has identified that the current active parts assembly line’s production output is less
than optimal. The problems that have been identified are: � Production is behind schedule � Necessary tools to perform operations are not readily available � There is no demarcation of storage areas for the tools and materials used � Poor housekeeping of the area Improvements need to be focused on increasing the efficiency and effectiveness of the production process in the active parts assembly area.
3.
Project Aim
The aim of this project is to create an optimal work area in the assembly line that will enable the workers to perform their duties without any obstructions or delays and thus increase the production activity. Goals of the project: � Define and establish the current layout of the active parts assembly area � Optimize this layout area by implementing lean manufacturing techniques � Optimize the housekeeping � Identify the tools currently used and needed for the assembly process � Improve the identification, usage and storage of the tools and materials 3|Page
�
4.
Create a visible and safe work area
Project Scope
The project scope is as follows: � Physical measurement and development of the layout area and all the fixed workstations and machines in the assembly area � A study of the workers and the procedures they follow will also be done to get an understanding of the flow of the process � Conceptual designs of the layout area with improvements � Improving the tool usage of the individual workers, each platform, and the assembly line � Improving the housekeeping of the area � Establishing a process flow diagram � Evaluation and selection of best alternative layout The main objective is to increase the profitability of the company by minimizing the costs and maximizing the efficiency and effectiveness of the process and quality of the products.
5.
Deliverables
The deliverables of this project are the applicable industrial engineering tools and techniques that are used to improve the quality and efficiency in the assembly area. They are listed as follows: • Fish Diagram to determine the causes and effects of the problems • Gantt chart for project planning and control • Flow diagram • Operation Analysis: What, Why, How, Who, Where, When? • Chart relationships • Activity Relationship Diagram • Alternative Layout Evaluation • Training Approaches • Lean Manufacturing • Housekeeping (5S) • Critical Path Method • Systematic Layout Planning (SLP) • Total Quality Control • Facilities Planning • Tool analysis • JIT (Just-in-time) analysis • Kanban pull-system 4|Page
These techniques will be directed at identifying and improving the problem areas to create a work environment that is operating efficiently and productively.
6.
Literature Review
6.1. Overview The literature review is essential for the gathering of information that is relevant and useful to this project. The analysis of the information and data collected will ultimately provide a better understanding of the existing problems in the active parts assembly area and how various methods can be used to solve these problems. The focus point is to create an optimal solution from the different industrial engineering techniques that will reduce the costs and improve the productivity of the assembly area. The following sources were used for this information gathering: � Observations by the student � Discussions with the workers � Discussions with Mentor � Textbooks � Journals � Previous studies � Internet Powertech Transformers is currently struggling to make profit on the active parts assembly line. The average production time and costs for large and small power transformers are shown in Table 1. Small Transformers Large Transformers Production Cost R4 million Production Time 14 weeks Table 1: Production Times and Costs
R18 million 26 weeks
Interest costs and penalty costs are paid for every day that the product is late for delivery. The interest is currently taken on a fixed rate of 12.5% (subject to change). The penalty rate per day can vary between 0.1% and 10% of the product value, as stipulated in the contract. If a small transformer is 5 days late and the penalty rate is 10% per day; the total costs lost would be R5480 per day penalty cost and R6850 interest cost. It is clear that a great amount of money will be lost if the production is behind schedule. The factors responsible for the late product delivery time are listed in order of most occurrences: 5|Page
1. Absenteeism of operators 2. Poor performance 3. Poor quality 4. Engineering changes 5. Late supply from suppliers 6. Breakdowns of machines According to Niebel et al (2003) “the objective of the manufacturing manager is to produce a quality product, on schedule, at the lowest possible cost, with a minimum of capital investment and a maximum of employee satisfaction.” A study of possible techniques is done to determine which methods will produce this end result. The techniques under consideration for the problem solving are shown in the breakdown diagram in figure 2 and are further discussed in this literature study.
Figure 2: Breakdown Structure of Literature Review 6|Page
6.2. Operation Analysis Operation analysis is an effective method used by many methods analysts in their quest to improve work centres and increase productivity in productive and non-productive sections of an organization. The questioning approach is used in all areas of the organization to help obtain all the relevant facts. Niebel et al (2003) states that “practically all operations can be improved if sufficient study is given to them.” The six primary questions asked to gather facts are what, why, how, who, where and when. Nine systematic approaches have been developed to assist with the analyzing of the facts gathered. These nine approaches are: � Operation purpose � Part design � Tolerances and specifications � Material � Manufacture sequence and process � Setup and tools � Material handling � Plant layout � Work design
6.3. Facilities Planning Facilities planning help with the coordination of the organization, processes, products, facilities and customers in such a way as to achieve efficiency in the entire business. In the manufacturing sector it becomes more complex and difficult to facilitate the overall objective throughout the plant because of the multiple activities involved. Sule (1994) states that “planning is vital for the efficient utilization of available resources. “ A successful facility requires good planning and design. The following five steps is a basic approach to facilities planning: 1. Establish clear goals of what the client want to accomplish with the facility. 2. Collect and analyze data about existing space standards 3. Create concepts of how to attain the specific goals. 4. Determine the costs associated with space, supports, schedule and quality. 5. Summarize the solution and use it to help with the evaluation of the 7|Page
project design and construction. Figure 3.1: Evolution of Facilities Planning
6.3.1.
Systematic Layout Planning (SLP)
Systematic Layout Planning is a tool developed by Muther that provides the industry with layout design guidelines. Niebel and Freivalds (2003) state that “the goal of SLP is to locate two areas with high frequency and logical relationships close to one another.” Figure 3.1 depicts a modified version of Murther’s SLP procedure (Chien, 2004). SLP Procedure: The input data contains information regarding the P (product), Q (quantity), R (route), S (support), T (time), and production activities.
Figure 3.2: The modified SLP procedure
The relationship diagram is developed to show the degree of importance of having certain work centres located near or next to other work centres or activities. The information needed for the relationship diagram can be gathered from the input data, from-to-chart and activity relationship charts. The from-to-chart depicts the quantitative functional interactions between areas (flow of materials) and the activity relationship chart shows the activities (like material handling) taking place between the certain work centres.
The space limitations will guide with the development of possible layout alternatives. Systematic layout planning uses adjacency-based scoring to develop the layout alternatives. Trial and error will help with the selection of a satisfactory layout. 8|Page
See appendix C for a detailed summary of the SLP procedure.
6.3.2.
Strategic Facility Planning (SFP)
Strategic facility planning is a proactive process that creates strategic facility goals that is in line with the organization’s strategic business objectives. The four-step SFP process (figure 3.2) is used to assist in the in-depth study of the existing facility and helps with the development of an improved facility plan that will give the organization a competitive advantage. SFP Process: Understanding A balanced scorecard can be used to understand the long term mission and goals of the organization. The understanding of the current business demographic and available resources is essential for SFP. Analyzing Brainstorming, scenario planning, SWOT analysis and SLP can be used to analyze the different elements of SFP: employees, processes, organization structure, government regulatory requirements, market position, product volumes and capacity of resources. Figure 3.2: Four-step SFP process (http://www.ifma.org/tools/files/SFP_WhitePaper.pdf) Planning The plan development phase creates the course of action that will support the organization’s goals in the long term. IFMA’s steps in setting up the plan consist of: � Documenting primary objectives � Evaluating the factors that are critical for success � Risk analysis to find maximum value � Developing alternatives � Developing a process for marketing the recommended SFP to gain approval � Obtain financial and other relevant approvals � Launch the action phase Acting The implementation of the SFP plans can be done by different projects being launched. Feedback on the success and failures of these projects will help to continuously improve and update the plans. IFMA, in its “Strategic Facility Planning: A white paper, 2009” report, defines strategic facility 9|Page
planning as: “The process by which a facility management organization envisions its future by linking its purpose to the strategy of the overall organization and then developing goals, objectives, and action plans to achieve that future. The result of the strategic facility planning process is the strategic facility plan.” The Strategic Facility Planning process model is shown in detail in appendix D.
6.4. Housekeeping (5s) According to Jacobs et al (2009) “good housekeeping entails keeping only necessary items in the work area, that there is a place for everything and that everything is clean and in a constant state of readiness. When good housekeeping is in place tidiness, quality control, safety and pride will result at the end of the day.” The 5s methodology is based on the 5 Japanese acronyms: � Seiri – Organisation � Seiton – Neatness � Seiso – Cleaning � Seiketsu – Standardisation � Shitsuke – Discipline The aim of 5s is to embed these values into the workplace. Housekeeping is the western term used for work place organisation or 5s. It is a value driven business model that can be seen as the initiating point within lean manufacturing. The primary objective of 5s is to create a safe and healthy work environment where productivity can be increased. The strategic priorities of productivity, quality, costs, delivery, safety, and morale are depicted in figure 4.
Figure 4: Strategic priorities of 5s (Gapp et al (2008))
Benefits from implementing 5s are: � Reduced workload and human errors � Simplified processes � Maximized effectiveness � Increased quality � Enhanced level of worker morale 10 | P a g e
� Healthier and safe work environment � High level of autonomy 5s is a stepping stone to an integrated management system, but it can only be achieved through total participation and high levels of managerial decision making. Some activities that support the 5s implementation is: � U-shaped cells and cell layout � Visual controls � Setup reduction � Ergonomic improvements � TPM � Pull Systems (Kanban) � WIP reduction � Poka-Yoke Device
6.5. Line Balancing Line balancing determines the ideal number of workers to be assigned to a workstation or assembly line. Jacobs et al (2009) defines assembly–line balancing as the “problem of assigning all the tasks to a series of workstations so that each workstation has no more than can be done in the workstation cycle time, and so that idle time across all workstations are minimized. “ The most common objective of line balancing is to maximize the capacity utilization of the line and minimize the flow time. The steps of performing line balancing by Jacobs et al (2009) are as follows: � Draw a precedence diagram which depicts the order in which tasks must be performed. � Determine the workstation cycle time (C): C= � Determine minimum number of workstations required (N): N= � Select primary rules by which tasks are to be assigned to workstations. � Assign tasks, one at a time, to the first workstation until the sum of task times are equal to the workstation cycle time. Repeat process for rest of workstations until all tasks are assigned. � Evaluate efficiency of the balance : Efficiency= 11 | P a g e
� Rebalance the line using a different decision rule if the efficiency is unsatisfactory.
6.6.
Training and Award Systems
(Jong and Hartog, 2007) states that “one way for organizations to become more innovative is to capitalize on their employees’ ability to innovate”. The management of personnel requires a high level of people management skills. It is important to have employees who are trained and motivated as it will directly impact the quality of the product and productivity of the organization. A study (Jong and Hartog, 2007) shows that there are 13 behaviours that a leader can undertake to promote innovation in the workplace: � Innovative role-modelling � Intellectual stimulation � Stimulating knowledge diffusion � Providing vision � Consulting � Delegating � Support for innovation � Organizing feedback � Recognition � Rewards � Providing resources � Monitoring � Task assignment Employee–employer factors that influence the environmental performance of the organization are shown in figure 5. Figure 5: Environmental Performance factors
6.7.
Flow Diagrams
The flow diagram provides the most relevant information of a manufacturing process. It is a graphic depiction of the movement of materials from one activity to the next. The flow pattern of the materials and tools can be drawn on an existing layout plan of the plant area. The direction of flow is represented by an arrow. Departments or areas of importance 12 | P a g e
can be referenced by numbers on the diagram. Flow diagrams facilitate with the elimination and reduction of any hidden costs associated with a specific activity of the process. Traffic congestion areas and backtracking of materials will be made visible on the flow diagram, and can assist in the development of an optimal plant layout alternative (Niebel and Freivalds, 2003). Bottlenecks can also be identified on a flow diagram. A bottleneck is a resource that limits the capacity of the process and can thus be seen as the pacesetter of the flow rate in the manufacturing system. Improved bottlenecks will lead to an improved system.
6.8.
Tool Analysis
According to Niebel et al (2003) the amount of tooling that is most advantageous depends on: � The production quantity � Repeat business � Labour � Delivery requirements � Required capital Poor planning and inefficient tooling leads to increased setup times and costs. A tooling evaluation checklist can be used to determine the amount and state of the current tools and which tools are needed. Standardized equipment and tooling should be used as far as possible. Tool analysis determines the effectiveness of certain tools and their specific tasks. It is important to make sure that the correct tooling is used for the correct job so that the quality of the product will not be affected.
6.9.
Lean Manufacturing
Lean manufacturing was developed in Japan with the main goal of improving quality and productivity by eliminating waste and by respect for people. Fujio Cho has identified seven types of wastes that need to be eliminated from the supply chain: 1. Overproduction 2. Waiting 3. Transportation 4. Excess inventory 5. Over-processing 6. Unnecessary motion 7. Defects
13 | P a g e
The Toyota Production System led the way to lean production by using integrated activities to achieve high volume and quality products. A graphical depiction of lean manufacturing and its components are shown in figure 6.
Some lean manufacturing tools and techniques used in the industry are: � Cellular management – rearrangement of tools, workers and workstations to eliminate waste � JIT production – producing what is needed when needed � Kanban system – card is used as signalling device to maintain JIT � Kaizen – continuous improvement of machinery, materials, tools, methods and labour utilization through the suggestions and ideas of company teams � Minimized setup times � Uniform production flow/ production smoothing – keep production level as constant as possible � Focused factory networks � Quality at the source – do it right the first time � Poka-yokes – preventing mistakes from becoming defects � Standardization of work � Total productive maintenance – preventive maintenance, corrective maintenance and maintenance prevention
LEAN MANUFACTURING
TECNOLOGY
PEOPLE
SYSTEMS
Short Cycles Continuous Improvement Total Quality Focus Figure 6: Summary of lean manufacturing
6.10.
Total Quality Control
Total Quality Control seeks to eliminate/ reduce any causes of production defects and variations by using statistical quality control techniques. It was developed from the concept 14 | P a g e
of quality circles, where problem solving groups were formed consisting of people from different departments. The group then aimed to solve the problem that was responsible for certain defects. Kaizen is central to total quality control. In order for the product to be of good quality the design, functional/operating, environmental, safety, and reliability requirements must all meet the original specifications.
6.11.
Fishbone diagram (Ishikawa)
The fishbone diagram is used to determine the primary and secondary causes of a certain event/problem. These causes can be grouped into six major categories: people, methods, machines, materials, measurements and environment. Other relevant categories can also be used. Figure 7 is a graphical representation of how the Ishikawa diagram works.
Figure 7: Fishbone diagram
6.12. Gantt Chart The Gantt chart assists with the planning of the project schedule. It shows the starting, finishing, and other relevant dates. The project is broken down into the different activities that must be performed by using a work-breakdown structure. These activities are listed and scheduled on the Gantt chart. Schedule updates and percent-complete shadings show the status of the project. The data gathered from the Gantt chart will assist in the prevention of running behind schedule.
6.13. Queuing Theory Mathematical models have been developed to describe and determine queues. Queues occur when there are a limited service capacity and the flow of arriving customers/ products are more than the capacity. Queuing models can assist with the development of an 15 | P a g e
“economic balance between waiting times and service capacity” according to Niebel et al (2003). There are four characteristics of queuing problems: � The arrival rate � The service rate � Number of servers � Queue discipline, ex. FCFS discipline (first come, first served) Some systems follow a Poisson arrival order. In this case there exist five possible categories, each with their own equations: (Niebel et al (2003)) 1. Any service time distribution and a single server 2. Exponential service time and a single server 3. Exponential service time and finite servers 4. Constant service time and a single server 5. Constant service time and finite servers
6.14.
Critical Path Method (CPM)
Critical path method is a planning tool that shows the optimum way of achieving some predetermined goal. CPM helps to determine which activities are critical and must be completed first before the next activities can start, and it determines the duration period of the project. Information regarding the costs of activities can help to determine the most economic way to speed up a project if it is necessary. CPM can only be done once all the individual activities of a project are predetermined. The method used for CPM is called the critical path diagram or the activity-on-arc (AOA) diagram. Each activity is represented by the box shown in figure 8 with the relevant information as indicated. The activities are graphically connected in the order in which they take place. The different paths to the end result can be identified on the diagram. The longest path is known as the critical path, and it represents the minimum time required to complete the entire project.
16 | P a g e
Figure 8: Activity box (Source: http://hspm.sph.sc.edu/Courses/J716/CPM/CPM.html)
6.15.
Selection of Appropriate Methods, Tools and Techniques
The information gathered from the observations and the mentor highlighted the need for improvement in the overall layout, material flow, tool efficiency and availability, and worker performance. The above mentioned tools and techniques have certain aspects as to solving these problems. The most important tools that will be used in this project are: � Fishbone diagram (problem identification) � Systematic layout planning (improved and efficient layout) � Flow diagram (improved flow of materials) � Lean manufacturing (waste elimination) � Tool analysis (efficient tooling) � Training and reward incentives (worker motivation)
7.
Data Gathering and Analysis 7.1. Overview
The wastes need to be identified and removed from the active assembly line in order for the productivity to increase. The fishbone diagram was used to determine the causes of the assembly line problems and the effects it has on the system (appendix E). From the fishbone diagram the following wastes have been identified: � Time spent waiting for materials to arrive � Time spent trying to find the correct tooling � Distances travelled to find the materials and tooling � Unnecessary motion of workers � Defective product occupy platform/ scaffold that causes delays in the assembly area as the following jobs cannot be started � Defects occur because of poor quality and performance of operators � Possible production time wasted as a result of absent employees The factors responsible for the late product delivery time (and thus increased costs) can also be seen as waste. (Listed in order of most occurrences): 1. Absenteeism of operators 2. Poor performance 17 | P a g e
3. 4. 5. 6.
Poor quality Engineering changes Late supply from suppliers Breakdowns of machines
Considering all the above mentioned waste, it can be concluded that the areas of immediate importance is the accessibility and availability of the materials and tools, a user-friendly layout, and worker morale. Applying an interrelated lean manufacturing approach will help to solve these problems. Figure 9 shows the lean manufacturing strategy deployment that will be used.
After the wastes have been identified, the next step is to determine exactly what approach to take to try and minimize or eliminate the waste where possible. This is summarized in figure 9: � 5s is the initiating point for lean manufacturing � It entails good housekeeping which means only the necessary items is in the work area, there is a place for everything and everything is clean and in a constant state of readiness � Operator involvement is absolutely essential for 5s to be successful and will also result in a sense of pride, thus an increased worker morale � Visual controls is an activity that support the 5s implementation � Visual controls and housekeeping needs to be incorporated into the layout � Kanban is a system designed to facilitate smooth operation
18 | P a g e
�
Standard work procedures (that will explain the use of kanban and housekeeping) need to be written and adhered to by the entire operating team
The outcomes of this project will be a layout design that incorporates the easy usage and accessibility of tools and materials, and a standard working procedure in which the production process is summarized and available for use by all parties involved (especially management and the operators).
7.2. Layout Data The plant layout was physically measured and drawn up in CAD to serve as a starting point for further improvements and implementations. This process aided in the data gathering for the project and created an in-depth understanding of the workings in the current assembly area. The initial layout of the plant can be seen in appendix F. Following the systematic layout planning procedure, the subsequent data were collected. 1. Input Data (product, quantity, route, support, time) The critical path method (CPM) was used to draw the production flow of a transformer (the entire production process taking place including the assembly process) as well as indicate the path that is of high importance. See appendix G for the CPM and appendix B for the assembly process of a transformer. 2. Flow of materials It is important to mention that for the scope and budget of this project, a total renovation of the assembly area is not feasible. The scaffolds/ platforms are fixed measurements. The focus will therefore be on the location and layout of the materials and tools. The layout design will be made around the platforms. Figure 10.1: Flow Diagram of the Cores being loaded onto the Scaffolds/ Platforms
19 | P a g e
Figure 10.2: Flow Diagram of the Windings
Figure 10.3: Flow Diagram of the Operators & Materials
20 | P a g e
3. Chart relationships
Vowel Letter
Value
A E I O U X
4 3 2 1 0 -1
Lines
Importance
Colour Code
Abnormally High Especially High Important Ordinary Unimportant Not Desirable
Red Orange/ Yellow Green Blue Uncoloured Brown
Figure 10.4: SLP Relationship Ratings
21 | P a g e
4. Space requirements
5. Space available
22 | P a g e
Figure 10.5: Available space in meter per square
6. Activity relationship diagram
List of Abbreviations: � PF – Platform � WT – Winding Trolley � MT – Material Trolley � CT – Core Trolley � HS – Harness Storage � TO – Toolbox Operators � TP – Toolbox Platforms 23 | P a g e � TA – Toolbox Assembly
7. Space relationship diagram
8. Practical limitations The platforms are fixed in the positions that they currently occupy. Green areas exist in the active assembly area that cannot be put to use. Areas for the workers to occupy during their tea breaks are also lost space. The overhead cranes are used to move the assembled and/or assembly parts. The cranes can only move one part at a time, and only if there is an available platform where the parts can be moved to.
7.3. Tool Analysis To simplify the layout and production area three different groups of tooling were identified: 1. A tool list for each operator. Currently there are two different types of toolboxes in use and these are scattered over the area. Considering the ultimate goal of good housekeeping, universal toolboxes were decided upon. Demarcation areas on the layout will promote a neater and thus safer work environment. 24 | P a g e
BEFORE
AFTER
Figure 11.1: Toolboxes The new toolbox is more compact, mobile, and easier to handle and keep neat, making inspections more efficient. The top part can be conveniently separated from the body if needed. Apart from finding the correct toolbox that can be utilized by each operator, the content needed to be sort out. Toolbox inspections and the analysis of the assembly process assisted with the development of an updated operator toolbox list that can be seen in appendix H. 2. Tool list for each platform/ scaffold A toolbox located near each platform should contain all the tools that are needed by the platform. The tool list can be viewed under appendix H. 3. Tool list for assembly area Tools utilized by the entire assembly area are listed here. It includes the overhead cranes and other more expensive tooling. See appendix H.
25 | P a g e
Correct tool usage is very important as it ensures a prolonged tool life-cycle and can minimize any possible damage to the assembly parts. The scheduling and upkeep of maintenance and inspection activities for the different tooling need to be determined beforehand. This will ensure that any occurring problems with the tooling can be identified and solved before it has a negative effect on the production output.
7.4. Material Analysis The master production scheduler determines ahead of time which “projects” will be built in the active assembly area. This entails intricate planning of the availability of the overhead cranes, the relevant platforms to be used, allocating available operators to the “project”, and ordering the “project’s” materials from the insulation shop, to name a few. (The term “project” refers to the power transformer being built and assembled at the request from a customer.) The main problem with the materials is that it is not readily available for use. Operators continuously move around to find the materials. This is because of a lack of planning. The Kanban pull-system is an ideal lean manufacturing technique to help create a production flow that runs continuously and smooth. According to Masaaki Sato in “The Toyota leaders – An executive Guide” Kanban is “a system designed to minimize waste by which a labelled card is returned to the previous process to indicate which parts are required for the subsequent process.” A conceptual explanation of how the Kanban pull-system works can be seen in appendix I. The approach developed for the situation in the active assembly area will work as follows: (It is important to note that this approach is only based on the Kanban pull-system and will cover the active assembly area.) � A section of the layout will be demarcated for specific use by the material trolleys. (Note that each “project” has material trolleys allocated to it) � This section will be divided into 6 areas (one for each platform), also known as the “Material trolley bays”. � The bay area is in a state of “ready for use” so that the next job can start without delay. � The material trolleys will be temporarily stored in this area until the relevant “project” (which also refers to the platform where that “project” is scheduled to be built) sends for it. � The material trolleys will then be moved to that relevant platform. � As the material trolley bay opens, a labelled card on the label board will indicate which “project” or job card is scheduled to be build next. The operator must then get the material trolleys for that job from the insulation shop to fill the bay. � A labelled card will also indicate which projects are currently in process or are complete. 26 | P a g e
In order for this approach to be successful, detailed planning and a joined collaboration is needed from an interrelated perspective. Visual aids (a label board and bright signalling cards) will enhance the effectiveness of the system. The marked spaces on the floor will indicate where the materials should be stored. Below is the conceptual design of the label board. Big Platform 1
Big Platform 2
Big Platform 3
Small Platform 1
Small Platform 2
Small Platform 3
Job Card 1
Job Card 1
Job Card 1
Job Card 1
Job Card 1
Job Card 1
Job Card 2
Job Card 2
Job Card 2
Job Card 2
Job Card 2
Job Card 2
Job Card 3
Job Card 3
Job Card 3
Job Card 3
Job Card 3
Job Card 3
Job Card 4
Job Card 4
Job Card 4
Job Card 4
Job Card 4
Job Card 4
Figure 11.2: Conceptual design of the label board The visual board and associated labelled cards will be located near the material trolley bay area. The master scheduler will determine ahead of time which jobs are to be completed, in which order and on what platforms. There are three types of colour cards that will be used for each platform. The red card will indicate which jobs are completed. The green card indicates which jobs are currently in process, and the yellow card is the job who’s material trolleys should occupy the bays. The red card will always be followed by the green card and the green always by the yellow. This label board will help the operators and the master scheduler to keep track of the operations in the assembly area. The job card will have a duplicate attached to it so that it can be removed by the operator that is getting the material trolleys to ensure that the correct materials are collected. It will contain basic information of the job/ project. Job Number ________________ Client _________________
27 | P a g e
Insulation Shop
Material Parts Numbers
Bay at which to store
Check if material trolley is complete
Operator
Figure 11.3: Example of the job card
7.5. Standard Process Analysis Currently there is no procedural documentation available for reference at Powertech transformers. The development and implementation of a standard process map for the active assembly area will serve as guidance for the operators to refer to and follow. This will create an environment that has a unified goal that is pursued by everybody in the manner outlined in the procedural documentation. It will also aid in dissolving any irregularities that may arise during the production process. Another benefit from a procedural document is that it will assist in briefing and explaining the process occurring in the active assembly area to new operators or members of the company. A practical walk-through and informative session was undertaken to understand exactly the how, what, where, when, and why of the assembly process. See appendix B for a review of the assembly process. For the development of a process map for the active assembly area it is necessary to have an overview of the entire organization and to understand the interrelationships that exist between the assembly area and the rest of the organization. The company’s overall goals and missions must be kept in mind when figuring out where the assembly area fits into the company’s functional business structure. This will assist in understanding how the entire company is integrated and ultimately “who has an effect on whom”. Operations analysis will assist in the study of identifying the process steps. It promotes the approach of defining the suppliers, inputs, processes, outputs and customers of each functional business activity. The simple example of the process of making photo copies is illustrated in the table below. This approach helps to identify all parties involved or affected by certain processes. SUPPLIERS Manufacturer, Office supply company, Yourself, Power company 28 | P a g e
INPUTS Copier, Paper, Toner, Original, Electricity
PROCESSES
OUTPUTS
Making a photo Copies copy
CUSTOMER You, File, Others
Table 2: Process evaluation procedure This approach will ensure a complete and thorough understanding and development of an inclusive process model. See appendix J and K for the organization breakdown diagram and process evaluation diagram respectively. From the process evaluation diagram and organization breakdown diagram the assembly area’s process map was developed. It is depicted in the following diagram.
Design of customer’s order Job orders attached to label board in assembly area under relevant platform
Schedule production of the job order
Project Leader Master production Scheduler Red
Job is Complete. Update register & send report to Master production scheduler
Yellow Status of job card
Materials collected from Insulation shop
No
Material trolleys Complete?
PlatformOperator
Project Leader
PlatformTeamleader & operators
Assemble transformer according to design and standard procedure
Job is in Process. Design taken to the relevant platformto use as reference
Take Materials to relevant platform when job order is “green”
Project Leader
Platform Operator
Inspections are executed during the assembly process as stipulated in the standard procedure
Insulation Shop Yes
Green
Core loaded onto platform
Check list and ensure all the required materials are in the trolleys
Store material trolleys in bay area PlatformOperator
Yes Processing, Cooling & Tanking
Quality & Testing Succeeds
Job is complete. Send report to master production scheduler. Dispatch product to next department Project Leader
PlatformTeam No
Platformteam Windings collected from winding shop
Fix problem
Yes Pass Inspection
PlatformOperator
PlatformTeamleader & operators Collect Harness from insulation shop PlatformOperator
No
Transformer dissembled until problemis fixable Platform Team leader & operators
Clean platform &return all trolleys and tools to their demarcated areas PlatformTeamleader & operators
Inspection of platform area PlatformTeamleader
29 | P a g e
8.
Conceptual Designs
The data gathered were analysed and implemented into the conceptual designs developed. See appendix L for the three alternative conceptual designs. The differences between the three designs are as follows: DESIGN 1 DESIGN 2
DESIGN 3
The rack for the operator’s A rack for the operator’s No rack for the operator’s toolboxes is designed next to toolboxes is designed in the toolboxes. Areas for the small platform 1. entrance area (green area). toolboxes are demarcated near each platform. These areas are for the platform’s operator’s toolboxes. No cleaning rack designed. Cleaning rack designed next to Cleaning rack designed next to small platform 1. small platform 1. Material bins are located in Material bins are located in Material bins are located in green area. green area. usable area. Harness rack located next to Harness rack located next to Harness rack located in original material trolley bays. material trolley bays. position. Material trolley bay 1 (for big Material trolley bay 1 (for big All the material trolley bays are platform) is located next to the platform) is located next to the located next to each other. aisle. aisle. Vacuum cleaners are next to Vacuum cleaners are next to Vacuum cleaners are on the the platforms. the platforms. platforms.
From the comparisons above it is easy to see that design 3 is the best option as it will cost less to implement, has made provisions for cleaning, is conveniently designed, and has more space available for easy movement. The different areas depicted in the layout will be demarcated using tape and labelling it. This will result in improved housekeeping as cleaning equipment is provided and everything has a fixed place where it should be, keeping the layout neat and safe for the operators. It is recommended that the operators should be giving training regarding lean manufacturing as their involvement is crucial. Powertech transformers have a training division who is in control of the planning and execution of any training incentives.
30 | P a g e
9.
Conclusion
The current state of Powertech Transformers’ assembly area is inefficient and nonprofitable. This project’s main aim was to optimize this area and the process by focusing on improving the following: � � � �
The material flow Tool usage Layout of the assembly area Housekeeping
Operators are constantly moving around looking for the correct tools and materials, wasting time and thus leading to extra costs. Focusing on the layout of the area, there has been an attempt to rectify this situation by creating an area that promotes smooth material flow. The most appropriate methods applied to achieve this were systematic layout planning and lean manufacturing. The Kanban pull-system was used as a reference to promote continuous work flow in the area and also to help keep track of the operations in the area. The selected conceptual design was chosen for implementation as it is less costly, promotes good housekeeping and has more free space available for movement. It has been suggested that this layout be implemented in order to reduce unnecessary waste and thereby improving the productivity of the area. Tool analysis was done to determine the type and amount of tools needed for the assembly process. Correct tooling is of the highest importance to prevent the product from being damaged. The process map was drawn for the area to serve as guidance for the operators to refer to and follow. This will create an environment that has a unified goal that is pursued by everybody in the same procedural manner. This project contains suggestions on how to optimize the assembly area and offer possible solutions to some of its problems. For practical purposes it can be estimated that potential savings of around 60% can be anticipated if these plans are implemented. This is calculated by means of considering the penalty and interest costs that will be decreased as a result of improvements to the material flow, tooling, and layout.
31 | P a g e
10.
References
Sato, M. (2008). The Toyota Leaders – An executive Guide. New York: Vertical, Inc. Niebel, B.W., Freivalds, A. (2003). Methods, Standards, and Work Design (11th Ed). New York: McGraw-Hill. Jacobs, F.R., Chase, R.B., Aquilano, N.J. (2009). Operations and supply management (12th Ed). New York: McGraw-Hill. Winston, W.L. (2004). Operations Research:Vol.2 (4th Ed). Canada: Brooks/Cole. Schonberger, R. J.(1982). Japanese Manufacturing Techniques:Nine hidden Lessons in simplicity. USA: The Free Press. Sule, D.R. (1994). Manufacturing Facilities: Location, Planning,and Design (2nd Ed).Boston: PWS Publishing Company. Abdullah, F. (2003). Lean manufacturing tools and techniques in the process industry with a focus on steel. pp.10-21. Firestone, B. (2000).Class notes 77.450. Design Economics Fall 2000. Govindarajulu, N. & Daily, B.F. (2004). Motivating employees for environmental improvement. Industrial Management & Data Systems. (Vol.104. No.4):pp.364-372. De Jong, J.P.J. & Den Hartog, D.N. (2007). How leaders influence employees’ innovative behaviour. European Journal of Innovation Management. (Vol.10.No.1):pp.41-64. Roper, K.O., Kim, J.H., Lee, S.H. (2009). A white paper on strategic facility planning. IFMA. pp.1-22. Chien, T.K. (2004). An empirical study of facility layout using a modified SLP procedure. Journal of Manufacturing Technology Management. (Volume 15. No.6):pp.455-465.
Gapp, R., Fisher, R.,& Kobayashi, K. (2008). Implementing 5S within a Japanese context: an integrated management system. Management Decision. (Vol.46.No.4):pp.565-579. Domingo, R., Alvarez, R., Pena, M.M.,& Calvo, R. (2007). Materials flow improvement in a lean assembly line: a case study. Assembly Automation.pp.141-147. Kerns, F. (1999). Strategic facility planning (SFP). Work study. (Vol.48.No.5):pp.176-181.
32 | P a g e
http://www.ifma.org/tools/files/SFP_WhitePaper.pdf (Accessed 10 May 2010) http://www.mirpbooks.com/index_files/SLPPDF.pdf (Accessed 10 May 2010) http://www.fprinc.com/programming.html (Accessed 10 May 2010) http://hspm.sph.sc.edu/Courses/J716/CPM/CPM.html (Accessed 10 May 2010) http://en.wikipedia.org/wiki/Ishikawa_diagram (Accessed 10 May 2010) http://en.wikipedia.org/wiki/Lean_manufacturing (Accessed 10 May 2010) www.pttransformers.co.za
33 | P a g e
APPENDIX A: Layout Areas in Figure 1.1
1. Outside View 2. Reception 3. Steel Cutting 4. Large Tank Manufacture 5. Insulation Area A 6. Insulation Area B 7. Paper Lapping 8. Core Slitting 9. Core Stacking 10. Small and Large Assembly Line A 11. Small and Large Assembly Line B 12. Large Winding Assembly A 13. Large Winding Assembly B 14. Marshalling Kiosk 15. Transformer Test Control Room 16. Transformer Test Bay 17. Transformer Despatch Area
34 | P a g e
APPENDIX B: Activities for the Assembly of a Transformer
Core Loaded onto Assembly Platform
Top Core Clamps Removed
Alignment of Bottom End Insulation (3 Phases)
Point Inspection on Bottom End Insulation
Assembly of set-up against Core Limbs
Prepare and Fit Windings
Assembly of Outermost Setup
Top Ducts Alignment
Point Inspection: Top Ducts Alignment
Assembly of Top End Insulation
Assembly of Top Core Clamps
Pressing of Active Part Block Windings
Stack of Top Yoke Plates
Hold PointRatio Test before Connections
Pressing and Tightening Top Core Clamps
Connection Process
Fit Supports and Assemble Harness
Assembly of Tap changers
Completion of Active Part
Group, Official and Customer Inspections
35 | P a g e
APPENDIX C: SLP Process Model
36 | P a g e
APPENDIX D: SFP Process Model
37 | P a g e
APPENDIX E: Fishbone diagram
Machines & Scaffolds
Workers Environment Area not simplified
Poor scheduling Over capacity Product Redone
Lack of Training
Machine is idle
Lack of Skill
Lazy Poor maintenance Breakdown
Idle
Poor housekeeping
Lack of transport
Demotivated Cleanliness
Incorrect Use
Lack of tools Idle
Absent
Area not defined Demotivated
Poor Layout
Sick
Lack of workers
Assembly Line Problems Late order
Variety methods exists Poor worker performance
Not readily available
No process map
Production late
Do not know where it is
Poor maintenance upkeep
Materials
38 | P a g e
Poor scheduling
Methods
Administrative
APPENDIX F: Initial layout design
39 | P a g e
APPENDIX G: CPM applied to the entire production process
Path for manufacturing a transformer (Critical path in yellow)
Paper lapping
Insulation shop
Core cutting
Medium windings
Large windings
Core stacking
Active part assembly small
Steel yard
Core clamps & drilling
Active part assembly large
Covers & subassembly
Welding & lining up
Painting & preassembly
Processin g plant
Tanking
Bushings
Test board
Despatch
40 | P a g e
Machine shop
Marshallin g kiosks
Fabricatio n shop
APPENDIX H: Toolbox List for operators, platforms and the assembly area Tool List for Each Operator Tool Combination Spanner (Flat ring) Sizes:
Socket Sizes:
Allen key socket Sizes:
Hammers Rubber Mallet Hacksaw Ratchet Vice grip Pliers Water pliers Tin snipper Tape Knife Allen key set Torch Chisels
41 | P a g e
Description
Quantity
10mm 13mm 16mm 17mm 18mm 19mm 24mm 30mm
1 2 2 2 2 2 2 2
10mm 13mm
1 1
16mm 17mm 18mm 19mm 24mm 30mm
2 2 2 2 2 2
6mm 8mm 10mm 14mm 2lb 4lb 2lb Large Junior Long Small
1 1 1 1 1 1 1 1 1 1 1 2 1 1 1 1 1 1
5m 3m Swedish Swedish knife Long arm 9 pieces Mini Mag light Med
1 1 1
1 Long & 1 Short
Large Knife sharpener Pen Hand gloves Fibre Socket Size 30mm Extension Sockets for Ratchet
Long (250mm) Short (175mm)
Glue Bottles
1 1 1 1 1 1 1 1
Tools for each Platform Tool Vacuum cleaner Cutters Ratchet Sockets
Torches Hammer Stamps Levels Kits Torque wrench
Small head Large head Hollow punches Vernier 36mm 41mm 46mm Mag light torches 16lb hammer Small letter stamps Spirit levels long Power punch kit Torque wrench 40-200Nm
Quantity 2 2 1 1 1 1 1 1 6 6 2 2 1 1 set 2 1 1 1 2 1 1 2 1 1
Wire stripper
Crimping heavy duty wire stripper for crimping shields lugs
1
Cable reel
Open drum cable reel (twin socket) extensions 35M
2
Enerpack air pump Measuring tape Belt Elpress machine Crimping heads Punches Measuring equipment Flat/ring spanner
Dies Fiber wedges Steel wedges Calculator File Set screwdrivers Bending tool Wire cutting tool Stack knives
42 | P a g e
Description Big wire cutters Long 3/4 inch 36mm long 41mm long 46mm long 10m tape 3m ratchet belt 6m ratchet belt
Trolley with crimp and pre-rounding dies
Big PF
1 2 4 1 4 1 4 1 12
Small PF
10 2
Pennetjies
Tool List for Assembly Line Tools
Description
Quantity
Core cheeses stacking Jigs Block
Stacking jigs 1 ton 2 ton Lifting tool plate jigs 95mm 55mm
3 1 3 2 10 2 2
Heat gun Ratchet Ratchet belts Pipe Spanners
For big PF M16 200Nm Belts 24mm 28mm 32mm
2 1 20 1 1 1
Extractor Fan
Points pipes
3 2
Hydraulic G-clamp
Big Small
3 3
G-clamps for stacking
Big PF Small PF
12 4
Press bolts
200 ton 100 ton 60 ton 50 ton
4 4 8 4
Stiffeners
200 ton 100 ton
4 4
(Big PF) 100 ton 60 ton (Small PF) 60 ton
4 2 8 4 4 4
Core cheeses lifting tool Lining up cross flux plate jigs Flat ring Spanner
Top press beams Trestles Bottom press beams Pulling jacks
Hydraulic Power Pack
43 | P a g e
20 ton 30 ton 60 ton 100 ton
1 2 2 1
High frequency machine Grabs Winding grabs
Cranes
Enerpak Pneumatic Power pack Enerpak Hydraulic Air Jacks
Small Big
2 1 3 1
5 ton 30 ton 150 ton
2 1 2
(Big PF) 30 ton (Small PF) 30 ton 10 ton (short) 10 ton (long) 15 ton
Enerpak hand pump Shackles Bushing Lining Jig Tap changer jig Cylinder jacks Hydraulic pressure pump Magnet block Spacer blocks Spreader beams Hydraulic Pulling Jacks
Hydraulic Gauges
Nylon Slings
44 | P a g e
4 4 8 14 17 3 2 4 1 1
100 ton for fire hoses for end support for big jacks 30 ton 15 ton
4 1 1 10 1 8 8
15 ton 30 ton 60 ton 100 ton
2 1 3 1
9m - 100 ton 9m - 80 ton 10m - 100 ton 7.6m - 100 ton 7m - 80 ton 6m - 15 ton
2 2 2 2 2 4
APPENDIX I: Simplified explanation of how the Kanban pull system works
MATERIAL FLOW
DEPARTMENT 1
DATA FLOW
MATERIAL FLOW
DEPARTMENT 2
MATERIAL FLOW
DEPARTMENT 3
DATA FLOW
DEPARTMENT 4
DATA FLOW
The Kanban pull system is executed by means of a labelled card that is returned to the previous station/ department to indicate which parts are required for the subsequent process, thus which parts has already been used. The main goal of the Kanban pull system is to minimize waste by ensuring that the correct amount of materials/ parts are available when and where needed.
45 | P a g e
APPENDIX J: Organization breakdown diagram
General Manager
Director of Operations
Sales Manager
Purchasing Manager
Accounts Clerk
Purchasing Officer
Sales Officer
Logistics Officer
Manufacturing Manager
Maintenance Manager QC Manager
Internal Auditor
46 | P a g e
Controller
Chief Engineer
Industrial Relations Manager
Mechanical & Electrical Engineers
Personnel Officer
Manufacturing Departments
Mechanical & Electrical Technicians
Secretary
Production Scheduler
Operators
Office Assistant
APPENDIX K: Process evaluation diagram
47 | P a g e
APPENDIX L: Conceptual Design 1
48 | P a g e
Conceptual Design 2
49 | P a g e
Selected alternative (Conceptual Design 3)
50 | P a g e