WP/07/26
Italy—Assessing Competition and Efficiency in the Banking System Paulo Drummond, Andrea M. Maechler, and Sandra Marcelino
© 2007 International Monetary Fund
WP/07/26
IMF Working Paper European, Finance, and Monetary and Financial Systems Departments Italy—Assessing Competition and Efficiency in the Banking System Prepared by Paulo Drummond, Andrea M. Maechler and Sandra Marcelino Authorized for distribution by James Daniel February 2007
Abstract This Working Paper should not be reported as representing the views of the IMF. The views expressed in this Working Paper are those of the author(s) and do not necessarily represent those of the IMF or IMF policy. Working Papers describe research in progress by the author(s) and are published to elicit comments and to further debate.
The paper assesses the degree of banking competition and efficiency in Italy─over time as well as compared to that in other countries, such as France, Germany, Spain, the United Kingdom, and the United States. The paper finds competition in the Italian banking sector has intensified in loan and deposit markets in recent years, but banks still operate in a highcost, high-income system, particularly with respect to retail/services, and efficiency gains have yet to fully materialize. The degree of competition falls within the range of estimates for a set of comparator countries. Greater contestability should act as a powerful force to drive banks to become more competitive and efficient. Competition policy will also continue to be an important consideration, both in enforcing Italy’s antitrust laws and in ensuring that the procedures for dealing with weak banks and other merger and acquisition reviews focus on stability and competition objectives. JEL Classification Numbers: G21 Keywords: Banking, competition, efficiency, Italy. Authors’ E-Mail Addresses:
[email protected],
[email protected],
[email protected]
2 Contents
Page
Italy—Assessing Competition and Efficiency in the Banking System .....................................3 A. Introduction and Key Findings .................................................................................3 B. Consolidation and Concentration ..............................................................................4 C. Contestability and Costs Indicators...........................................................................7 D. Efficiency Estimates ...............................................................................................14 E. Market Power ..........................................................................................................18 F. Competition Policy and Financial Stability.............................................................22 Tables 1. Evolution in Average Scale of Italian Banks on Consolidated Basis ....................................6 2. Selected Countries: Market Concentration Indicators ...........................................................6 3. Foreign-Ownership in Banking Sector ..................................................................................8 4. Selected Countries: Cost of Banking Services.......................................................................8 5. ROE Decomposition, 1994–2004 ........................................................................................13 6. Selected Countries: Banks Coverage, 1998–2004 ...............................................................14 7. Selected Countries: Sample Statistics, 2004........................................................................27 8. Selected Countries: Panel Regression Results on Net Interest Margin Between Estimator with Weighted Least Squares.............................................................................................30 9. Selected Countries: Panel Regression Results on Operating Profits to Total Assets Between Estimator with Weighted Least Squares .............................................................31 10. Cross-Sectional Time-Series FGLS Regression (Dependent variable: operational income to total assets).....................................................................................................................32 11. Cross-Sectional Time-Series FGLS Regression (Dependent variable: operational expenses to total assets) .....................................................................................................33 12. Cross-Sectional Time-Series FGLS Regression (Dependent variable: operational profits to total assets).....................................................................................................................34 13. Cross-Sectional Time-Series FGLS Regression (Dependent variable: operational expenses to total assets) .....................................................................................................35 14. Cross-Sectional Time-Series FGLS Regression (Dependent variable: operational expenses to total assets) .....................................................................................................36 15. Selected Countries: Panzar-Rosse H-Statistics, 1998–2004 FGLS Regressions...............36 Figures 1. Banking Sector Size and per capita GDP, end-2003 .............................................................5 2. Banking Sector: Total Loans and Stock Market Capitalization, end-2004 ...........................5 3. Selected Countries: Concentration Indices, 1998 and 2004 ................................................10 4. Selected Countries: Top 50 Banks, 2004 Operating Revenues ...........................................10 5. Top 50 Banks: Profitability Indicators, end-2004................................................................11 6. Top 50 Banks: Indicators of Efficiency, 2004 .....................................................................12 Boxes 1. Data Source..........................................................................................................................14 2. Interpretation of H-statistic ..................................................................................................20 3. Competition and Stability: Key Findings of the Literature .................................................23 References................................................................................................................................37
3 ITALY—ASSESSING COMPETITION AND EFFICIENCY IN THE BANKING SYSTEM1 A. Introduction and Key Findings 1. The Italian banking system has been subject to deep structural transformation in the last two decades. Consolidation and privatization have permitted economies of scale in the production and distribution of services and increased risk diversification. These forces have led to lower costs and, undoubtedly, higher efficiency. However, to ensure that lower costs are passed through to households and firms, greater efficiency must be accompanied by a similar strengthening in the competitive environment in the banking sector. 2. This paper assesses the degree of banking competition and efficiency in Italy─over time as well as compared to that in other countries. Given the inherent difficulty of assessing competition from a single perspective, it relies on five main approaches: (i) indicators based on market structure, such as various concentration measures (Section B); (ii) contestability and cost indicators, including foreign bank ownership, bank retail prices and switching costs (Section C); (iii) profitability indicators (Section D); (iv) empirical efficiency estimates based on a panel of individual banks (Section E); and (v) market power indicators, such as Lerner and Panzar-Rosse indices (Section F). Whenever possible, we assess competition on an individual country basis and across time. 3. The paper finds competition in the Italian banking sector has intensified in loan and deposit markets in recent years, but banks still operate in a high-cost, high-income system, particularly with respect to retail/services, and efficiency gains have yet to fully materialize. The paper also finds the degree of competition falls within the range of estimates for a set of comparator countries. Cross-country indicators─both based on profit margins as well as on revenue elasticity─suggest the existence of monopolistic competition, as in other comparator banking sectors. However, there also are indications that competition has not been fully reflected in the pricing of services provided. More specifically, Italian banks incur significantly higher expenditures than other European banks and are only marginally more effective in generating higher revenue. These findings suggest a banking system that has undergone significant restructuring in recent years, but where efficiency gains have yet to fully materialize. 4. To secure efficiency gains, it will be important to ensure that markets are fully contestable. Greater contestability should act as a powerful force to drive banks to become more competitive and efficient. Competition policy will also continue to be an important consideration, both in enforcing Italy’s antitrust laws in the banking sector and in ensuring that bank merger and acquisition reviews focus on stability and competition objectives.
1
Prepared by Paulo Drummond (EUR), Andrea M. Maechler (MFD) and Sandra Marcelino (FIN). The material presented in this paper was originally prepared as background for the Italian Financial Sector Assessment Program (FSAP) that took place in 2004-2005. The paper abstracts from financial sector developments in 2006 which could affect the conclusions of part of the paper.
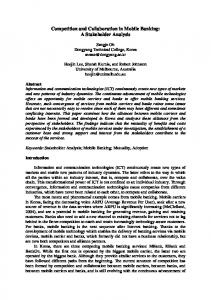
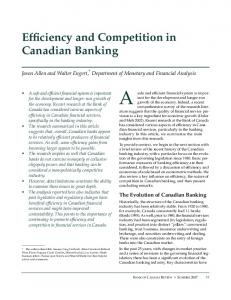
4 B. Consolidation and Concentration 5. In the late 1990s, the banking industry underwent rapid consolidation, but it remains relatively small compared to other EU member countries (Figures 1 and 2). Between 1995 and 2004, the number of institutions declined by a third (from 854 to 572 banks). The average size of banks (net of mutuals and foreign branches) more than doubled over this period from to € 5.5 billion to € 13.5 billion for all banks. At the end of 2004, net of mutuals, sector included 135 banks (Table 2 and Figure 2). 6. The consolidation process led to an increase in concentration, but one that was more moderate than experienced elsewhere. Market structure indicators, such as the Herfindhal-Hirschman Index (HHI)2 or the share of total bank assets held by the three, five, and ten largest institutions suggests a degree of concentration that is larger in Italy than in Germany, and the UK, but lower than in France (Table 2 and Figure 3).3 Concentration at the national level has increased (the largest five bank groups accounted for 46 percent of total assets at end-2004, compared with 37 percent a decade earlier). But after rising by more than 80 percent since 1990, the ratio of the number of branches to total population is now close to the EU average. According to the Bank of Italy (BI), this development has contributed to greater competition in provincial and regional markets, as evidenced by the rise in the average annual shift in deposit and lending market shares. The average number of banks in provincial markets is estimated to have increased from 27 to 30 in the last decade, and reached 35 at the end of 2004.4 The HHI for the provincial deposit market declined by around 12 percent from the peak it reached in 1999, falling back to the levels recorded in the mid1990s. In regional lending markets, the index declined by 20 percent between the end of the 1990s and 2004. 7. The economic impact of greater concentration depends on many factors. To shed light on this issue, a number of recent papers have estimated the price effect of mergers and acquisitions in Italy in the 1980s and the 1990s. For example, Focarelli et al. (2002) account for the pricing policies of merged banks, and provide some evidence that bank mergers can allow for better risk pricing through informational benefits (i.e., closer correspondence between the price of loans and the default risk of each firm). Sapienza (2002) explores the trade-off between efficiency gains and greater market power associated with mergers and finds that in-market mergers generate higher efficiency gains than do out-of-market mergers. 2
The Herfindhal-Hirschman Index (HHI) is the sum of squares of the market shares of all firms in a sector (HF = Σi (sharei)2, i = 1, ...,N). 3
Unless specified otherwise, cross-country bank data is drawn from the BankScope database (see Box 1 for description of sample selection). Although BankScope data presents some significant drawbacks, such as, for example, imperfect cross-country statistical harmonization, it is one of the few datasets that provides individual bank-specific data for a large set of country over time and one of the most commonly used datasets in empirical bank research. Bank-specific data allows us, for example, to focus on the systemically important banks (i.e., top 10 or top 50 banks) of the countries under study. 4
To monitor competition in small geographical areas, the Bank of Italy uses, as unit of analysis, 100 provinces for the deposit market and 20 regions for the loan market. This breakdown helps monitor competition even in the narrowest geographical markets.
5 Figure 1. Banking Sector Size and per capita GDP, end-2003 620,000 UK
Total Assets to GDP
520,000 France
420,000 Germany
320,000 Spain
220,000
Italy
120,000 13,000
18,000
USA
23,000
28,000
33,000
38,000
GDP per capita (at constant 2000 US$) Source: World Development Indicators (World Bank) : per capita GDP for 2003 (at constant 2000 US$).
Figure 2. Banking Sector: Total Loans and Stock Market Capitalization, end-2004
Stock Market Capitalization to GDP
15% U. K.
U. S. 10% Spain France 5%
Italy 0% 0%
50%
Germany
100%
150%
200%
Total Loans to GDP
250%
300%
350%
6 Table 1. Evolution in Average Scale of Italian Banks on Consolidated Basis 1/ (In millions of euros)
Average scale All institutions of which : Mutuals Average assets All institutions (net of mutuals) Number of banks All institutions of which : Mutuals All institutions (net of mutuals ) Total assets (end of period) All institutions of which : Mutuals All institutions (net of mutuals)
1995
1998
2001
2004
1.6 0.1 5.5
2.1 0.1 8.2
3.0 0.2 12.0
3.4 0.3 13.5
854 612 242
734 552 182
614 469 145
572 437 135
1,391 52 1,339
1,553 68 1,485
1,828 85 1,742
1,944 116 1,829
Source: Bank of Italy 1/ Excludes branches of foreign banks and banks in special administration or compulsory liquidation.
Table 2. Selected Countries: Market Concentration Indicators France 1998 2004 HHI 1/ % change
398.8
681.7 70.9
Germany 1998 2004 245.3
282.9 15.3
Spain 1998 2004 854.4 1188.1 39.1
Italy 1998 2004 488.7
542.2 11.0
CR3 2/ 0.25 0.36 0.17 0.19 0.46 0.51 0.30 0.34 CR5 3/ 0.36 0.51 0.27 0.27 0.57 0.59 0.42 0.46 CR10 4/ 0.59 0.75 0.46 0.46 0.74 0.71 0.64 0.63 Source: Bankscope. 1/ Herfinddahl-Hirschman Index by total assets. 2/ 3-firm concentration ratio is computed as the share of total assets of three largest banks. 3/ 5-firm concentration ratio is computed as the share of total assets of five largest banks. 4/ 10-firm concentration ratio is computed as the share of total assets of ten largest banks.
UK 1998
US 2004
1998
2004
339.5
493.3 45.3
116.7
157.0 34.6
0.21 0.31 0.54
0.26 0.41 0.65
0.11 0.16 0.28
0.12 0.19 0.34
7 Focarelli et al. (2002) find the performance of banks is affected by whether consolidation takes place through mergers or acquisitions. They provide some evidence that mergers tend to increase profitability, including through a more efficient use of capital. Acquisitions also tend to improve profitability, generally by raising the quality of the acquired bank’s loan portfolio. While this literature has helped shed light on the price impact of bank mergers, it does not aim at providing an assessment of bank consolidation on the degree of competition in the Italian banking system. C. Contestability and Costs Indicators Foreign ownership 8. Italy illustrates how fragmented─along national lines─the EU banking market still is. In line with some other large countries, the presence of foreign banks is concentrated primarily in investment banking and remains very limited in retail banking. So far, foreign take-overs have proven difficult to carry out, prompting scrutiny by the European competition and single market authorities. At end-2004, 7 percent of total bank assets were owned by foreigners, similar to the share in other large western European countries (Table 3), except that in Italy no major bank is majority foreign-owned.5 At end-2004, foreigners were majority owners in two medium-size banks (with total assets below € 20 billion) and 13 smaller banks (with total assets below € 7 billion), accounting in total for only 2.5 percent of total bank assets. Costs of banking services 9. The pricing data suggest relatively high costs of banking in Italy. According to one international survey, the average price of basic banking services (adjusted for local consumption patterns) appears to be among the highest in Europe (Table 4). This survey, however, does not provide a comprehensive cost estimate for basic banking services and should be interpreted with caution. Adjusting for joint-ownership of current accounts and the higher implied average balances, as well as the remuneration of accounts, another study found that the average price of holding a current account in Italy is still some 23 percent higher than the average for the EU countries surveyed.6 The high cost of services does not seem to be associated with delivery of high quality services: a survey on the quality of financial services in Europe─measured by consumers’ assessments of aspects such as the quality of information provided by banks, the ease of settling disputes with banks, the extent to which they trust banks’ advice, and use of internet for banking services─suggests
5
Partly, this is due to the high fragmentation in Italian banks’ ownership structure. In Italy, banks are controlled by shareholders’ agreements, rather than large majority shareholders. Indeed, at present no major Italian bank is majority owned by a single shareholder. 6
Mercer Oliver & Wyman (2004). The countries included in the survey were Belgium, France, Germany, Italy, the Netherlands, Spain, and the U.K.
8 dissatisfaction with the quality of services in Italy.7 These findings suggest a low level of competition in the services provided by Italian banks in the retail sector.
Table 3. Foreign-Ownership in Banking Sector Banks with some foreign-ownership 5/ 1999 2004 Italian banks Total number of banks 10 of which : mega 1/ 3 of which: large 2/ 1 of which: medium 3/ 2 Foreign-owned assets to total assets Individual data mega 1/ 14.9 large 2/ 1.2 medium 3/ 1.2 small 4/ 0.6 17.9 Total foreign-owned assets/total bank sector a Foreign branches Total number of foreign branches of which : mega 1/ of which: large 2/ of which: medium 3/ of which: small 4/ Assets owned by foreign branches/total bank sector assets
12 4 1 3
Banks with majority foreign-ownership 1999 2004 (number of banks)
Banks with minority foreign-ownership 6/ 1999 2004
13 15 2 2 (in percent of total assets)
25.0 1.8 2.0 0.5 29.2
0.0 2.0 0.0 0.6 2.6
0.0 0.0 1.8 0.7 2.5
57 57 4.0
60 3 57 4.5
3 -
5 -
0.0 0.0 0.0 0.2 0.2
0.0 0.0 0.0 0.5 0.5
Source: Bank of Italy. 1/ Bank with total assets above 45 EUR millions. 2/ Bank with total assets between 20 and 45 EUR millions 3/ Bank with total assets between 7 and 20 EUR millions 4/ Bank with total assets below 7 EUR millions. 5/ Includes banks for which shareholding is less than 15 per cent. 6/ Includes non controlled banks for which shareholding is greater than 15 per cent.
Table 4. Selected Countries: Cost of Banking Services
Annual Cost of Core Banking Services, in euro 1/
Italy
United States
Spain
113
93
81
France Germany 89
Source: CapGemini et al. World Retail Banking Report (2005). 1/ Price of banking services are adjusted for local consumption patterns.
7
European Commission (2004), Public Opinion in Europe: Financial Services Report B.
98
U.K. 65
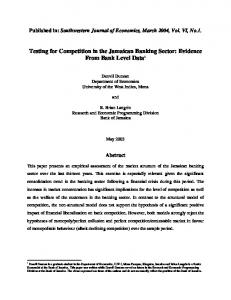
9 Switching costs 10. Switching costs can provide additional insight into the degree of banking competition. In this area, the Italian authorities are concerned that high switching costs hamper competition. The BI, jointly with the Competition Authority, has initiated an investigation regarding banking costs and depositors’ mobility in local markets. The BI surveyed a representative sample of 300 branches on the costs actually incurred by customers who closed their current accounts. Preliminary results suggest an average cost of closing a current account of €34, with wide variation among banks (from €0 to €100). This suggests that for some banks, high switching costs can hamper customers’ mobility or help keep customers captive, to the detriment of a more competitive environment. Cross-country comparisons on switching costs, however, are not available. 11. Persistently high operating profits, coupled with high revenues and/or high costs, are frequently associated with non competitive behavior. Relative to banks in other large industrial countries, Italian banks could fit this profile. For example, focusing on the top 50 banks, Italian banks enjoy relatively high operating income, surpassed only by US banks (Figure 4).8 However, because of high operating expenses, the net operating profit of Italian banks is only slightly higher than that of UK and Spanish banks (Figures 5 and 6). In this exercise we focus as much as possible our figures on the 50 largest banks in the countries under examination, as they are most likely to drive (or hamper) competition in their domestic markets. The overall trends, however, may be slightly different when looking at the entire banking sector.9 12. The profitability of banks in Italy underwent two very distinct phases in the 1980s and 1990s, which has been interpreted as evidence of intensified competition in the banking industry in recent years (Ciocca, 2005). •
In the 1980s, the industry was highly inefficient but profitable, suggesting low levels of competition. Despite rising labor costs (in real terms) and low (albeit rising) productivity (assets per employee), profit rates, remained high (double digit) until the end of the decade.
•
In the 1990s, the degree of inefficiency was greatly reduced, and productivity increased steadily and rapidly, by just under 4 percent annually. In the meantime, the
8
Ideally, we would also want to control for banks’ off-balance sheet activities, as an increasing volume of banks’ activities is no longer recorded on their balance sheets. One example is derivative transactions or securitizations, which are shifted to third parties in an effort to reduce banks’ on-balance sheet risks. Owing to data limitations, this is not possible. This shortcoming needs to be borne in mind when comparing standard cross-country indicators that are computed as a share of banks’ total assets. For example, the inability to account for off-balance sheet activities helps explain, at least in part, the relatively poor performance of US banks in some of the profitability indicators, which are measured against on-balance sheet assets, and omit US banks’ large off-balance sheet activities. 9
For example, at the aggregate level, 2005 ECB data suggests Italian banks to have a lower cost-to-income ratio than their French and German counterparts, whereas their ROA and ROE were both lower than UK banks.
10 Figure 3. Selected Countries: Concentration Indices, 1998 and 2004 Top 50 Banks: Herfindahl-Hirschman Index (By Total Assets)
1400 1200 1000 800 600 400 200 0
Germany
Spain
France
1998
Italy
U. K.
U. S.
2004
Share of Total Assets of Top 5 Banks
60
45
30
15
0 Germany
Source: Bankscope.
Spain
France
1998
Italy
U. K.
U. S.
2004
Figure 4. Selected Countries: Top 50 Banks, 2004 Operating Revenues (In percent of total assets) 4.5 4 3.5 3 2.5 2 1.5 1 0.5 0 Germany
Spain
Total Operating Income
France
Italy
Total Operating Expense
U. K.
U. S.
Net Operating Revenue
11
Figure 5. Top 50 Banks: Profitability Indicators, end-2004 Return on Average Assets
Return on Average Equity
1.2
15
1.0
12
0.8 9 0.6 6 0.4 3
0.2 0.0
Germany
Spain
France
Italy
U. K.
U. S.
0
Germany
France
Italy
U. K.
U. S.
Net Revenue
Cost-to-Income Ratio
80
Spain
(In percent of total assets)
2.5
2
60
1.5 40 1 20
0
0.5
0 Germany
Spain
France
Italy
U. K.
U. S.
Germany
Spain
France
Net interest revenue
Source: Bankscope.
Italy
U. K.
U. S.
Net operating revenue
12 Figure 6. Top 50 Banks: Indicators of Efficiency, 2004
40
30
20
10
0 DEU
ES
FRA
ITA
UK
Interest income to gross income
Operating expenses to gross income
Commission and fee income to gross income
Personnel expenses to gross income
US
Source: Bankscope.
growth of labor costs moderated sharply. However, the rate of profits declined steadily, to close to zero by the mid-1990s. Only later in the decade, driven by banks’ continued efficiency gains, did profit rates recover. 13. Return on equity components can help identify determinants of banks’ performance. To help shed light on how much of the change in profitability was due to improved efficiency, risk exposure, or other factors, it is possible to decompose the return on equity (ROE) for banks as follows (Table 5): Net profit Operating profit Gross income RWA Total assets Total own funds ROE = ──────────── X ──────────── X ──────── X ──────── X ───────── X ───────── Operating profit Gross income RWA Total assets Total own funds Equity
Gross income
Operating profit Administrative costs ──────────── = 1 - ──────────── = 1 – Efficiency ratio Gross income
13 Table 5. ROE Decomposition, 1994–2004 1/ Net profit/ Operating profit/ operating profit gross income (a)*(b)*(c)*(d)*(e)*100 (a) (b)=1-(f) ROE
Limited company banks 1/ Major Large Medium Small Cooperatives Mutuals All banks 3/
0.015 -0.497 -1.131 2.160 -0.038 4.264 9.559 1.121
0.001 -0.035 -0.079 0.140 -0.003 0.222 0.587 0.073
0.309 0.277 0.346 0.322 0.336 0.350 0.335 0.317
Limited company banks 1/ Major Large Medium Small Cooperatives Mutuals All banks 3/
9.057 12.327 11.367 6.906 3.490 6.633 5.830 8.488
0.431 0.549 0.439 0.382 0.192 0.356 0.509 0.425
0.405 0.434 0.410 0.376 0.368 0.377 0.309 0.396
Limited company banks 1/ Major Large Medium Small Cooperatives Mutuals All banks 3/ Source: Bank of Italy
9.909 9.499 13.122 11.462 8.432 7.480 7.505 9.414
0.555 0.563 0.562 0.563 0.528 0.564 0.625 0.560
0.403 0.401 0.460 0.408 0.375 0.374 0.331 0.395
Gross income/ Risk Weighted Assets (c) 1994 0.056 0.047 0.058 0.063 0.074 0.080 0.118 0.060 1999 0.056 0.048 0.063 0.059 0.071 0.060 0.075 0.057 2004 0.053 0.050 0.058 0.049 0.059 0.049 0.058 0.052
Risk Weighted Assets/ Total assets/ capital Efficiency ratio 2/ Total assets and reserves (f) (d) (e) 0.606 0.705 0.517 0.532 0.530 0.557 0.432 0.593
13.962 15.364 13.894 14.231 11.265 12.289 9.526 13.487
0.691 0.723 0.654 0.678 0.664 0.650 0.665 0.683
0.641 0.734 0.584 0.540 0.571 0.657 0.574 0.640
14.539 14.775 17.253 15.181 12.204 12.525 8.555 13.811
0.595 0.566 0.590 0.624 0.632 0.623 0.691 0.604
0.570 0.587 0.462 0.563 0.603 0.670 0.617 0.582
14.812 14.390 18.922 18.100 11.864 10.791 10.115 13.939
0.597 0.599 0.540 0.592 0.625 0.626 0.669 0.605
1/ "Major" banks are those with total balance-sheet items in excess of 45 billion euros, "large" banks are those with total balance-sheet items between 20 and 45 billion euros, "medium banks" are those with total balance-sheet items between 7 and 20 billion euros, "small" banks have total balance-sheet items amounting to less than 7 billion euros. 2/ The efficiency ratio is given by overall administrative costs divided by gross income. 3/ Not including branches of foreign banks. Data refer only to banks that have submitted income statement reports and provided information about the number of banking staff.
14. The steady improvements in efficiency in the second half of the 1990s suggest that improved competition was likely at play. Between 1994 and 2000, the efficiency ratio improved by some 12 percent. The ROE decomposition (Table 5) suggests that in the same period major and large banks had the ability to generate more value added per unit of assets adjusted for the risk assumed. All banks shifted toward more risky activities. 15. Over the last five years, however, banks’ efficiency gains stagnated, and, except for major banks, profitability continued to improve, suggesting that competitive pressures may have receded, at least in some segments of the banking sector. An important factor behind banks’ rising ROE was the improved quality of their loan portfolios, reflected in a higher net profit ratio. This reduction in NPLs, however, was largely driven by temporary tax incentives, and remained short-lived. In the case of major banks, despite
14 higher income ratios, profits declined as a result of higher administrative costs (efficiency losses). This suggests that lower competitive forces among major banks may have allowed these banks to generate higher income without creating corresponding efficiency gains. 16. However, simple comparisons of profitability, revenue, and cost indicators do not provide sufficient information to assess the operational effectiveness of Italian banks relative to other banks. For a fair comparison of banks’ effectiveness, size, regulatory environments, input costs, and business models need to be held constant. The next section complements the analysis above by controlling for the impact of such exogenous effects on various profitability indicators. A description of the data used for this analysis is provided in Box 1. Box 1. Data Sources The data used to compute the analysis come from Bankscope, a comprehensive database containing harmonized detailed balance sheets and income statements of individual banks across countries. This database allows a reasonably consistent crosscountry comparison of banking systems. To avoid double-counting of banks within the country selected, our data is based on consolidated statements, when available. The data set covers six large countries over a seven-year period from 1998 to 2004. In particular, it includes a total of over 3,500 large banks (i.e., banks with total assets greater than US$1 billion) in France, Germany, Italy, Spain, the United Kingdom, and the United States. Table 6 lists the number of banks represented each year for each selected country. Sample statistics are presented in Table 7, at the end of the paper. Table 6. Selected Countries: Banks Coverage, 1998–2004 France Germany Italy Spain United Kingdom United States Total banks
1998 691 103 251 200 218 909 2,372
1999 688 97 299 208 217 952 2,461
2000 687 99 298 206 218 928 2,436
2001 679 105 301 209 221 927 2,442
2002 680 108 295 216 229 899 2,427
2003 657 108 280 217 229 854 2,345
2004 456 100 217 160 183 700 1,816
D. Efficiency Estimates Cross-country profitability differences 17. We start by examining whether Italian banks earn profits that are statistically different from those of banks in other countries. As a first approximation, we concentrate on differences between countries rather than variations over time. We estimate a pooled
15 weighted least squares regression using the between-effect estimator, controlling for bank and country specific variables and including country dummies to capture cross-country differences.10 In particular, we run the following regression:
(
)
Dijt = µ t + β1 ( BkS ijt ) + β 2 ( HHI _ TA jt ) + β 3 Macro jt +
(
)
β 4 (FO jt ) + β 5 CD j + eit
(1)
where the subscripts represent, respectively, individual bank i, country j, and year t. The dependent variable (Dijt) represents profits, which are measured as the net interest margin (interest income minus interest expense over total assets)11 and as operating profits to total assets (operating income minus operating expenses). µ t represents the time fixed effects. The vector of bank-specific variables (BkSijt) is expressed as a share of total assets and includes: gross income, total equity, total loans, loan loss provisions, total banks deposits, customer deposits plus money market funds, and, in some regressions, operating expenses. To control for the level of asset concentration in the banking sector, we include the Herfindahl-Hirschman Index (HHI_TAjt), which is computed as the sum of the squares of the shares of total assets (expressed in percentage) held by each bank in the respective countries.12 Macrojt is a vector of macroeconomic variables and includes per capita GDP, inflation, Treasury-bill rates, and GDP growth. We also include a dummy equal to one if a bank is majority foreign-owned (FOijt) and zero otherwise and a vector of country dummies (CDj). The results are presented in Tables 8 and 9. 18. In this simple framework, our results suggest that the net interest margins operating profits of Italian banks do not appear to be, on average, statistically different from those of the other banks included in the sample. This is shown in Column 1, where the coefficient on the dummy variable for Italian banks (itad) is not statistically significant. However, the data suggest some interesting cross-country differences. In particular, we find 10
In a cross country time series analysis, the between-effect estimator is equivalent to taking the mean of each variable for each country across time and running the regression on the collapsed dataset of means. The regression specification should be considered as a reduced form to account for differences in the sample averages of bank and country specific factors, rather than a structural model of profitability. See Kerasulu (2005) for a similar application to Chilean banks (IMF Country Report No.05/316 ). 11
Determinants for interest margins are analyzed in Demirgüç-Kunt and Huizinga (1999). Girardone, Molyneux and Gardener (2004) examined the cost efficiency of Italian banks over the 1993-1996 period and found evidence of cost efficiency gains with significant differences between banks.
12
In particular, HHI =
∑ (s
⋅ 100) , where sij represents total assets of bank i in country j as a share of 2
ij
country j total bank assets. By construction, HHI has an upper value of 10,000 in the case of a monopolist bank with a 100 percent share of the market; the index tends to zero in the case of a large number of banks with very small market shares. In practice, markets in which the HHI is below 1,000 are considered as “loosely concentrated,” between 1,000 and 1,800 as “moderately concentrated,” and above 1,800 as “highly concentrated.”
16 that Italian banks exhibit significantly higher net interest margins than German banks (Column 3). Italian banks, however, do not seem to be able to maintain this advantage as they generate an overall lower level of operational profits than their German counterparts. Thus, while Italian banks make good returns on their lending business, they lag behind German banks in generating net revenues from non interest based activities. The picture is reversed in the case of Spanish banks, which earn higher net interest margins than Italian banks but lower overall operating profits (Column 5). Moreover, our results suggest that the average Italian bank earns a level of profits that is broadly in line with its French counterpart (Column 2). Effects of bank characteristics on revenue generation and cost control Next, we compare the ability of Italian banks to control costs and generate 19. revenues relative to banks in other large countries. In this framework, we allow variables to change across banks and across time, while controlling for bank characteristics13:
X it = µ i + µ t + β 1 ln TA + β 2 (ln TA) 2 + β 3 ( II / TA) + β 4 ( NCFTR TA)
+ β 5 ( PE TA) + β 6 (TL TA) + β 7 (LLP TA) + β 8 (TCD TA) + β 9 (TEQ TA) +
( )
(2)
β 10 (FO ) + β 11 (HHI _ TA) + β 12 CDi + eit where the dependent variable Xit is, respectively, operating expenses to total assets (OpE/TA), operating income to total assets (OpI/TA), and net operating profits to total assets (Opp/TA). µ i captures the individual fixed effects, while µ t represents the time fixed effects. Explanatory variables include interest income to operating income (II/TA), net commission and fee income to total assets (NCR/TA), personnel expense to total assets (PE/TA), total loans to total assets (TLN/TA), total customer deposits to total assets (TCD/TA), and total equity to total assets (TEQ/TA). We also include a dummy equal to one if the bank is majority foreign-owned and zero otherwise (FO), the country-specific HHI (as a share of total assets) as a concentration proxy, and a vector of country dummy variables (CD). The results are presented in Tables 10, 11, and 12. To account for the identified heteroscedastic error structure and a first-order 20. autocorrelation process, we fit our panel data using a generalized least squares (FGLS) regression. Our data failed to reject the null hypothesis of no first-order autocorrelation based on the Wooldridge panel test. After finding that a random effects model was not an appropriate model structure for our data (based on both the Breusch and Pagan Lagrangian multiplier test for random effects and the Hausman specification test), we switched to a panel FGLS model. This model structure allows us to control for cross-country differences, something that would not have been possible under a simple fixed effects model, while correcting for first-order autocorrelation and testing for the presence of heteroscedasticity. Iterated GLS produce maximum likelihood estimates, which make it possible to use a 13
Brunner et al. (2004) implement a similar approach to examine the relative profitability of German banks relative to French, Italian, UK, and Spanish banks for the 1997-2001 period.
17 likelihood ratio test to test the null hypothesis of a homoscedastic error structure. Our results supported the presence of heteroskedasticity, a result that was confirmed by the modified Wald test for groupwise heteroskedasticity conducted in our fixed effect regression models. Our results suggest that Italian banks incur significantly higher expenditures 21. than other European banks and generate lower revenues than other banks, except for French banks, which earn even lower revenues than Italian and German banks. When we allow for variables to change across banks and across time, and after controlling for characteristics that affect banks’ ability to generate revenue and control costs, Italian banks have a statistically higher level of operating expenses to total assets and lower operating income to total assets than the other banks included in the sample (Column 3). Columns 4 to 6 compare the costs and revenues of Italian banks to, respectively, those of German, French, and US banks. Overall, the combination of higher expenses and lower revenues translates into lower net operating profits for Italian banks, after controlling for banks’ characteristics. This situation could indicate a low-competition environment, where banks are not pressured to reduce their costs to compensate for low income margins. In Italy, foreign banks are relatively more profitable that domestic banks owing 22. to their ability to better manage their cost structure (Column 1). This contrast with foreign banks in Germany and France, where foreign banks’ higher income capacity is fully offset by their higher operating expenditures (Column 4 and 5). These differences can be indicative of lower competition in Italy than in other markets. Moreover, while the degree of banks’ asset concentration in the sector, as measured by HHI, appears to be statistically significant, its impact is negligible for the countries under study. Productive efficiency It may not be sufficient to control for a bank’s profile (i.e., in terms of balance 23. sheet structure and profit and loss accounts) to assess its productive efficiency. For example, a bank may have relatively higher personnel costs than other banks and yet be more efficient, if these costs help provide high-value-added services that require a highly qualified staff. Alternatively, a bank’s profitability may be lower because it faces less pressure to use its inputs efficiently. Thus, it is important to control for endogenous factors that affect banks’ ability or motivation to generate higher revenues and/or manage costs more effectively. A stochastic “best practices” frontier approach is a useful tool to assess banks’ 24. efficiency. This approach estimates indirect levels of revenues and costs for a given level of output and for given input prices, while allowing a number of other factors to affect total factor productivity.14 One must specify a functional form for the efficiency frontier. A
14
The underlying assumption of this approach is that banks in the sample face a common technology (in terms of factor productivity) and the same degree of competition. Clearly, this is an imperfect assumption, as the capital-labor mix may depend on a wide range of local conditions, such as regulations, taxation, business model, financial market development, etc. Nevertheless, this approach has been used in a number of similar crosscountry analyses (Bonaccorsi di Patti and Hardy, 2005; Brunner et al., 2004; and Decressin, 2005).
18 common approach in the literature, and the one adopted here, is to use the translog specification: 4
2
j =1
j =1
3
X it = µ i + µ t + ∑ φ j Z ijt + ∑ α j log y ijt + ∑ β j log pijt 2
2
j =1
3
3
2 3 1 1 + ∑ ∑η jk log y ijt log y ikt + ∑ ∑ φ jk log pijt log pikt + ∑∑ ρ jk log y ijt log pikt + eit 2 j =1 k =1 2 j =1 k =1 j =1 k =1
(3)
where Xit is either revenues (operating income to total assets) or costs (operating expenses to total assets) for bank i in year t; the individual fixed effects ( µ i ) capture relative measures of management effectiveness across banks groups, while the time fixed effects ( µ t ) represent technological progress and aggregate shock. Zit is a vector of exogenous variables (total customer deposits to total liabilities, total bank deposits to total assets, loan loss provisions to total assets, equity to total assets, total assets to number of employees, a dummy equal to one for majority foreign-owned banks, and the country-specific HHI) that affects efficiency but not the estimate frontier. These variables are intended to proxy for bank differences in the business model and in the regulatory environment. yijt and yikt are bank output as a share of total assets (loan and other earning assets); and pijt and pikt are a bank input price as a share of total funding (personnel expense, interest expense, and total operating expense net of personnel expense); eit is an error term. The results are presented in Tables 13 and 14. For clarity, we do not provide the full set of results and focus on country-specific effects captured by the country dummies. According to our estimates, Italian banks are less effective than the other banks 25. included in our sample in managing costs and generating higher revenues (Column 1 of Tables 13 and 14). This results holds over a broad range of specifications. Again, our results suggest some cross-country differences. For example, the performance of Italian banks in terms of managing costs and earning income is broadly in line with that of German banks (Column 2 in Tables 13 and 14), but lags behind that of French and US banks (Columns 3 and 4 in Tables 13 and 14). These results are consistent with our earlier findings. Our empirical estimates suggest that overall Italian banks are less efficient than 26. the other banks included in our sample. While they appear to earn broadly similar (or lower) income than their French and German counterparts, their inability to achieve a comparable cost structure results in an overall lower profit performance. Next, we explore the extent to which this lower efficiency can be related to lower competition in the Italian banking sector. E. Market Power Lerner index One approach to assess the degree of competition is to examine the differential 27. between the prices that banks charge for their services and the marginal costs they
19 incur to provide these services. 15 This measure is referred to as the Lerner Index. A high margin would suggest a high level of market power and hence, a lower degree of competition in the banking sector. Recent studies based on this approach suggest a degree of deviation from pure competition for the banking market in Italy similar to that for the euro area. Angelini and Cetorelli (2003) calculate the Lerner index for the Italian banking 28. industry from 1984 to 1997. They find that starting in 1993, the index shows a significant decline in market power in Italy. Among the main difficulties inherent in the study, though, is the fact that changes in profit margins reflect not only the degree of competition in the market, but general economic conditions. For instance, the profit margin decline starting in 1993 was also associated with the increase in loan riskiness following the recession that year. Cetorelli and Violi (2003) estimate Lerner Indices for Italy, Germany, France 29. and the euro area, annually, for the period 1995–2000. They find that the Lerner index for Italy was not statistically different from the estimate for the euro area in 1995, but that since then deviations of prices from marginal costs increased more rapidly in Italy than in the euro area. By 2000, the Lerner index in Italy was about one-third higher than for the euro area. This recent trend, which reflects more than proportional cost reductions in Italy, could be associated with a fall in the price elasticity of the demand for financial products, as banking services, and particularly fee-based services, increased. However, combined with our earlier finding of Italian banks’ relatively high costs, it could also suggest the tapering-off of competitive pressures in the domestic banking sector. Panzar-rosse index Market power can also be measured by the extent to which changes in factor 30. prices are reflected in revenues (Panzar and Rosse,1987; hereafter, P-R). With perfect competition, an increase in factor prices (say, deposit interest rates) induces no change in output (assets) but a proportional change in output prices (i.e., under a perfectly elastic demand assumption). Instead, with monopolistic competition, or with potential entry leading to contestable markets, revenues would increase less than proportionally, as the demand for banking products facing individual banks is less than perfectly elastic. A number of studies in recent years have extended the P-R methodology to 31. banking. Based on a reduced-form equation of revenue at the individual bank level, market power is inferred from the H-statistic, which measures the extent to which changes in factor prices are reflected in banks’ revenue. If the market is perfectly competitive an increase in factor prices would raise revenues equiproportionally and the H-statistic should assume a value equal to 1. On the other hand, in the “intermediate” case of monopolistic competition, the H-statistic assumes a value between 0 and 1, with an increase in input prices leading to a
15
Prices measured as the sum of total interest income and income from services, in proportion to total assets.
20 less than proportional increase in revenues, as the demand for bank products facing individual banks is inelastic (Box 2).16 Box 2. Interpretation of H-statistic
The H-statistic is computed as follows: J
H = ∑α j j =1
Where H ≤0
0 < H chi2 0.00 0.00 0.00 0.00 Absolute value of z statistics in parentheses: + significant at 10%; * significant at Source: Bankscope.
France opi_ta (5) 0.152** (4.20) -0.006** (2.77) 0.218** (56.13) 0.685** (79.04) 1.241** (90.25) 0.005** (16.33) 0.207** (24.33) 0.003** (10.61) 0.087** (38.23) 0.015* (2.27) -0.000** (10.71) 0.128** -5.48 0.792** -21.14 -0.049 -1.21 0.252** -11.42
US opi_ta (6) 0.152** (4.20) -0.006** (2.77) 0.218** (56.13) 0.685** (79.04) 1.241** (90.25) 0.005** (16.33) 0.207** (24.33) 0.003** (10.61) 0.087** (38.23) 0.015* (2.27) -0.000** (10.71) -0.934** -33.5 -0.270** -5.81 -1.110** -28.05 -0.809** -41.1 -1.062** -38.78
1.062** -38.78 -2.043** -0.981** -12.16 -5.9 10948 10948 1981 1981 7 7 2 2 5.53 5.53 0.68 0.68 -2414.8 -2414.8 65979.35 65979.35 0.00 0.00 5%; ** significant at 1%
33 Table 11. Cross-Sectional Time-Series FGLS Regression Allowing for Heteroskedastic Panels and Common AR(1) Coefficient for All Panels (Dependent variable: operational expenses to total assets) Sample
logta logta_sq ii_ta ncftr_ta pe_ta tln_ta llp_ta tcd_ta teq_ta fo hhi_ta
Italy ope_ta (1) -0.033 (0.52) -0.001 (0.27) 0.115** (11.30) 0.200** (11.99) 1.210** (41.82) -0.004** (5.90) 1.023** (38.54) 0.002** (2.67) -0.001 (0.44) -0.063+ (1.87) -0.001** (5.30)
Non-Italy ope_ta (2) 0.064** (3.84) -0.002** (2.73) 0.013** (8.64) 0.058** (11.94) 1.635** (210.55) -0.002** (14.72) 1.008** (230.34) 0 (0.70) 0.037** (30.46) 0.004 (1.23) -0.000** (16.35)
italy dummy
All ope_ta (3) 0.046** (3.02) -0.001+ (1.72) 0.047** (24.87) 0.058** (11.05) 1.603** (212.87) -0.002** (9.65) 1.000** (225.82) -0.000* (2.56) 0.034** (29.84) 0.006 (1.63) -0.000** (19.01) 0.053** (3.70)
spain dummy uk dummy
Germany ope_ta (4) 0.057** (3.44) -0.002** (2.82) 0.045** (21.52) 0.075** (12.27) 1.601** (193.33) -0.002** (8.59) 1.006** (220.48) -0.001** (7.59) 0.021** (14.57) 0.008* (2.14) -0.000** (2.87) 0.053** (3.45) -0.017 (0.85) 0.036* (2.05)
germany dummy france dummy usa dummy Constant
Number of observations Number of groups Largest groups size Smallest group size Average group size rho Log likelihood Wald chi2 Prob > chi2 Absolute value of z statistics in Source: Bankscope.
1.064** (3.27)
-0.317** (3.84)
-0.365** (4.99)
-0.094** (8.70) 0.221** (20.44) -0.330** (4.09)
France ope_ta (5) 0.057** (3.44) -0.002** (2.82) 0.045** (21.52) 0.075** (12.27) 1.601** (193.33) -0.002** (8.59) 1.006** (220.48) -0.001** (7.59) 0.021** (14.57) 0.008* (2.14) -0.000** (2.87) 0.147** (9.82) 0.076** (4.21) 0.130** (7.09) 0.094** (8.70)
0.314** (22.30) -0.424** (5.09)
US ope_ta (6) 0.057** (3.44) -0.002** (2.82) 0.045** (21.52) 0.075** (12.27) 1.601** (193.33) -0.002** (8.59) 1.006** (220.48) -0.001** (7.59) 0.021** (14.57) 0.008* (2.14) -0.000** (2.87) -0.168** (9.56) -0.238** (10.13) -0.185** (9.69) -0.221** (20.44) -0.314** (22.30)
-0.109 (1.32)
1238 9713 10951 10951 10951 10951 235 1747 1982 1982 1982 1982 7 7 7 7 7 7 2 2 2 2 2 2 5.27 5.56 5.53 5.53 5.53 5.53 -0.11 0.69 0.65 0.65 0.65 0.65 -577.8 3543.95 3082.76 3132.79 3132.79 3132.79 13626.34 277586.25 222955.32 172339.23 172339.23 172339.23 0.00 0.00 0.00 0.00 0.00 0.00 parentheses: + significant at 10%; * significant at 5%; ** significant at 1%
34 Table 12. Cross-Sectional Time-Series FGLS regression Allowing for Heteroskedastic Panels and Common AR(1) Coefficient for All Panels (Dependent variable: operational profits to total assets) Sample
logta logta_sq ii_ta ncftr_ta pe_ta tln_ta llp_ta tcd_ta teq_ta fo hhi_ta
Italy opp_ta (1) -0.245* (2.40) 0.015** (2.66) 0.156** (16.38) 0.686** (31.52) -0.371** (10.62) 0.012** (12.58) -0.896** (30.42) 0.008** (7.27) 0.045** (11.16) 0.055* (2.11) 0 (0.05)
Non-Italy opp_ta (2) 0.110** (3.51) -0.003 (1.55) 0.144** (35.27) 0.443** (42.44) -0.169** (12.96) 0.006** (19.88) -0.753** (84.73) 0.007** (25.78) 0.099** (52.80) -0.003 (0.49) -0.000** (19.51)
italy dummy
All opp_ta (3) 0.143** (4.78) -0.004* (2.35) 0.161** (44.08) 0.502** (54.63) -0.224** (18.51) 0.008** (26.60) -0.754** (89.14) 0.008** (29.32) 0.091** (53.63) -0.023** (3.84) -0.001** (29.73) -0.314** (17.53)
spain dummy uk dummy
Germany opp_ta (4) 0.066* (2.28) -0.001 (0.85) 0.141** (39.41) 0.529** (54.95) -0.225** (19.72) 0.007** (24.98) -0.748** (85.72) 0.004** (15.39) 0.065** (37.15) 0.009 (1.45) -0.000** (7.73) -0.249** (12.03) 0.453** (12.82) -0.352** (14.80)
germany dummy france dummy usa dummy Constant
Number of observations Number of groups Largest groups size Smallest group size Average group size rho Log likelihood Wald chi2 Prob > chi2 Absolute value of z statistics in Source: Bankscope.
-0.505 (1.04)
-1.772** (11.99)
-2.107** (15.02)
-0.168** (10.05) 0.570** (33.91) -1.297** (9.63)
France opp_ta (5) 0.066* (2.28) -0.001 (0.85) 0.141** (39.41) 0.529** (54.95) -0.225** (19.72) 0.007** (24.98) -0.748** (85.72) 0.004** (15.39) 0.065** (37.15) 0.009 (1.45) -0.000** (7.73) -0.081** (4.32) 0.620** (20.17) -0.184** (7.27) 0.168** (10.05)
0.737** (33.37) -1.465** (10.52)
US opp_ta (6) 0.066* (2.28) -0.001 (0.85) 0.141** (39.41) 0.529** (54.95) -0.225** (19.72) 0.007** (24.98) -0.748** (85.72) 0.004** (15.39) 0.065** (37.15) 0.009 (1.45) -0.000** (7.73) -0.818** (32.92) -0.117** (2.90) -0.921** (34.33) -0.570** (33.91) -0.737** (33.37)
-0.727** (5.28)
1235 9713 10948 10948 10948 10948 234 1747 1981 1981 1981 1981 7 7 7 7 7 7 2 2 2 2 2 2 5.28 5.56 5.53 5.53 5.53 5.53 0.48 0.64 0.63 0.6 0.6 0.6 -499.32 -2183.56 -2846.81 -2292.52 -2292.52 -2292.52 2401.13 16861.2 19390.6 22266.9 22266.92 22266.92 0.00 0.00 0.00 0.00 0.00 0.00 parentheses: + significant at 10%; * significant at 5%; ** significant at 1%
35 Table 13. Cross-Sectional Time-Series FGLS Regression Allowing for Heteroskedastic Panels and Common AR(1) Coefficient for All Panels (Dependent variable: operational expenses to total assets) Sample
tcd_tl tbd_ta llp_ta teq_ta ta_ne hhi_ta fo italy dummy
All opi_ta (1) 0.004** -14.38 0.001** -3.99 0.156** -16.65 0.040** (17.22) 0.00 (0.32) 0.00 (0.04) -0.015+ (1.92) -0.140** (6.40)
spain dummy france dummy uk dummy usa dummy
Germany opi_ta (2) 0.005** -14.52 0.001** -4.25 0.161** -17.9 0.038** (15.50) 0.00 (0.45) -0.000** (9.06) -0.013+ (1.93) 0.01 (0.40) 0.530** (11.64) 0.118** (5.95) 0.247** (8.18) 0.658** (18.80)
germany dummy Constant
2.308 -1.2
1.42 (0.72)
France opi_ta (3) 0.005** -14.52 0.001** -4.25 0.161** -17.9 0.038** (15.50) 0.00 (0.45) -0.000** (9.06) -0.013+ (1.93) -0.108** (4.49) 0.412** (10.09)
0.128** (3.92) 0.540** (13.65) -0.118** (5.95) 1.53 (0.78)
US opi_ta (4) 0.005** -14.52 0.001** -4.25 0.161** -17.9 0.038** (15.50) 0.00 (0.45) -0.000** (9.06) -0.013+ (1.93) -0.648** (15.58) -0.128* (2.15) -0.540** (13.65) -0.412** (9.22)
-0.658** (18.80) 2.07 (1.06)
Number of observations 6889 6889 6889 6889 Number of groups 1363 1363 1363.00 1363.00 Largest groups size 7 7 7 7 Smallest group size 2.00 2.00 2.00 2.00 Average group size 5.05 5.05 5.05 5.05 rho 0.59 0.64 0.64 0.64 Log likelihood -1375.53 -1105.38 -1105.38 -1105.38 Wald chi2 57385.56 55427.19 55427.19 55427.19 Prob > chi2 0.00 0.00 0.00 0.00 Absolute value of z statistics in parentheses: + significant at 10%; * significant at 5%; ** sig Source: Bankscope.
36 Table 14. Cross-Sectional Time-Series FGLS Regression Allowing for Heteroskedastic Panels and Common AR(1) Coefficient for All Panels (Dependent variable: operational expenses to total assets) Sample
All ope_ta (1) 0.003** (15.78) 0.003** (12.36) 0.996** (557.22) -0.029** (29.96) 0.000** (6.02) 0 (0.78) -0.003* (2.39) 0.063** (3.65)
tcd_tl tbd_ta llp_ta teq_ta ta_ne hhi_ta fo italy dummy spain dummy france dummy uk dummy usa dummy
Germany ope_ta (2) 0.002** (17.17) 0.002** (10.35) 0.998** (436.63) -0.027** (41.21) 0 (0.85) -0.000* (2.07) -0.005* (2.09) 0.01 (1.31) -0.003 (0.23) -0.015** (3.05) 0.018* (2.35) 0.056** (4.90)
germany dummy Constant
3.204** -5.44
Number of observations Number of groups Largest groups size Smallest group size Average group size rho Log likelihood Wald chi2 Prob > chi2 Absolute value of z statistics in
5.067** -9.54
France ope_ta (3) 0.002** (17.17) 0.002** (10.35) 0.998** (436.63) -0.027** (41.21) 0 (0.85) -0.000* (2.07) -0.005* (2.09) 0.025** (3.90) 0.013 (1.26)
US ope_ta (4) 0.002** (17.17) 0.002** (10.35) 0.998** (436.63) -0.027** (41.21) 0 (0.85) -0.000* (2.07) -0.005* (2.09) -0.046** (3.57) -0.059** (3.45) -0.071** (5.81) -0.038** (2.81)
0.033** (4.01) 0.071** (5.81) 0.015** -3.05 5.052** -9.5
-0.056** -4.9 5.123** -9.65
6889 6889 6889 1363 1363 1363 7 7 7 2 2 2 5.05 5.05 5.05 0.94 0.45 0.45 8887.97 7508.42 7508.42 499098.41 675260.15 675260.15 0.00 0.00 0.00 parentheses: + significant at 10%; * significant at 5%;
6889 1363 7 2 5.05 0.45 7508.42 675260.15 0.00 ** significant a
Source: Bankscope.
Table 15. Selected Countries: Panzar-Rosse H-Statistics, 1998–2004 FGLS Regressions with Heteroskedastic Panels and Common AR(1) Coefficient Specification H-statistic (1)
Italy
Spain Germany
UK
France
US
Max
Min.
H-statistic Ranking
0.71 4
0.77 2
0.69 5
0.80 1
0.74 0.56 3 6
0.80
0.56
H-statistic Ranking Source: Bankscope.
0.73 4
0.81 2
0.85 1
0.70 5
0.76 0.60 3 6
0.85
0.60
(2)
37 References Competition and stability
Allen, Franklin and Douglas Gale, 2004, “Competition and Financial Stability,” Journal of Money, Credit, and Banking, 36(3), Part 2. Allen, Franklin and Douglas Gale, 2000, “Financial Contagion“, Journal of Political Economy, 108(1):1–29. Barros, Pedro Pita and Steffen Hoernig, 2004, “Sectoral Regulators and the Competition Authority: Which Relationship is Best?,” Center for Economic Policy Research Discussion Papper Series, No. 4541, August. Beck, Thorsten, Asli Demirguc-Kunt, and Ross Levine, 2002, “Bank Concentration and Crises”, NBER Working Paper Series, No. 9921, November. Berger, Allen N. et al., 2004, “Bank Concentration and Competition: An Evolution in the Making“, Journal of Money, Credit, and Banking, 36(3), Part 2. Boyd, John and Stanley L. Graham, 1996, “Consolidation in U.S. Banking: Implications for Efficiency and Risk”, Federal Reserve Bank of Minneapolis Working Paper Series, No. 572, December. Boyd, John H. and Gianni de Nicoló (2005) “The Theory of Bank Risk Taking and Competition Revisited“, Journal of Finance, 60(3): 1329–43, June. Boyd, John and David Runkle, 1993, “Size and performance of banking firms: testing the predictions of theory”, Journal of Monetary Economics, 31:47–67, February. Carletti, Elena, Philipp Hartmann and Giancarlo Spagnolo, 2004, “Bank mergers, competition and liquidity”, Center for Economic Policy Research Discussion Paper Series, No. 4260, February. Carletti, Elena and Philipp Hartmann, 2002, “Competition and Stability: What’s Special about Banking?”, European central bank Working Paper Series, No. 146, May 2002. Caminal, Ramon and Carmen Matutes, 2002, Market Power and Banking failures, International Journal of Industrial Organization, 20(9):1341–61, November. Canoy, Marcel, M. van Dijk, J. Lemmen, R. de Mooij and J. Weigand, 2001, “Competition and Stability in Banking”, CBP Document, No. 15, Netherlands Bureau for Economic Policy Analysis, December. Cordella, Tito and E.L. Yeyati, 2002, “Financial Opening, Deposit Insurance and Risk in a Model of Banking Competition”, European Economic Review, 46(3):471–85.
38 Craig and Santos, 1997, The Risk Effects of Bank Acquisitions, Federal Reserve Bank of Cleveland, Economic Review, 33(2): 25–35. De Nicoló, Gianni 2000, “Size, Charter Value and Risk in Banking: an International Perspective,” Board of Governors of the Federal Reserve System, International Finance Discussion Papers, No. 2000–689, December. De Nicoló, Gianni and M. Kwast, 2001, “Systemic Risk and Financial Consolidation: Are they Related?”, Board of Governors of the Federal Reserve System, International Finance Discussion Papers, No. 2001–33, August. Edwards, F. and F. Mishkin, 1995, “The Decline of Traditional Banking: Implications for Financial Stability and Regulatory Policy”, National Bureau of Economic Research Working Paper Series, No. 4993:1–31, January. FDIC, 2003, Resolutions Handbook, available at http://www.fdic.gov/bank/historical/reshandbook/ Group of Ten, 2001, Report on Consolidation in the Financial Sector, Bank for International Settlement, Basel: Switzerland. Hellman, Thomas, Kevin Murdoch, and Joseph Stiglitz, 2000, “Liberalization, Moral Hazard in Banking, and Prudential Regulation: Are Capital Requirements Enough?”, American Economic Review, 90(1):147–65, March. Keeley, Michael C., 1990, “Deposit Insurance, Risk and Market Power in Banking,” American Economic Review, 80(5):1183–200, December. Matutes C. and Xavier Vives, 1996, “Competition for Deposits, Fragility, and Insurance”, Journal of Financial Intermediation, 5(2):184–216. Nagarajan, S. and C.W. Sealey, “Forbearance, deposit insurance pricing, and incentive compatible bank regulation”, Journal of Banking and Finance, 19(6):1109–30. Northcott, Carol Ann, 2004, “Competition in Banking”. A Review of the Literature”, Bank of Canada, Working Paper 2004–24, June. OECD, 2001, “Regulatory Reform in Italy,” OECD Reviews of Regulatory Reforms, Paris: OECD. OECD, 2000, “Mergers in Financial Services,” Directorate for Financial, Fiscal, And Enterprise Affairs, Committee on Competition Law and Policy, DAFFE/CLP(2000)17. OECD, 1996, “Failing Firm Defense”, OECD/GD(96)/23. Perotti, E.C. and J. Suarez, 2002, “Last Bank Standing: What do I gain if you Fail?” European Economic Review, 46(9):1599–622.
39 Repullo, Rafael, 2003, “Capital requirements, market power and risk-taking in banking”, Center for Economic Policy Research, Discussion Paper Series, No. 3721:1–33, January. Shaffer, Sherrill, 1998, “The Winner’s Curse in Banking”, Journal of Financial Intermediation, 7(4):359–92. Siragusa, Mario and Matteo Beretta, 2005, Merger Control in Italy, in Maher Dabbah and Paul Lasok QC (eds.), Merger Control Worldwide, Vol.2, Cambridge University Press. Trifilidis, Maurizio, 2001, “Il ruolo di tutela della concorrenza della Banca d’Italia nel periodo 1990–2000”, Banche e Banchieri, 28(1), February. Vives, Xavier, 2001, “Restructuring Financial Regulation in the European Monetary Union”, Journal of Financial Services Research, 19(1):57–82. Walter, John, R., 2004, “Closing Troubled Banks: How the Process Works”, Federal Reserve Bank of Richmond, Economic Quarterly, 90(1):51–68. Efficiency and profitability
Bonaccorsi di Patti, Emilia and Daniel C. Hardy, 2005, “Financial sector liberalization, bank privatization, and efficiency: Evidence from Pakistan”, Journal of Banking & Finance, 29(8– 9): 2381–406, August–September Brunner, Allan, Jörg Decressin, Daniel Hardy, and Beata Kudela, 2004, “Germany’s ThreePillar Banking System: Cross Country Perspective in Europe”, International Monetary Fund Occasional Paper, No. 233, Washington, DC: International Monetary Fund. Demirgüç-Kunt, Asli and Harry Huizinga, 1999, “Determinants of Commercial Bank Interest Margins and Profitability: Some International Evidence”, The World Bank Economic Review, 13(2):379–408. European Commission, 2004, “Public Opinion in Europe: Financial Services Report B”. Girardone, Claudia, Philip Molyneux and Edward P.M. Gardener, 2004, “Analyzing the determinants of bank efficiency: the case of Italian banks”, Applied Economics, 36:215–27. Concentration and competition
Angelini, Paolo and N. Cetorelli, 2003, “The effects of regulatory reform on competition in the banking industry”, Journal of Money, Credit, and Banking, 35(5):603–84.
40 Belaisch, Agnes, 2003, “Do Brazilian Banks Compete?”, International Monetary Fund, Working Paper, WP 03 ⁄113 . Berger, Allen N. et al., 2004, “Bank Concentration and Competition: An Evolution in the Making“, Journal of Money, Credit, and Banking, 36(3), Part 2. Bikker, Jacob A., 2004, “Competition and efficiency in a unified European banking market”, Cheltenham, U.K. Bikker, Jacob A. and Katharina Haaf, 2002, Competition, concentration and their Relationship: An Empirical Analysis of the banking Industry”, Journal of Banking and Finance, 26:2191–214. Bikker, Jacob A. and J.M. Groeneveld, 2000, Competition and Concentration in the EU Banking Industry, Kredit und Kapital, 33:62–98 Cetorelli, Nicola and Roberto Violi, 2003, “Forme di mercato e grado di concorrenza nell’industria bancaria dell’area dell’euro”, Quaderni di Ricerche, 35. Cetorelli, Nicola, 1999, “Competitive Analysis in Banking: Appraisal of the Methodologies”, Economic Perspective, Federal Reserve Bank of Chicago, 2–15. Ciocca, Pierluigi, 2005, “The Italian Financial System Remodelled”, Palgrave, Macmillan. Claessens, Stijn and Luc Laeven, 2004, “What Drives Bank Competition: Some International Evidence”, Journal of Money, Credit, and Banking, 36(3), Part 2. Courvoisier, Sandrine and Reint Gropp, 2001, “Bank Concentration and Retail Interest Rates”, ECB Working Paper Series, WP No. 72, July. De Bandt, Olivier and Philip E. Davis, 2002, “Competition, Contestability and Market Structure in European Banking Sectors on the Eve of EMU,” Journal of Banking and Finance, 24(6):1045–66, June. Decressin, Jorg, 2005, “Banks and Markets in Europe and the United States” in Euro Area Policies: Selected Issues, IMF Country Report No. 05 ⁄266 ; August. Degryse, Hans and Steven Ongena, 2004, “The Impact of Technology and Regulation on the Geographical Scope of Banking”, Oxford Review of Economic Policy, 20(4):571–90. Focarelli, Dario, Fabio Panetta, Carmelo Salleo, 2002, “Why do Banks Merge?”, Journal of Money, Credit, and Banking, 34(4):1047–66, November. Gelos, G. R. and J. Roldos, 2002, “Consolidation and Market Structure in Emerging Market Banking Systems”, International Monetary Fund, Working Paper, WP 02 ⁄186 .
41 Group of Ten, 2001, Report on Consolidation in the Financial Sector, Bank for International Settlements, Basel: Switzerland. Hempell H. S, 2002, “Testing for Competition among German Banks”, Deutsche Bundesbank, 04 ⁄02 , Frankfurt. Hondroyannis G., Lolos S. et Papapetrou E, 1999, “Assessing Competitive Conditions in the Greek Banking System”, Journal of International Financial Markets, Institutions and Money 9:377–91. Karasulu, Meral, 2005, “Competition in the Chilean Banking Sector: A Cross Country Comparison”, in IMF Country Report No. 05 ⁄316 , September. Molyneux, P. Lloyd-Williams, D.M., Thornton J., 1994, “Competitive conditions in European Banking”, Journal of Banking and Finance, 18(3):445–59, May. Morgan Stanley and Mercer Oliver Wyman, 2005, “European Banking Consolidation: IT Synergies and Basel II Will Drive Cross-Border Restructuring,” Equity Research, Europe, European Banks, February. Panetta, F., Fabiano Schivardi, Matthew Shum, 2005, “Do Mergers Improve Information? Evidence From the Loan Market”, Discussion Paper Series No. 4961, Center for Economic Policy Research, May. Sapienza, Paola, 2002, “The Effects of Banking Mergers on Loan Contracts”, The Journal of Finance, LVII, No. 1, 329–67, February. Real effects of competition
Berger, Allen N., Richard J. Rosen, Gregory F. Udell, 2005, ”Does Market Size Structure Affect Competition? The Case of Small Business Lending”, mimeo. Bonaccorsi di Patti, Emilia and Giorgio Boggi, 2001, “The Effects of Bank Consolidation and Market Entry on Small Business Lending”, Banca D’Italia Temi di Discussione, Number 404, June. Focarelli, Dario, Fabio Panetta, 2003, “Are Mergers Beneficial for Consumers? Evidence from the Market for Bank Deposits”, American Economic Review, 93(4):1154–72, September. Cetorelli, Nicola, 2004, “Real Effects of Bank Competition”, Journal of Money, Credit, and Banking, 36(3): 543–58, Part 2. Pricing
42 Capgemini, European Financial Management & Marketing Association, and ING Group, 2005, World Retail Banking Report, available at http://www.us.capgemini.com/DownloadLibrary/requestfile.asp?ID=460 Mercer Oliver Wyman, 2005, “Indagine sul pricing dei Servizi Bancari in Europa,” report prepared for the Italian Banking Association, available at http://www.abi.it/. Institutional structure of competition policy
Di Giorgio, Giorgio and Carmine Di Noia, 2002, “Financial Regulation and Supervision in the Euro Area: A Four-Peak Proposal”, Wharton Financial Institutions Center Working Paper Series, 01 ⁄02 , January. OECD, 1998, “Enhancing the role of competition in the regulation of banks”, Directorate for Financial, Fiscal, And Enterprise Affairs, Committee on Competition Law and Policy, DAFFE/CLP(98)16. Vives, Xavier, 2000, “Central Banks and Supervision”, mimeo, August. Foreign bank entry
Claessens, Stijn, A. Demirgüç-Kunt, and H. Huinzinga, 2001, “How does Foreign Entry Affect Domestic Banking Markets?”, Journal of Banking and Finance, 25(5), April. Focarelli, Dario and Alberto Franco Pozzolo, 2004, “Where do Banks Expand Abroad? An Empirical Analysis”, mimeo. Levine, Ross, 2003, “Denying Foreign Bank Entry: Implications for Bank Interest Margins”, Central Bank of Chile Working Paper, No. 222, August. Martinez Peria, Maria Soledad and Ashoka Mody, 2004, “How Foreign participation and Market Concentration Impact Bank Spreads: Evidence from Latin America”, Journal of Money, Credit, and Banking, 36(3): 511–37, Part 2.