A Prediction Model for Stock Market: A Comparison of The World’s Top Investors with Data Mining Method Yong Hu1*, Bin Feng1, XiangZhou Zhang2, XinYing Qiu3, Risong Li1, Kang Xie2 1 Business Intelligence and Knowledge Discovery, School of Business, Guangdong University of Foreign Studies and Sun Yat-sen University, China 2 School of Business, Sun Yat-sen University, China 3 School of Informatics, Guangdong University of Foreign Studies, Guangdong, China Abstract: Recently, many researches attempt to apply data mining methods to construct attractive decision support models for stock prediction. These models mainly focus on forecasting the price trend and providing advice for investors. According to the practical requirements, this paper proposes a model based on the combination of financial indicators and data mining methods to help fund managers make decision. Four industries were selected as our initial stock pool. One of the most popular data mining methods, support vector machine, was employed to construct a stock prediction model. The results indicate that our model is capable of selecting uptrend stocks. The predictive precision exceeds 60% for each industry in almost entire test period. The seven-year cumulative abnormal return exceeds 500%, much higher than the benchmark and even outperforms both Warren E. Buffett’s and William J. O’Neil’s investment methods. Although the return of our model is less than Richard Driehaus’ in some of test years, the Sharpe ratio of our model is much higher in the whole seven-year test period, which indicates that the return series that our model generated is more stable. Based on the above, a conclusion can be drawn that our model can provide sustained and effective guidance for fund managers on portfolio construction. Keywords: The world’s top investors, Quantitative stock strategy, Data mining based hybrid strategy model, Warren E.Buffett’s Strategy, William J. O’Neil’ s Strategy, Richard Driehaus’s Strategy
1.
INTRODUCTION In the daily fund management, managers always get involved in reading financial sheets to make
investment decisions. Due to the limitation of people’s comprehensive ability and time, generally these decisions are not optimal. That, easily, causes decision mistakes. All these components ultimately lead to a high probability of huge capital loss. This paper focuses on the daily demands of fund experts and aims at constructing a helpful data mining based hybrid strategy model. The model is formulated to find the rules between fundament data and excess returns. With the help of this model, fund managers may acquire more useful knowledge from accounting information. Moreover, a data mining based hybrid strategy model contributes to reducing time cost and standardizing the process of decision-making. The most immediate effect is a series of high quality decisions that bring high excess return. The data mining algorithm employed here is linear SVM for discovering relationships between financial data and returns. Based on the modeling interaction, we consider the selection of equities on the basis of fundamental dataset. Moreover, this model is verified through a seven-year sliding window test in China Stock Exchange. The predictive precision shows that the linear SVM is an appropriate algorithm for the task of financial data analysis. Moreover our model can be used for selecting attractive equities with much higher returns than benchmark. Above all, in the world of financial investment, everybody is looking forward to raising the investment visibility and getting profit through transparent financial investment model *
Corresponding author.
[email protected](Yong Hu)
[1]
. Among the numerous fund
managers, Warren E. Buffett is the one who must be mentioned. His value investment method is recognized as the most successful investment strategy. We use it for reference and research on the comparison with our data mining based hybrid strategy model. There are a few academic articles about Buffett. Chen proposed an intelligent model of stock investment with Buffett strategy quantified by some financial data
[1]
. Lin shows some factors of Buffett strategy
[2]
. In this paper, based on our comprehension about three of the world’s top
investors’ philosophy, we design some indicators which are specific for China Stock Market. These indicators are applied to the construction of three models called master models, which are aiming at obtaining more profitable portfolio. This paper is organized into five sections; Section 2 describes the recent research about this domain. Section 3 outlines the methods employed in our study. In section 4, the experimental design and empirical results are reported and discussed. Section 5 presents the conclusions and future research directions. 2. RELATED WORKS In the last few decades, many technologies and methods have been applied to constructing stock decision support model, such as mathematical statistics, artificial intelligence, etc.
[3]
Statistics methods have been
introduced into analyzing the market behavioral for more than half a century. It may make a prediction of stock trend by analyzing the time series and achieved desirable qualified effect. But in capital market, time series follow a biased random process and the dataset has nonlinear characteristics. Statistics methods perform less well than the data mining technology in dealing with the problem of stock analysis. Machine-learning methods, including SVMs, have tremendous potential in helping people more effectively organize electronic resources
[4]
. The algorithm selected in our model is the most promising data mining
technology- support vector machine. It was first put forward by Vapnik
[5]
, which aims at learning a separate
function that divides training instances into distinct groups according to their class labels. By this point of view, SVMs form a class of supervised learning models with main applications to solving problems in classification and regression [4]. As the attribute of stock market data is highly noisy and complex in dimension [6], we expect that SVMs can obtain good performance in producing high quality predictions continuously. Recently, many researchers set up their own data mining based hybrid strategy model based on data mining method, which depended on their views on how to get excess return. For example, Huang employed the hybrid GA-SVR method to advance the research in soft computing for finance and provide an effective solution to stock selection in practice
[6]
. In this data mining based hybrid strategy models there are fourteen attributes of
firm used in the stock selection model. The study shows that their GA-SVR models validated effectiveness by comparing with the benchmark in Taiwan Stock Exchange at specific period. Dixons developed a data mining based hybrid strategy model for supporting decisions based on the rules [7]. Also, they concerned the selection of equities on the basis of fundamental dataset. With the application on the Athens Stock Exchange, their frame shows that financial analysis can be utilized for selecting attractive equities. Samaras described a multi-criteria data mining based hybrid strategy model which mainly targets at presenting an evaluation of the Athens Stock Exchange stocks, on the foundation of fundamental analysis [8]. The point mentioned that, the stocks evaluation based on the methods of fundamental analysis ratios is the most appropriate within a long term horizon. 3. METHODOLOGY AND MODEL According to the value investment strategy, the selected industries have no significant differences between each other in terms of investment value. Following the practices, all the industries selected belongs to the ‘people’s livelihood industries’. The firms in these industries are closely concerned with each person’s daily life. Based on these reasons, we believe that the stocks in these industries can bring us excess return with lower risk,
while the stocks in other industries may suffer higher risk. What our stock pool tends to pursue is more return and lower risk than the benchmark. The industries selected are shown in Table 1. Table 1. Industries list Number
Industries
Number of stocks
1
Extractive industry
46
2
Farming, forestry, husbandry and fishing industry
56
3
Food and drinks industry
40
4
Nonferrous industry
63
The financial data and stock price observations are from 1999 to 2011 which are fetched from Guotaian Finance Database. We select a few representative financial indicators as the input of our data mining based model. Due to the diversity of the factors’ property, the model we proposed is considered to be a hybrid strategy model. The fundamental ratios are listed in Table 2. Some are from the academic papers and the others from the practical experience. Meanwhile the accounting data is equal-frequently discretized into three portions. As the comparative experiment, some of the factors are constructed based on our comprehension of the world’s top investors’ investment philosophy. These indicators may have a few differences from the other writings which introduce the quantized world’s top investors’ investment method, because they are especially pertinent for China Stock Market. These philosophies can be found at FINASIA
[9]
.Table 3 shows the quantized Buffett’s
investment method. Table 4 shows the quantized William J. O’Neil’s investment method. Table 5 shows the quantized Richard Driehaus’s investment method.
Table 2. Hybrid strategy model factors Attribute
Ratios
Description
Share price rationality
EP ratio
Earnings-to-price ratio
[10]
BP ratio
Book-to-price ratio
[10]
SP ratio
Sales-to-price ratio
[10]
ROE
Return on equity(after tax)
[11]
ROA
Return on asset(after tax)
[11]
OIG
Operating income growth
[12]
NIG
Net income growth
[13]
DE ratio
Debt-to-equity ratio
[11]
ALR
Asset liability ratio
Liquidity
CR
Current ratios
Operating
FATR
Fixed assets turnover rate
TATR
Total assets turnover rate
ITR
Interest turnover rate
[11]
Ln(S)
The lagged market value
[14]
Ln(M)
The lagged circulation market value
Ln(A)
The lagged asset
NCFOC/TMV
Net cash flows of operating activities-to- total market value
Profitability
Growth
Leverage
Scale
Cash flow
Refs
[11]
[14]
Table 3.Quantized Buffett’s investment method Number
Factors
1
Company’s gross profit margin > Industry average (gross profit margin)
2
Five-year average of shareholders’ equity ratio > 15%
3
Shareholders’ equity ratio > Industry and market average (shareholders’ equity ratio)
4
Debt ratio < stock pool average (debt ratio)
5
Price / (free cash flow per share) < 10
6
Cash flow per share >= earnings per share
Table 4.Quantized O’Neil’s investment method Number
Factors
1
The year-on-year growth rate of EOCPS on last fiscal quarter >=20%
2
The year-on-year growth rate of EPS on last fiscal quarter > 0
3
The year-on-year growth rate of EOCPS on last fiscal quarter > The year-on-year growth rate of EOCPS on last but one fiscal quarter
4
EOCPS on last two fiscal quarter > 0
5
EOCPS on last year >= EPS on last year
6
The growth rate of EOCPS on last three year >= 25%
7
The growth rate of EOCPS on every last three year > 0
8
The EPS of last year ranking in the top 30% among all the stocks
Note: EOCPS indicates earnings of operating activities per share
Table 5.Quantized Driehaus’s investment method Number
Factors
1
Total assetthe value compared with the same period in last
year 3
The expected growth of earnings after tax>the value compared with the same period in last year
4
The growth of operating income on recent fiscal quarter> the value compared with the same period in last year
5
The growth of earnings after tax on recent fiscal quarter> the value compared with the same period in last year
6
The turnover of volume on recent 30 trading days > the average of market
7
The change rate of relative strength of stock price on recent 30 trading days > 0
Furthermore, the sliding window method is applied for measuring the performance of the model. It is used to divide the sample data into different groups of training and test data [15]. This approach is widely used in many data mining problems including stock market prediction. In this article, the training data of the first group is from the year of 1999 to 2004. Then the testing data is based on the next year. In the training period, we match the accounting data with the excess returns. The class labels were defined based on the difference between a stock return and the benchmark return, in other words, whether a stock outperforms the benchmark. The model generates a buy signal whenever a stock is predicted outperforms the benchmark. Therefore, the model is trained and tested for seven times. As a result, there are seven different rates of accuracy and earnings of the prediction model.
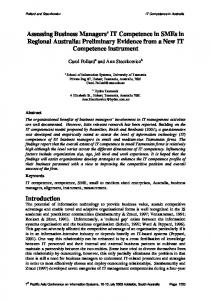
Moreover, in order to confirm the validity of our model, a comparative experiment with the world’s top investors’ investment method was developed. The sliding window test is the same as above. Meanwhile the input of this part of experiment is the accounting data of firms, and the output is the signal of buy or abandon. Aimed at finding uptrend potential equities, the precision of this model is the most appropriate indicator. Because it mainly indicates the percent of actual uptrend stocks out of the stocks that predicted uptrend. In fact, the fund managers pay less attention to the precision of the model usually, what they care about most is how much money they could make. So the most important performance criteria are the returns and cumulative returns. 4. EXPERIMENTS AND RESULTS This section presents the experiments and results on the sliding window tests in detail. Table 6 shows the confusion matrix of four industries on every test year. Figure 1 shows the comparison of cumulative returns on different models. Table 7 is the summary of all the output of model. Table 6. Confusion matrix of four industries for every test year Industries
Indicators
2005
2006
2007
2008
2009
2010
Extractive
TP
7
5
12
10
26
28
TN
15
11
3
8
5
4
FP
10
7
6
7
4
5
FN
5
16
14
14
9
12
Precision(%)
41.2
41.7
66.7
58.8
86.7
84.8
TP
3
18
7
2
14
9
TN
14
1
9
18
6
15
FP
4
9
5
1
5
4
FN
12
14
19
20
24
22
Precision(%)
42.9
66.7
58.3
66.7
73.7
69.2
TP
12
14
7
7
13
14
TN
12
4
14
4
2
8
FP
4
9
8
5
3
7
FN
11
11
8
22
21
11
Precision(%)
75.0
60.9
46.7
58.3
81.3
66.7
TP
23
18
14
11
37
22
TN
7
5
8
11
4
5
FP
4
10
7
3
7
4
FN
9
13
12
20
10
29
Precision(%)
85.2
64.3
66.7
78.6
84.1
84.7
FFHF
Food & Drinks
Nonferrous
Note: FFHF= Farming, forestry, husbandry and fishing
As Table 6 shows, the precision indicator implies that the ability of our model on finding attractive stocks is very strong. In the test period, most of the precision are above 60%, moreover, some of them is extremely high close to 85% in specific years.
Figure 1 shows that the cumulative returns of the four models which with initial capital 10000¥. The result of our data mining based hybrid strategy model surpasses the Buffett’s and O’Neil’s model on every year. Naturally the cumulative returns obtained are considerable greater than the benchmark. In comparison with Driehaus, his model is more successful in 2008-2010. In Table 7, the effectiveness of our model is solidly proved. Due to the high average precision, our model can get more than 30% annualized return. Meanwhile, with the Sharpe ratio above 1.1, our model can obtain higher return with lower risk. In the comparative study, Buffett’s and O’Neil’s investment method obtains lower returns with Sharpe ratio less than 0.7. Even though Driehaus’s model generates higher return, its risk is much higher with Sharpe ratio 0.68. The averages of the return and SR in our model on these four industries are both attractive.
Note: the DMHSM indicates the Data mining based hybrid strategy model
Figure 1.Comparison of cumulative returns on different models Table 7. Comparison of result summary DMBHSM
Stock Pools
AR(%)
AE(%)
SR
Extractive Industry
555
30.8
1.14
FFHF Industry
513
29.6
1.12
Food & Drinks Industry
781
36.5
1.50
Nonferrous Industry
1090
42.5
1.10
Average
844
35.6
1.22
Buffett
A-Shares
347
12.0
0.48
O’Neil
A-Shares
457
17.98
0.62
Driehaus
A-Shares
1216
81.92
0.68
Note: FFHF =Farming, forestry, husbandry and fishing industry PLH=People’s living hood industry DMHSM=Data mining based hybrid strategy model AR=Accumulated Returns AE:=Annualized Earning SR=Sharpe ratio
5. CONCLUSIONS AND FUTURE WORKS Based on practical demands, this paper constructs a data mining based hybrid strategy model for fund managers. Listed companies of four peoples’ livelihood industries were selected as our stock pool. The financial data selected is well accepted by fund managers and academics. The linear SVM algorithm was integrated in the model to support investor’s decision-making. In the seven-year sliding window test for each industry, our model attains more than 60% predictive precision. The accumulated returns exceeded 500%, meanwhile the Sharpe ratio exceeded 1.1. Compared with Buffett’s and O’Neil’s methods, our data mining based hybrid strategy
model is shown to be more effective in almost entire test period. Meanwhile, even if the return less than that of one of the world`s top investors - Driehaus, our model obtains a more stable return. Based on the results above, we can come up with the conclusion that our model can offer clear guidance and valuable advice for fund managers on investment decision making. In the future, feature selection method would be used as the first step of the data mining based hybrid strategy model construction process. Furthermore, the comparative studies of the world famous fund managers with data mining methods require being more deep and more high-quality. ACKNOWLEDGEMENT This research was partly supported by National Natural Science Foundation of China (Project No.:71271061, 70801020), Science and Technology Planning Project of Guangdong Province, China (Project No.:2010B010600034, 2012B091100192), Business Intelligence Key Team of Guangdong University of Foreign Studies (TD1202), and Innovation Ability Cultivation Plan for graduate students of Guangdong University of Foreign Studies. REFERENCES [1] Chen A, Lin W, Chen Y. An Intelligent Model for Stock Investment with Buffett Strategy, Classifier System, Neural Network and Linear Programming[C]. The fourth international conference on electronic business. 2004. [2] Lin W, Yang C. Application of integral value-investing strategy with genetic algorithms[J]. Tamsui Oxford Journal of Management Science. 2003, 19: 19-50. [3] Ren N, Zargham M, Rahimi S. A Decision Tree-Based Classification Approach To Rule Extraction For Security Analysis[J]. International Journal of Information Technology & Decision Making. 2006, 1(5): 227-240. [4] Hearst M A, Dumais S T, Osman E, et al. Support vector machines[J]. Intelligent Systems and their Applications, IEEE. 1998, 13(4): 18-28. [5] Vapnik V N. The Nature of Statistical Learning Theory[M]. New York: Springer-Verlag, 1995: 102-130. [6] Huang C. A hybrid stock selection model using genetic algorithms and support vector regression[J]. Applied Soft Computing. 2012, 12(2): 807-818. [7] Xidonas P, Ergazakis E, Ergazakis K, et al. On the selection of equity securities: An expert systems methodology and an application on the Athens Stock Exchange[J]. Expert Systems with Applications. 2009, 36(9): 11966-11980. [8] Samaras G D, Matsatsinis N F, Zopounidis C. A multicriteria DSS for stock evaluation using fundamental analysis[J]. European Journal of Operational Research. 2008, 187(3): 1380-1401. [9] http://www.tej.com.tw/twsite/tejweb/tw/product/explain/T0111.htm[Z]. [10] Mukherji S, Dhatt M S, Kim Y H. A Fundamental Analysis of Korean Stock Returns[J]. Financial Analysts Journal. 1997, 53(3): 75-80. [11] Omran M. Linear versus nonlinear relationships between financial ratios and stock returns: empirical evidence from Egyptian firms[J]. Review of Accounting and Finance. 2004, 3: 84-102. [12] Ikenberry D, Lakonishok J. Corporate Governance Through the Proxy Contest: Evidence and Implications[J]. The Journal of Business. 1993, 66(3): 405-435. [13] Sadka G, Sadka R. Predictability and the earnings–returns relation[J]. Journal of Financial Economics. 2009, 94(1): 87-106. [14] Fama E F, French K R. The Cross-Section of Expected Stock Returns[J]. The Journal of Finance. 1992, 47(2): 427-465. [15] Tsai C, Hsiao Y. Combining multiple feature selection methods for stock prediction: Union, intersection, and multi-intersection approaches[J]. Decision Support Systems. 2010, 50(1): 258-269.