[13] G. Breed. Bit Error Rate: Fundamental Concepts and Measurement Issues. High Frequency Electronics tutorial, Jan 2003. [14] R. Draves, J. Padhye, and B.
Assessing Link Quality in IEEE 802.11 Wireless Networks: Which is the Right Metric? Angelos
Vlavianos∗ ,
Lap Kong
Law∗ ,
Invited Paper Ioannis Broustis† , Srikanth V. Krishnamurthy∗ , Michalis Faloutsos∗
Department of Computer Science and Engineering, University of California, Riverside, CA 92521 {aggelos, lklaw, broustis, krish, michalis}@cs.ucr.edu
Abstract—The accurate determination of the link quality is critical for ensuring that functionalities such as intelligent routing, load-balancing, power control and frequency selection operate efficiently. There are 4 primary metrics for capturing the quality of a wireless link: RSSI (Received Signal Strength Indication), SINR (Signal-to-Interference-plus-Noise Ratio), PDR (Packet-Delivery Ratio), and BER (Bit-Error Rate). In this paper, we perform a measurement-based study in order to answer the question: which is the appropriate metric to use, and under what conditions? We evaluate the relative accuracy of each metric by conducting experiments with multiple transmission rates and varying levels of interference on a large set of links. We observe that each metric has advantages and projects one or more limitations. Our study suggests that a careful consideration of these limitations is essential, and provides guidelines on the applicability of each metric. 1 Index Terms—IEEE 802.11 Wireless Networks, Measurements, Experimentation, Interference, Network Topology, Testbed.
I. I NTRODUCTION The ease of installation and the low cost of IEEE 802.11 networks has led to very dense, ubiquitous deployments in urban areas [1]. A critical requirement for the efficient operations of such networks is the identification and use of high-quality links; many performance improvement mechanisms depend on this information. For example, in order to perform load-balancing or power-control in WLANs, the link quality between access points and clients must be measured [2], [3]. Moreover, routing protocols seek effective routes, which consist of high-quality point-to-point links, in multi-hop deployments; therefore the goodness of the component links along a path needs to be periodically evaluated [4], [5]. All prior studies typically employ one of the following 4 metrics in order to capture point-to-point link qualities: Received Signal Strength Indication (RSSI), Signal-to-Interference-plus-Noise Ratio (SINR), Packet Delivery Ratio (PDR), and Bit Error Rate (BER). Each of these metrics provides an average estimation of the link quality over a period of time. However, how accurate are these metrics? Is it sufficient to arbitrarily select any of them? Is any of these metrics generic enough to be employed by all the aforementioned mechanisms? 1 Prepared partially through collaborative participation in the Communications and Networks Consortium sponsored by the U. S. Army Research Laboratory under the Collaborative Technology Alliance Program, Cooperative Agreement DAAD19-01-2-0011. The United States Government is authorized to reproduce and distribute reprints for Government purposes notwithstanding any copyright notation thereon.
The goal of this paper is to provide experimentally-justified answers to all the above questions, and guidelines on when each metric should be employed. We present a comprehensive, measurement-based study of how these metrics can be used, whether they are equivalent, and their limitations. In addition, we analyze the validity of common assumptions with regards to each metric. A distinguishing characteristic of our work is that we examine the correlation of each metric to the use of different transmission rates, supported by IEEE 802.11a and 802.11g. In a nutshell, our measurements on an indoor testbed [6] suggest that none of these metrics by itself is sufficient to accurately characterize the quality of a link! We highlight our observations, leading to this conclusion: 1. The RSSI is measured only during the reception of a packetpreamble, which is transmitted at the lowest rate. Thus, the RSSI is ineffective in accurately characterizing the link quality, especially at high transmission rates. Furthermore, as we explain later, the RSSI cannot accurately capture interference fluctuations. 2. While the SINR can be an accurate predictor of link quality, it is hard (if not impossible) to measure the exact SINR value. 3. While the PDR is a good metric for characterizing link quality at a coarse-grained level, it is highly dependent on the packet size and the transmission rate. 4. The BER measurements provide a finer-grain indication of the quality of a link. However, repeated computations of this metric are required over extended periods of time. Moreover, one needs to ensure that outliers do not result in biased BER results. The remainder of the paper is structured as follows. In Section II we provide a brief discussion on each metric and summarize the related studies on capturing the wireless link quality. Section III describes our experimental setup. In Section IV we discuss the observations from our measurement-based study and an in-depth analysis of our findings. Finally, our conclusions form Section V. II. BACKGROUND AND R ELATED S TUDIES In this section, first we briefly discuss each of the 4 metrics, and subsequently provide details on other relevant work. A. The link quality metrics under study Received Signal Strength Indication: RSSI is a dimensionless quantity, which represents the signal strength observed at the receiver’s antenna during packet reception. RSSI values
vary from 0 to Rmax [7]; the maximum value depends on the chipset of the wireless card. For example, wireless cards with the Atheros chipset report Rmax = 60, Cisco cards have Rmax = 100, while in Intel cards the RSSI provides the actual received power in the negative dBm scale (for example, RSSI = −55 for the Intel cards implies a received power equal to -55 dBm). Note that the specifications of each card provide a formula for translating the RSSI values to power (dBm). Signal to Interference plus Noise Ratio: SINR represents the extent to which the power of the received signal exceeds the sum of noise plus interference at the receiver. Various models have been developed to map the SINR to the Bit Error Rate (BER) or the Packet Error Rate (PER) in presence of white noise or fading [8]. Recent studies have considered SINR to be the most appropriate metric for quantifying the quality of a link [9]. However, having an accurate SINR is not simple, as we discuss in Section IV. Packet Delivery Ratio: PDR is the ratio of the correctly received packets at the receiver to the total number of packets sent by the sender. PDR is the most popularly used metric for assessing a link’s quality. The product of PDR with the transmission rate derives an estimation for the link throughput; this has been used in many studies, as a main determinant for routing [10] [11] or rate selection decisions [12]. Bit Error Rate: BER is the ratio of bits with errors to the total number of bits that have been received over a given time period. While the concept of BER is simple, measuring the BER is a non-trivial task; BER measurements consider a pseudorandom data sequence transmission [13]. B. Related studies Many wireless link-quality estimators have been previously proposed [4], [14], [10]. In particular, De Couto et al. [4] define the expected number of transmissions, ETX, computed based on the PDR of periodically-transmitted probes. Other similar routing metrics are proposed by Biswas et al. [5] and Draves et al. [11]. Koksal and Balakrishnan [15] present two link-quality estimators based on the bit-level information of probe packets (in contrast, ETX is based on PDR). Their goal is to capture the average bit-error probability and its variability. Zhai et. al. [16] propose the bandwidth distance product as a routing metric; they consider that a rate between two nodes can be supported if a certain SINR is met. Since each of the above estimators is based on a single primary metric (RSSI, SINR, PDR or BER), our measurement-based observations implicitly hold for these metrics. Reis et al. [9] compute the SINR by utilizing the RSSI value. In their approach, they assume that interference adds to the RSSI value of a signal; however, as we show later, we did not observe this in our experiments. Finally, a link-quality measurement framework called EAR is proposed by Kim and Shin [17]. EAR tries to measure the link quality, defined as a function of the PDR. However, again, the proposed estimator is based on a single primary metric, PDR, which is evaluated in our work. III. E XPERIMENTAL S ETUP In this section, we describe our wireless testbed, as well as the methodology that we follow throughout our experiments.
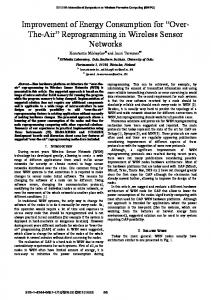
Fig. 1: Deployment of our testbed. Node locations are represented by dots.
Fig. 2: The scenario with the interferer.
A. Testbed description Our wireless testbed [6] is deployed in the 3rd floor of the Computer Science building, at the University of California, Riverside. The topology is depicted in Fig. 1. It consists of 37 Soekris net4826 nodes, which run a Debian Linux distribution with kernel v2.6.16.19. Each node is equipped with two miniPCI 802.11a/b/g WiFi cards: an EMP-8602 6G with Atheros chipset and an Intel-2915. In order to validate our observations, we perform experiments with each card separately2 , for both 802.11a and 802.11g. Our measurements take place late at night, in order to avoid contention and interference from co-located wireless networks. Note that we measure the levels external interference for all channels, and we conduct our experiments on channels with negligible or zero interference. B. Experimental methodology Our results are derived from two scenarios: (a) Transmissions on isolated links, where nodes take turns as transmitters in a Round-Robin fashion. Each transmitter sends traffic for 30 sec. Here, the only interfering factor is the external noise. (b) Transmissions in the presence of interference. In this experimental setup, we enable simultaneous transmissions on sets of mutually-interfering transmitters/receivers in our testbed. Even though the latter situation is more realistic, the first scenario allows us to examine how the different metrics behave in the presence of external noise alone. In both cases (a) and (b), 2 Unless otherwise stated, the two cards provide similar results throughout our experiments.
nodes are broadcasting data (instead of unicasting) to mimic probe transmissions. Throughout our experiments we vary the rates at which the broadcast packets are transmitted, in order to observe the variations in link quality, as depicted by each metric. We also vary the transmission power of nodes between 1 dBm and 15 dBm. We employ fully-saturated broadcast UDP traffic with a default packet size of 1500 bytes. IV. M EASUREMENT-BASED E VALUATION OF L INK -Q UALITY M ETRICS In this section, we present a detailed measurement study on identifying the relative advantages and limitations of the 4 metrics. Furthermore, we go beyond a single rate and examine the metrics with transmissions at multiple rates. A. Evaluating the RSSI Metric As explained in Section II, the RSSI indicates the strength of an arriving signal at a receiver. A typical RSSI measurement includes the energy from the intended transmission, external noise, and the energy from concurrent interfering transmissions. In order to avoid temporary peaks in the RSSI value of received signals, most WiFi cards maintain a weighted moving average: RSSInew
ave
= RSSIold
ave
· X + RSSIlast
measured
· Y.
As an example, for our Intel-2915 cards: X = 0.9 and Y = 0.1. The RSSI, reported from a packet reception, represents the received signal strength only during the reception of the PCLP (Physical Layer Convergence Protocol) preamble and PLCP header. In other words, as per the IEEE 802.11 standard (a, b or g) [18], the RSSI is not the average of the signal strength measured through the reception of the whole packet. As an example, consider the extreme case where external noise and interference affect only the average received signal strength of the much larger DATA portion of the PPDU frame. In such a case, the effect of interference will not be captured in the RSSI measurement for this PPDU. In order to validate this effect, we enable prolonged concurrent transmissions on many interfering links, with different packet sizes. We perform RSSI measurements at all receivers during reception of broadcasted data, using each of the Intel-2915 and EMP-8602 cards. We observe that the RSSI on each link remains almost constant! This is depicted in Fig. 3 (case with Intel-2915), for three of the links in our testbed3 . The small RSSI variations observed in Fig. 3 are due to shadow fading [19], [20]. Hence, the RSSI is inappropriate for use as a stand-alone metric for quantifying link quality, since it does not capture the amount of destructive interference on links. As an additional step, we are interested in observing the potential variability of the RSSI value, caused by varying levels of interference. For this, we conduct an experiment with three nodes: a receiver, a sender and an interferer (Fig. 2). Here we have disabled the CRC functionality of the MadWiFi driver, since we want to obtain the RSSI values of all packets, including those that fail the CRC check. During the communication 3 We have observed this behavior on all of the nodes in our testbed. Fig. 3 includes only three links for better visualization.
between the sender and the receiver, the interferer continuously attempts to broadcast packets at the basic (lowest) transmission rate (6 Mbits/sec). Note that in this experiment the sender and the interferer are hidden from each other. Given that both of them are broadcasting their data packets (virtual carrier sensing is disabled), they are both able to transmit simultaneously. We record the RSSI of all transmitted packets at the receiver, for different values of the transmission power of the interferer (1dBm to 15dBm). In contrary to common belief (e.g. [9]), we observe that the RSSI does not increase as we increase the transmission power of the interferer! Fig. 4 depicts the average RSSI (along with 95% confidence intervals) and PDR with increasing transmission power of the interferer. The average RSSI as well as its variations are similar to the case with no interferer (transmission power = 0 dBm) in almost all cases. On the other hand, the packet delivery ratio (PDR) drops as the amount of interference increases, thus demonstrating the impact of interference on the reliability of packet receptions. One can attribute the above effect to the following reason. Recall that the RSSI is recorded only during the PLCP preamble and header. The PLCP preamble allows the receiver to synchronize with the transmitter for correct reception. An attempt to decode the packet is made only upon the correct reception of the PLCP header. If the PLCP reception fails due to interference, the RSSI will simply not be recorded. In addition, even if the rest of the packet (besides the PLCP) is affected by interference, the RSSI will still remain at a fairly stable value, since it was computed during the preceding PLCP transmission. To conclude, the interference experienced on a link cannot be inferred via RSSI measurements. B. On the Evaluation of the SINR The SINR provides an implicit comparison between the received signal from the intended transmitter, and the total interference experienced at the receiver. Commodity wireless cards do not report the SINR during the reception of a packet and thus, the instantaneous SINR value cannot be easily computed. Commercial cards do not provide the SINR while receiving packets; only the RSSI values are provided. As we note from our 2 different wireless cards, the noise level remains constant during time. More specifically, the EMP-8602 card senses the noise at -91 dBm, while the Intel-2915 at -85 dBm. With a constant noise level, one could perhaps derive an SINR estimate for a particular packet, using the RSSI value. However, this approach inherits all the deficiencies of RSSI, as discussed earlier. In particular, since the RSSI is not computed as an average of the reception power over the entire packet, it does not capture the effect of interference. Hence, the estimate for the SINR will also be inaccurate. Thus, it is extremely hard, if not impossible, to accurately compute the SINR in practice. C. Evaluating PDR The PDR provides the percentage of transmitted packets that were correctly deciphered by the receiver’s circuitry. As expected, the PDR is affected by the packet size; the smaller the packet size, the less likely it is to suffer from interference. In some cases, our measurements indicate that decreasing the
60 -20
Average RSSI PDR
50
1
1
0.6
-50
20
0.4
0.4
-60
10
0.2
0.2
-70
0
Fig. 3: RSSI remains almost constant, even with significant levels of interference.
0
2
4
6
0
200
Interferer Tx Power (dBm)
The RSSI does not change much with interference power; in contrast the PDR decreases.
6Mbps 9Mbps 12Mbps 18Mbps 24Mbps 36Mbps 48Mbps 54Mbps
Links sorted with packet delivery ratio (in ascending order)
400
600
800 1000 1200 1400
Packet Size (bytes)
Fig. 4:
Fig. 5: Packet Delivery Ratio decreases with increasing packet sizes.
The difference of BER with pseudo−random and zero bit sequence (at 24Mbps) Absolute percentage difference
Percentage (%)
Percentage
20
Link A Link B Link C
0
8 10 12 14 16
100
40
0.6
0
The percentage of packets that are NOT received with various DATA tranmission rates
60
PDR
30
-40
PDR
0.8
250 300 350 400 450 500 550 600 Time in units of 30 sec each
80
0.8
40 RSSI
RSSI
-30
Link A Link B Link C
4
10
3
10
2
10
1
10
10
20
30
40
50
60
Links
Fig. 6: Percentage of packets for which, PLCP preamble/header failures are encountered is almost the same for all rates on a given link, irrespective of the PDR on the link.
packet size by 50% increases the PDR by 200% (Fig. 5). This observation is aligned with similar reports by De Couto et al. [4] and Zhang et al. [21]. In spite of this observation, many previous studies have used the PDR (measured with a specific packet size) as an indicator of how well the link behaves with other packet sizes. In a wireless ubiquitous deployment, where the packet sizes are likely to vary, the PDR metric may not provide a unified estimate of the link quality. Behavior at Different Rates: PDR tends to decrease for higher transmission rates, since higher rates are more vulnerable to external noise and interference. In order to observe the trend of the PDR for pairs of interfering links, we conduct experiments with a set of 150 pairs of such links, with with all possible (fixed) rates. We observe that when the basic rate of 6 Mbits/sec is used, the PDR on both links of a pair is very high. However, for higher transmission rates, only one of the two links achieves high PDR. This is due to the topological characteristics of the network, as well as interference variations. Next, we seek to determine the relation between PDR and transmission rate, for the packets that are dropped due to PLCP failures. In particular, packets may be lost because: (a) The receiver’s hardware cannot detect the PLCP preamble or header due to synchronization errors. (b) After reception, a packet fails the MAC layer CRC (cyclic redundancy code) check. We perform experiments with different transmission rates, and in the presence of interference. At each rate, the senders broadcast
Fig. 7: The percentage difference in BER between pseudorandom and zero bit sequences in the payload of a probe packet.
the same number of packets. Fig. 6 depicts a sample set of links with differing PDR quality. For any of these links, we observe that the fraction of packets lost, due to PLCP preamble/header failures, are the same at the various rates! The reason for this behavior is that the PLCP preamble and header are always transmitted at the basic rate. Hence, the probability of a packet failure due to effect (a) above, is insensitive to the choice of rate. Therefore, by performing measurements at any single rate, we obtain an upper bound on the PDR at every rate, since we identify the minimum percentage of packets that are lost 4 . Now that we have observed the individual behaviors of the RSSI and PDR metrics as described above, we further seek to observe the correlations between RSSI and PDR. For this, we consider an experiment in which, each node in our testbed takes turns in broadcasting traffic (in isolation). The rest of the nodes record the RSSI values from the received packets. In Fig. 8, we present scatter plots of the PDR versus the RSSI for every link in our testbed, and for two different rates. For the lowest bit rate (6 Mbits/sec) we observe an interesting correlation between the RSSI and the PDR. In particular, if the RSSI is higher than a certain threshold, the PDR is almost a 100 %. However, with the higher rate (54 Mbps) this correlation 4 Packets failing the CRC check are not included in this measurement. Only those packets that are completely lost are counted.
6 Mbps
54 Mbps
0.4 0.2
20
40
60
RSSI
0.8 0.6 0.4 0.2 0 0
20
40
60
RSSI
Fig. 8: Relation of RSSI and PDR in the isolated scenario. Each point corresponds to a link in our testbed.
is lost. This effect is due to the following reasons. First, the RSSI is computed only over the PLCP preamble and header, which are transmitted at the lowest rate, and account for only a small part of the packet. Hence, if the rest of the packet is transmitted at a much higher rate, one would not expect to see any correlation between the PDR and the signal power with which the preamble and header are received. Second, high-rate transmissions are more susceptible to noise. Note here that higher rates are achieved by using more aggressive modulation schemes (denser constellations with more closely located points). Specifically, BPSK is used with 6 Mbits/sec (with 2 constellation points), whereas QAM-64 is used with 54 Mbits/sec (64 points in the constellation). As a consequence, lower levels of interference could cause a symbol error at higher rates (unlike at the lower rates). As we inject interference with an interferer transmitting with 15 dBm of power (Fig. 9), the observations remain similar. However, notice that the extent of correlation degrades slightly with the lower rate transmissions. If we increase the interference to much higher levels, one might expect that the correlation is likely to be lost; the possibility of errors in the larger packet will increase, even if the smaller PLCP preamble/headers are received correctly. According to our previous observations however, the measured RSSI is unlikely to change significantly, even with the increased levels of interference5 . As a consequence, the RSSI cannot be used for estimating the PDR. D. The efficiency of BER The metric BER represents the ratio of the number of erroneous bits to the total number of received bits. The BER is not reported (by default) by commodity wireless cards. In order to derive the BER in practice, the CRC functionality has to be disabled first so as to have access to erroneously received packets; otherwise, such packets will be discarded. Therefore, we have modified the MADWifi driver of our EMP-8602 cards, to gain access to packets that fail the CRC check; we use the information from these packets, in order to compute the 5 Previous studies [22] [9] have observed this lack of correlation between the RSSI and PDR. However, they have not analyzed the effects at multiple rates, or the reasons for this lack of correlation.
1
Packet Delivery Ratio
0.6
54 Mbps
1
Packet Delivery Ratio
0.8
0 0
6 Mbps
1
Packet Delivery Ratio
Packet Delivery Ratio
1
0.8 0.6 0.4 0.2 0 0
20
40
RSSI
60
0.8 0.6 0.4 0.2 0 0
20
40
60
RSSI
Fig. 9: Relation of RSSI and PDR in the concurrent transmissions scenario. Each point corresponds to a link in our testbed.
BER. Deriving the value of the BER, through measurements, is not a straightforward procedure. Before counting the number of corrupted bits, one should discard packets that may have outliers. Packets with outliers include: (a) those packets where the corrupted bits appear in the Length field of the packet header and, (b) those packets where the bits are simply shifted by some bit positions. The first type of outlier packets could result in the receiver trying to interpret bits that are not actually a part of the packet (since the Length field now indicates a wrong payload size). Note that, since the CRC functionality must be disabled before computing the BER, the case of a received packet with erroneous Length-field value is possible. To identify these packets we check the Length field to determine if it matches with the Length field of the original packet; this may be simply enabled by sending probe messages of constant length. The second type of outlier packets may have almost all the bits received correctly, but due to a shift of the bits by some bit positions, all bits are misclassified as corrupted. Hence, the BER computation introduces significant overheads, since it requires the processing of a large amount of pre-known data, and involves the removal of packet outliers. To measure the BER, one could send a known, pseudorandom sequence of bits. One may be tempted to use payloads with all zeros or ones, since this would make it easier to count the number of bit errors. However, with such an approach the resulting BER value will not be accurate. This observation is due to a phenomenon called the Data-dependent Syndrome. Transmitting the same bits is translated at the PHY layer into sending the same symbol. However, symbols are mapped to a specific position in the constellation of the PHY layer modulation; different symbols in the constellation are subject to different effects due to noise and interference, and thus they do not have the same error probabilities [23]. As a consequence, errors are correlated with the symbols being transmitted. To overcome this effect, the payload of the probe packet could instead be constructed by a pseudo-random sequence of bits. This would ensure that there is an equal chance of sending each symbol in the modulation space. One can detect whether the received packet has any errors, by performing an XOR
operation with the corresponding transmitted packet6 . The importance of using a pseudo-random sequence is seen in Fig. 7. We observe a percentage difference of more than 1000% in the computed BER, between the case where the pseudorandom sequence was used, and the case where probe packets with all-zero payloads were used. We observed similar results for different transmission rates, as well as varying levels of interference. As as result, for the BER computation, one cannot rely on all-zero or all-one payloads in the probe packets; instead, a pseudo-random sequence should be used for this purpose. A practical rule for correctly estimating a BER of the order of 10−x is that we need to transmit 10x+2 bits [23]. This ensures approximately an accuracy of two significant digits in the computation of BER. Note that the BER is computed only from the received packets (correct or corrupted). Therefore, in high interference conditions, in which most of the packets may not be received at all, there may not be enough samples to accurately compute the BER. Assuming that the lost packets have all their bits in error can bias the computed BER! As an extreme example, a packet might not be received due to interference only during the short temporal period that the PLCP preamble and header are being received. Behavior at Different Rates: The BER behaves like the PDR, for the different transmission rates. In particular, it tends to be higher for higher transmission rates, given the increased vulnerability of high-rate transmissions to external noise and interference. V. D ISCUSSION AND C ONCLUSIONS Our measurement-based observations suggest that generally none of the examined metrics on its own, can be used for accurately determining the quality of a link. However, each metric can reveal interesting behavioral aspects of the link. A potential technique that would intelligently combine some of the metrics could yield an accurate representation of the link quality. In particular, we observed that the RSSI has associated limitations that can be quite misleading while estimating the “goodness” of a link, while the SINR cannot be accurately computed, due to those deficiencies of the RSSI. In addition, the PDR is highly dependent on the packet-size and the choice of the transmission rate, and this makes it inneficient to use in reality. An approach used in [17] categorizes all the packets into the three most popular packet-sizes in the Internet [24] and then derives the PDR for each category. However, this approach only reduces the sensitivity of the PDR to the packet size in use, to some extent. Furthermore, it does not address the issue of the sensitivity of the PDR to the transmission rate; automatic-rate control functions could invoke packet transmissions at different rates. We argue that the PDR metric makes a coarse-grained determination of link quality. The bit level information from the failed packets can be extremely helpful in the decision-making process at the higher layers; this can be provided by the BER metric. For example, an algorithm for adaptively changing the 6 The seed to the pseudo-random sequence generator is made known to the receiver.
packet size, based on this feedback, could potentially provide significant benefits. Our work does not attempt to construct a new metric which combines the different primary metrics in an intelligent way. Instead, it is a precursor to the design of such a metric. We believe that our studies can aid researchers and practitioners in future work on designing such metrics for characterizing the quality of wireless links. R EFERENCES [1] A. Akella, G. Judd, S. Seshan, and P. Steenkiste. Self-Management in Chaotic Wireless Deployments. In ACM MOBICOM, 2005. [2] I. Broustis, K. Papagiannaki, S. V. Krishnamurthy, M. Faloutsos, and V. Mhatre. MDG: Measurement-Driven Guidelines for 802.11 WLAN Design. In ACM MOBICOM, 2007. [3] B. Kauffmann, F. Baccelli, A. Chainteau, V. Mhatre, K. Papagiannaki, and C. Diot. Measurement-Based Self Organization of Interfering 802.11 Wireless Access Networks. In IEEE INFOCOM, 2007. [4] D. S.J. De Couto, D. Aguayo, J. Bicket, and R. Morris. A HighThroughput Path Metric for Multi-Hop Wireless Routing. In ACM MOBICOM, 2003. [5] S. Biswas and R. Morris. ExOR: Opportunistic Multi-Hop Routing for Wireless Networks. In ACM SIGCOMM, 2005. [6] I. Broustis, J. Eriksson, S. V. Krishnamurthy, and M. Faloutsos. A Blueprint for a Manageable and Affordable Wireless Testbed: Design, Pitfalls and Lessons Learned. In IEEE TRIDENTCOM, 2007. [7] J. Bardwell. Converting signal strength percentage to dbm values. Technical report, WildPackets, Inc., 2002. [8] M. K.Simon and M. Alouini. Digital Communications over Fading Channels. Wiley, 2nd edition, 2005. [9] C. Reis, R. Mahajan, M. Rodrig, D. Wetherall, and J. Zahorjan. Measurement -Based Models of Delivery and Interference in Static Wireless Networks. In ACM SIGCOMM, 2006. [10] B. Awerbuch, D. Holmer, and H. Rubens. The medium time metric: High throughput route selection in multi-rate ad hoc wireless networks. Mobile Networks and Applications, 2006. [11] R. Draves, J. Padhye, and B. Zill. Routing in Multi-Radio, Multi-Hop Wireless Mesh Networks. In ACM MOBICOM, 2004. [12] John Bicket. Bit-rate selection in wireless networks. Master’s thesis, MIT, Feb. 2005. [13] G. Breed. Bit Error Rate: Fundamental Concepts and Measurement Issues. High Frequency Electronics tutorial, Jan 2003. [14] R. Draves, J. Padhye, and B. Zill. Comparison of Routing Metrics for Static Multi-Hop Wireless Networks. In ACM SIGCOMM, 2004. [15] C. E. Koksal and H. Balakrishnan. Quality-Aware Routing Metrics for Time-Varying Wireless Mesh Networks. IEEE JSAC, 2006. [16] H. Zhai and Y. Fang. Physical Carrier Sensing ad Spatial Reuse in Multirate and Multihop Wireless Ad Hoc Networks. In IEEE INFOCOM, 2006. [17] K. Kim and K. G. Shin. On Accurate Measurement of Link Quality in Multi-hop Wireless Mesh Networks. In ACM MOBICOM, 2006. [18] B. O’Hara and A.Petrick. The IEEE 802.11 Handbook: A Designer’s Companion. IEEE Press, 2005. [19] V. Mhatre, K. Papagiannaki, and F. Baccelli. Interference Mitigation through Power Control in High Density 802.11 WLANs. In IEEE INFOCOM, 2007. [20] S. Zvanovec, P. Pechac, and M. Klepal. Wireless LAN Networks Design: Site Survey or Propagation Modeling? In Radioengineering, Vol. 12, No. 4, p. 42-49, December 2007. [21] H. Zhang, A. Arora, and P. Sinha. Learn on the Fly: Data-driven Link Estimation and Routing in Sensor Network Backbones. In IEEE INFOCOM, 2006. [22] D. Aguayo, J. Bicket, S. Biswas, G. Judd, and R. Morris. Link-level measurements from an 802.11b mesh network. In ACM SIGCOMM, 2004. [23] Jim Waschura. Bit Error Analysis and Beyond. SYNTHESYS RESEARCH, INC., March 2000. [24] C. Williamson. Internet traffic measurements. IEEE Internet Computing, 2001.