adrianoc, leosilva, meira, walter} @dcc.ufmg.br. Abstract ... a method to remove requests belonging to inactive sessions, ..... [5] R. Carter and L. Cherkasova.
Assessing Reactive QoS Strategies for Internet Services Adriano Pereira
Leonardo Silva
Wagner Meira Jr.
Walter Santos
Federal University of Minas Gerais - e-SPEED Lab. Av. Antˆonio Carlos 6627 - ICEx - CEP 31270-010 Belo Horizonte – Minas Gerais – Brazil adrianoc, leosilva, meira, walter @dcc.ufmg.br �
Abstract The design of systems with better performance is a real need to fulfill user demands and generate profitable Web applications. Understand user behavior and workload they produce on the server is fundamental to evaluate the performance of systems and their improvements. User reactivity, that is, how the users react to variable server response time, is usually neglected during performance evaluation. This work addresses the use of reactivity to improve QoS of Internet services. We propose and evaluate new admission control policies. We designed and implemented the USAR-QoS simulator that allows the evaluation of the new QoS strategies considering the dynamic interaction between client and server sides in Internet services. The simulation uses a TPC-W-based workload and shows the benefits of the reactive policies, which can result in better QoS. The experiments show the proposed reactive admission control policies lead to better response time rates, with a reduction from 15 to 50%, preserving the user satisfaction metric.
1 Introduction The phenomenal success of the Internet has raised new challenges in terms of applications and user satisfaction. When users try to reach a Web site, for example, the server may be so busy that they experience poor performance. In order to satisfy application demands, many QoS mechanisms has been proposed, becoming a research topic of great interest. Despite this, aspects related to the user behavior are not completely understood, mainly the user response to the quality of service provided by the service. In this work we are interested in understanding how the reaction of users to QoS measures such as response time may be exploited for sake of designing novel and more effective QoS strategies. Previous work has identified and quantified the impact of user behavior on the performance of Internet services [16], showing that the performance provided by the server affects reciprocally the user-side behavior, in an iterative fashion. These evidences suggest that
effective QoS strategies and mechanisms should take into consideration the user behavior. We propose and analyze the use of admission control techniques based on user reactivity to guarantee QoS in Internet services for workloads with different characteristics. We present the USAR-QoS simulator that allows the evaluation of the proposed QoS strategies considering the dynamic interaction between client and server sides in an Internet service scenario. The experiments show the gains obtained by the reactive strategies, demonstrating the benefits of the reactive admission control approach.
2 Related Work Generating realistic workloads is a hard challenge addressed by many works. Among them, SURGE [3] and httperf [14] are Web workload generators, designed to exercise Web servers. They are powerful tools but are not capable of simulating the user reactions to the performance provided by the service. The workloads that they generate has always the same arrival process, regardless on how the server answers the requests. User behavior has been analyzed through several criteria, such as navigational patterns, types of functions [12], inter-arrival times, among other information. Costa et al. [7] analyze the correlation between requests in streaming media applications, aiming to find trends in the user interaction process. Balachandran et al. [2] characterize the user behavior in a public wireless network, considering user distribution, session duration, and data rates. However, these studies fail to model the correlation between users and server behavior. They do not capture the reactivity of users to the quality of service provided. Performance evaluation is the basis for asserting the QoS provided by an Internet service provider (ISP) under varying workload. Selvridge et al. [17] evaluate the impact of the response time on the user performance. Feitelson [8] shows that the performance of a computer system depends on the characteristics of the workload it must serve, concluding that performance evaluation requires the use of representative workloads.
Several efforts in QoS focus on the computer networks level, but the same does not apply to Internet servers. Iyengar [10] analyzes a web server and finds out that there is a need to use some admission control in order to achieve good performance. Bhatti and Friedrich [4] discuss QoS issues for web servers and investigate a simple admission control mechanism. Cherkasova and Phaal [6] develop a session-based admission control that rejects new customers during overload period. Carter and Cherkasova [5] develop a method to remove requests belonging to inactive sessions, improving server performance. Nevertheless, none of these efforts take into consideration the user behavior while designing admission control strategies.
�9B
Y
RAT
This section discusses reactivity in Internet services. Section 3.1 describes how it may be modeled and Section 3.2 discusses the impacts of reactive workloads on the performance of servers, demonstrating why it is important to consider the reactivity when it comes to evaluate the QoS of Internet applications.
Several works have proposed methodologies to characterize workloads, considering user-side and server-side metrics, but ignoring the correlation between them, i.e., the reactivity. Reactivity represents the way a user behaves according to the quality of service provided. As the QoS provided by the server changes, the user behaves differently. Pereira et al. [15] presents a characterization model named USAR that makes possible to model the reactivity. USAR [15] employs a function to relate the inter-arrival time (IAT) to response time measures of each workload request. Response time (R) represents the time a service takes to process a request, considering its receipt, processing and response. It is a critical factor to users of interactive systems. The model correlates the IAT and response time using the following functions:
�������� ��
I(k,k+1) � R(k) � DIF(k) ��� R(k) � I(k,k+1)� � DIF(k) ���� � DIF(k) �������
��� �!�"� #�$�%��� � �'& � )(*+�"� �-, �/.10�2435�7682 � � is a user request, �:�"� � �;& � is the IAT between �9� where � < � & +� "
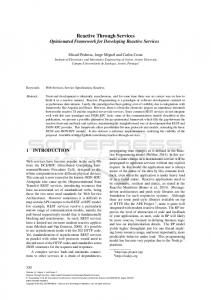
� � request and � , and is the response time associated to the request . Functions RAT and DIF may be used in a discretized fashion depicted in Figure 1. The = axis is associated with the DIF function and the > axis with the RAT The � to ?function. model defines seven user action classes ( ), using two �7@ �A limit values for each axis. Values and divide the positive and negative sides of DIF function, defining a zone close to zero, where the values of IAT and response time
G
A
K4
3 Internet Services and Reactivity
3.1 User Reactivity Modelling
�DC
are very close to each other. Values and divide the vertical scale into three different zones, according to RAT function that quantify the correlation between IAT and response time. The classes A, B, and C represent behaviors where users do not wait for the answer to their requests before asking another object, and the classes E, F and G represent behaviors where users wait for the answer to their requests before asking another one. The boundaries ��E and of�DF .these classes is defined by two other constants: For Class D, the user requests a new object a short time after receiving the previous one.
D
B K3 1
F E
C K1
0
K6
K5 X
K2
DIF
Figure 1: Discretization Model
Figure 2 presents the patience scale composed by the classes derived from the discretization model. Classes in the left side of the scale represent user reaction classes for impatient users that usually do not wait for a response to completely arrive to submit a new request to the server. The right side represents user reaction classes where the user is patient, waiting for a request to complete before submitting another one.
A
B −3
C −2
D −1
D 0
E 1
F 2
G 3
Figure 2: Patience scale
Besides this model, Pereira et al. [15] also show how to replicate the user reaction classes based on the results of the characterization phase. It means that it is possible to generate a synthetic log that mimics the behavior of users.
3.2 Quantifying the Impact of User Reactivity The impact of reactive workloads on the performance of Internet services is discussed in [16]. That work evaluates the performance of a Web application using three distinct scenarios of load. The results show that Web servers under reactive workloads behave differently when compared to those under non-reactive workloads. The experiments demonstrate that different response times affect the rate of requests submitted to the server and, consequently, changing the load to the server. Therefore, it is shown that userside affects the server-side behavior, and vice-versa, demonstrating the importance of the reactivity. The main consequence of the fact that reactivity impacts the server performance is that the actual models of Web
server performance should be improved since they do not consider this aspect. This motivates the investigation of new strategies that may even mitigate negative effects of the reactivity and reinforce the positive ones. Section 4 discusses this subject, introducing quality of service concepts and proposing innovative strategies based on the reactivity.
4 Quality of Service and Reactivity As individuals and organizations increasingly rely on Internet services for their daily activities, it becomes crucial to guarantee that these services are reliable, scalable, robust, trustworthy, and secure, that is, they provide QoS guarantees. An effective way to provide QoS is to employ control techniques, such as admission control, scheduling, and load balancing. These techniques may guarantee that QoS measures are below within specified bounds, according to the policy adopted. Admission control mechanisms reject some requests whenever the arrival rate is too high and it is necessary to maintain an acceptable load in the system. Without admission control, throughput may decrease when the system saturates. Traditionally, server utilization or queue length are criteria used in admission control schemes. Traditional QoS policies do not consider user reaction. Using the reactive approach, we are able to create new admission control policies more suitable for real scenarios. Next subsections present new admission control policies based on the rectivity that rejects bursts or sections. Bursts consist of a sequence of requests for fetching a web page with embedded objects (like pictures). A burst is submitted to the server when a user clicks on a link or requests a Web page. Bursts mimic the typical browser behavior where a click causes the browser to first request the selected Web object and then its embedded objects. A session consists of a sequence of bursts in which the time between any two consecutive burst is below a certain threshold.
4.1 Burst-Based Approach The burst-based admission control rejects bursts of requests when the policy identify a fulfilled rejection rule. Traditional policies adopt just one limit to response time and start to reject all bursts of requests once this limit is achieved. Based on the USAR model, we propose a new policy that considers the way users tend to react according to Internet service’s server performance. We define three possible policies as a function of the response time of a service ( ):
���� ��� : reject bursts of user action classes � , � and � . � � � � : reject bursts of user action classes � , � , � and . � : reject bursts of all user action classes. In these rules, � , � and are response time values deter-
mined based on empirical results and literature criteria [11].
This policy is based on the idea that users who have more impatient profile will react faster (that is, reload or submit a different request) than other users when the server presents high response times, degrading server’s performance. The policy has a multiple criteria rule, minimizing the rejection impact, once less users may have bursts of requests refused from the QoS admission control policy. In summary, this policy has the premise that, under overload scenarios, it may be better to give priority to users who have more chance to wait for the response to their requests, minimizing the number of unhappy users.
4.2 Session-Based Approach The session-based admission control rejects user sessions when the policy identify a rejection rule. Traditional policies employ a single response time threshold and start to reject all user sessions once this limit is reached. The burstbased admission control policy may affect all users, but the session-based policy is different, since the trend is to affect fewer users. Considering this, reactivity may be important to identify which user sessions have to be dropped. Using the USAR model we propose a new admission control policy that considers how users tend to react according to Internet service’s server performance. We monitor the average response time ( ) and the user session profile for each session ( ), i.e., the average user class of each burst of his/her session that have already been served. We define the following three criteria: � and � @ @ : reject user sessions with more impatient profile ( � - average user action � classes of , and . � and � A : reject user sessions with a A balanced profile (nor non-impatient neither � patient) � ). � - average user action classes of , , and : reject all user sessions. This policy is based on the same idea presented in the reactive burst-based policy, however applied to session-based control mechanism.
����
����
� � � �� ��
��
���� �� � �� � �
���� �
���
4.3 Two-Level Approach We propose a two-level approach which presents a hybrid mechanism that adopt both burst and session-based strategies. The idea of this new admission control policy is to put together the advantages of each strategy in a balanced approach. In the session-based approach, rejection of sessions is drastically started as response time grows. In the two-level approach, first of all, burst rejection is started, before the rejection of sessions. This strategy smooths the session rejection through a previous step. Once the burst rejection is not effective to slow down the response time session rejection is activated. We define the following criteria: @ � @ : reject bursts of user action classes � , and .
�� � � � �
� @ � � � @ : reject bursts of user action classes � , � �, � and . @ : reject of all user action classes. @ �� A � ��� A bursts and ���� � � @ : reject user sessions with more impatient � profile (� � � - average user action classes of , � and � ). � A � � A and ���� � � A : reject user sessions with a balanced profile (nor non-impatient neither A � patient)� - � ��� - average user action classes of , � � , and . � A : reject all user sessions. This policy rejects both bursts and sessions, but according to different limit values, balancing the rejection of them.
5 Experimental Evaluation This section explains how we evaluate the new policies proposed. We briefly describe the simulator used in our experiments. We explain our methodology to evaluate the new QoS policies and present the simulations and results.
5.1 Simulating Reactivity and QoS Policies We have implemented a simulator named USARQoS [16] using the Simpack Toolkit [9], a simulation environment based on C++. The architecture of USAR-QoS is event-driven and mimics a complete Web system, consisting of the workload generator that supports reactivity and the web application environment. We use a synthetic workload as input for the simulation model based on the TPC-W benchmark [1, 13]. The simulator is built respecting modularity, allowing its extension with new burst or session admission control policies and/or other features, such as scheduling policies.
5.2 Methodology In order to evaluate the effectiveness of the proposed reactive QoS policies, we have implemented them in the USAR-QoS and change it to log the following important metrics: Throughput: we measure both throughput of requested and replied bursts (requests) in the point of view of the server. The requested bursts throughput represents the rate in which requests arrive at the server. The replied throughput represents the rate in which requests are answered by the server. Response time: the user perceived response time, comprising the time interval between the submission of the request and the time when the client finishes to receive the response. Number of active bursts and sessions: the number of bursts requested to the server but not yet responded, for each period of time, or the number of sessions initiated but not yet finished.
Server queue size and Server utilization: the number of bursts waiting to be served and the proportion of time the server is busy. Cumulative number of sessions: the number of sessions completed or rejected by the admission control mechanism. Bursts rejected and expired: the number of bursts rejected by the admission control and the number of bursts from which their response time are greater than the time one user waits for it at that moment.
� �
As explained in Section 4, each reactive QoS policy has a set of values ( , , and ) that define the admission control functioning. These values must be carefully chosen since the effectiveness of each policy depends on this factor. We adopt a 10-second threshold for a user loosing attention and interrupting the [11]. We use � interaction ���the� � ��� following parameters: � , ��� � @ , and � 1 A � ��� �, for policies; @ burst @ A � A and ��session-based � � � �� and � � , and � , for the two-level approach. We simulate several scenarios using USAR-QoS to observe how the application server behaves under various workloads. We discuss three scenarios below. They use workloads with different distributions of user action classes. Each workload has 5000 TCP-W-based sessions with an average rate of 1 session initiated per second, varying uniformly from 0.5 to 1.5. It is important to emphasize that the number of simultaneous users is defined by the number of active sessions over the experimental time. Table 1 shows the distribution of user reaction classes for each workload.
�
�
�
Workload 1 2 3
�
A 5% 22% 30%
B 10% 15% 15%
C 10% 10% 15%
�
D 15% 6% 15%
��
E 15% 10% 10%
�
F 15% 15% 10%
G 30% 22% 5%
Table 1: User reaction classes distribution for each workload
Workload 1 has predominance of patient classes, once 60% of it consists of classes E, F and G. The second one has a balanced distribution over patient and impatient scale, presenting a similar distribution of classes A and G, B and F, C and E. And workload 3 represents an impatient profile with 60% of classes A, B and C. We notice the differences between each workload when we simulate them. Figure 3 shows experimental simulations where no admission control policy is active in the simulator. (a) shows the average response time and (b) and (c) the average throughput for Workloads 1 and 3. Workload 1 presents an intensive load to the server but not so heavy as the other workloads. Workload 3 applies the heaviest load to the server, since its mean response time is greater most of the time than the others and its average throughput of expired bursts is the biggest one. It is important to notice that the average response throughput is the same for each workload since it is dependent of the server capacity that has a limit value, achieved most of the time.
Mean Response Time (sec) over Time (sec)
Bursts Throughput Rate (bursts/sec) over Time (sec) [smooth bezier]
Bursts Throughput Rate (bursts/sec) over Time (sec) [smooth bezier]
160 Bursts Throughput (bursts/sec)
Mean Response Time (sec)
140
Bursts Requested Throughput Bursts Replied Throughput Bursts Expired Rate Bursts Rejected Rate
160
120 100 80 60 40 20
140 120 100 80 60 40 20
0 1000
2000
3000
4000
5000
6000
7000
120 100 80 60 40
0 0
1000
2000
Time (sec)
(a) Average Response Time
140
20
0 0
Bursts Requested Throughput Bursts Replied Throughput Bursts Expired Rate Bursts Rejected Rate
160 Bursts Throughput (bursts/sec)
Workload 1 Workload 2 Workload 3
3000
4000
5000
6000
Time (sec)
(b) Average Throughput (Workload 1)
7000
0
1000
2000
3000
4000
5000
6000
7000
Time (sec)
(c) Average Throughput (Workload 3)
Figure 3: No Admission Control
We simulate each policy for each workload configuration. We do not show all the graphs obtained due to lack of space.
5.3 Burst-Based Admission Control Figure 4 shows a scenario where non-reactive admission control is activated. In (a) we see the average response time and we observe an upper-bound of 9 seconds, once the admission control is set to be activated at this limit. This upper-bound could be set to a larger number, however we decide to use this because the literature adopts 10-second as the threshold of user tolerance to response time [11]. In (b) we have the average throughput. In Figure 5 we observe the system behavior in a reactive burst admission control scenario. In (a) we see that the average response time grows and then established after the activation of the reactive control admission policy ranging from 4 to 7.5 seconds. In (b) we see clearly that the rate of bursts rejected by the admission control elevates as the average response time raises. Compared to the approach without admission control, the experiment with reactive admission control policy shows a decrease of 40% to 90% in the average response time. Comparing the two approaches that implements admission control we see that the reactive admission control achieves a better result, once it keeps the user satisfaction and reduces the average response time significantly (more than 20%). A similar behavior may be observed for Workloads 2 and 3. The rate of bursts rejected during server’s overload varies from 0% to 40%, for Workload 2, and from 0% to 50%, for Workload 3. For both workloads the user satisfaction rate has decreased since there is an increase in the burst expired rate. Comparing to the approach without admission control, the experiments with reactive admission control shows a significant improvement (from 95%) in the average response time. Comparing the two approaches that implement admission control, we identify that the reactive admission control achieves a better result again, once it reduces the average response time in more than 30% with a little better user satisfaction rate.
5.4 Session-Based Admission Control Figure 6 presents the average response time for the experiments with session admission control for Workload 1. For the non-reactive scenario, the average response time varies from 3.5 to 9 seconds after established, and for the reactive one, it ranges from 2 to 7.5 seconds after established. For both experiments the amount of unsatisfied users is similar to the scenario without admission control. We may notice that there is a trade-off here as the reactive admission control based on session has achieved a better result than the non-reactive one, reducing the average response time in at most 20%. The reactive session-based admission has rejected 10% more sessions than the nonreactive one, but it is interesting to notice that this difference does not affect the user satisfaction. The server utilization during the observed time has been maximum, as expected. As the main conclusions for both workloads are the same, only the Workload 1 is necessary to demonstrate our results in this section.
5.5 Two-Level Admission Control We implemented the two-level admission control approach in the USAR-QoS and applied it over the same workload scenarios. Figure 7 presents the simulations for Workload 1, where (a) shows the average response time, (b), the throughput, and (c), the accumulative number of sessions. The number of rejected sessions in (b) is lower than the values for the experiment with just the session-based approach. Average response time, that varies over time, from 2 to 6.5 seconds during server overload, shows a better result than the one obtained for the session-based approach, achieving more than 30% of reduction in the response time of the nonreactive policy. Comparing it to the reactive session-based scenario, there is a low upper-limit value in the average response time, showing that the combined policies present an interesting behavior to the other policies presented.
Response Time over Time (sec)
Bursts Throughput Rate (bursts/sec) over Time (sec) [smooth bezier]
10 Mean Response Time (sec) Bursts Throughput (bursts/sec)
8 Response Time (sec)
Bursts Requested Throughput Bursts Replied Throughput Bursts Expired Rate Bursts Rejected Rate
160
6
4
2
140 120 100 80 60 40 20
0
0 0
1000
2000
3000
4000
5000
6000
7000
0
1000
2000
Time (sec)
3000
4000
5000
6000
7000
Time (sec)
(a) Average Response Time
(b) Average Throughput
Figure 4: Non-Reactive Burst-Based Admission Control (Workload 1) Response Time over Time (sec)
Bursts Throughput Rate (bursts/sec) over Time (sec) [smooth bezier]
10 Mean Response Time (sec) Bursts Throughput (bursts/sec)
8 Response Time (sec)
Bursts Requested Throughput Bursts Replied Throughput Bursts Expired Rate Bursts Rejected Rate
160
6
4
2
140 120 100 80 60 40 20
0
0 0
1000
2000
3000
4000
5000
6000
7000
0
1000
2000
Time (sec)
3000
4000
5000
6000
7000
Time (sec)
(a) Average Response Time
(b) Average Throughput
Figure 5: Reactive Burst-Based Admission Control (Workload 1) Response Time over Time (sec)
Response Time over Time (sec)
10
10 Mean Response Time (sec)
Mean Response Time (sec) 8 Response Time (sec)
Response Time (sec)
8
6
4
2
6
4
2
0
0 0
1000
2000
3000
4000
5000
6000
7000
0
1000
2000
Time (sec)
3000
4000
5000
6000
7000
Time (sec)
(a) Non-reactive
(b) Reactive
Figure 6: Average Response Time with Session-Based Admission Control (Workload 1) Response Time over Time (sec)
Bursts Throughput Rate (bursts/sec) over Time (sec) [smooth bezier]
Accumulative Number of Sessions over Time (sec)
10
4500 Bursts Throughput (bursts/sec)
8 Response Time (sec)
Bursts Requested Throughput Bursts Replied Throughput Bursts Expired Rate Bursts Rejected Rate
160
6
4
2
140
Accumulative Number of Sessions
Mean Response Time (sec)
120 100 80 60 40 20
0
3500 3000 2500 2000 1500 1000
0 0
1000
2000
3000
4000
5000
Time (sec)
(a) Average Response Time
6000
7000
Accumulative Number of Rejected Sessions Accumulative Number of Completed Sessions
4000
500 0
0
1000
2000
3000
4000
5000
6000
7000
Time (sec)
(b) Average Throughput
Figure 7: Reactive Two-Level Admission Control (Workload 1)
0
1000
2000
3000
4000
5000
6000
Time (sec)
(c) Accumulative number of sessions
7000
6 Conclusion This paper addresses the use of admission control techniques based on user reactivity to guarantee QoS in Internet services. We have designed and implemented the USAR-QoS simulator which allows the evaluation of new QoS strategies considering the dynamic interaction between client and server sides in Internet services. The simulation shows the benefits of the reactive policies, which indicates QoS improvement under overload scenarios. The results show that the premises adopted to model the reactive admission control policies are effective, proving that the idea of reactive admission control minimizes the overload impact. We can observe this improvement by the significative reduction in the average response time perceived by users. On the other side, the number of expired bursts has reduced in the reactive policy scenario, what adds more value to the new approach proposed in this work. The reactive admission control policies proposed in this work lead to better response time rates, preserving the user satisfaction, as measured by the proposed metric. The reduction varies from 15 to 50%, with an average of 30%. From the results we may conclude that there is a relevant improvement in the QoS of the reactive Internet systems through the use of reactive admission control policies. As part of ongoing work, we plan to evaluate the use of reactivity in scheduling policies and other QoS strategies.
7 Acknowledgements This work was (partially) developed in collaboration with Hewlett Packard Brazil R&D (Project CAMPS HPUFMG-2005).
References [1] Tpc - transaction processing council. tpc-w benchmark. http://www.tpc.org/ tpcw/. [2] A. Balachandran, G. Voelker, P. Bahl, and P. Rangan. Characterizing user behavior and network performance in a public wireless lan. In Proceedings of ACM SIGMETRICS’02, 2002. [3] P. Barford and M. Crovella. Generating representative web workloads for network and server performance evaluation. In Proceedings of the 1998 ACM SIGMETRICS joint international conference on Measurement and modeling of computer systems, pages 151–160. ACM Press, 1998. [4] N. Bhatti and R. Friedrich. Web server support for tiered services. IEEE Network, 13(5):64–71, 1999. [5] R. Carter and L. Cherkasova. Detecting timed-out client requests for avoiding livelock and improving web server performance. In Proc. of 5th IEEE Symposium on Computers and Communications, pages pp
2–7, Antibes, FRANCE, 2000. IEEE Computer Society. [6] L. Cherkasova and P. Phaal. Session-based admission control: A mechanism for peak load management of commercial web sites. IEEE Trans. Comput., 51(6):669–685, 2002. [7] C. Costa, I. Cunha, A. Borges, C. Ramos, M. Rocha, J. Almeida, and B. Ribeiro-Neto. Analyzing client interactivity in streaming media. In Proceedings of the 13th World Wide Web Conference, 2004. [8] D. G. Feitelson. Workload modeling for performance evaluation. In M. C. Calzarossa and S. Tucci, editors, Performance Evaluation of Complex Systems: Techniques and Tools, pages 114–141. Springer-Verlag, Sep 2002. Lect. Notes Comput. Sci. vol. 2459. [9] P. A. Fishwick. Simpack: Getting started with simulation programming in c and c++. In Winter Simulation Conference, pages 154–162, 1992. [10] A. Iyengar, E. MacNair, and T. Nguyen. An analysis of web server performance. In In Proceedings of GLOBECOM ’97, Phoenix, Arizona, USA, 1997. [11] D. Menasc´e, V. Almeida, and L. Dowdy. Performance by Design. Prentice Hall, 2004. [12] D. Menasc´e, V. Almeida, R. Riedi, F. Ribeiro, R. Fonseca, and W. M. Jr. A hierarchical and multiscale approach to analyze e-business workloads. Perform. Eval., 54(1):33–57, 2003. [13] D. A. Menasc´e. Testing e-commerce site scalability with tpc-w. In Int. CMG Conference, pages 457–466, 2001. [14] D. Mosberger and T. Jin. httperf–tool for measuring web server performance. SIGMETRICS Perform. Eval. Rev., 26(3):31–37, 1998. [15] A. Pereira, G. Franco, L. Silva, W. Meira, Jr., and W. Santos. The usar characterization model. In Proceedings of the IEEE 7th Annual Workshop on Workload Characterization (WWC-7), Austin, Texas, USA, 2004. IEEE Computer Society. [16] A. Pereira, L. Silva, W. Meira, Jr., and W. Santos. Assessing the impact of user reactivity on the performance of web applications. Technical Report RT.DCC 007/2005, Department of Computer Science, Federal University of Minas Gerais, Brazil, April 2005. [17] P. Selvridge, B. Chaparro, and G. Bender. The world wide wait: Effects of delays on user performance. In Proceedings of the IEA 2000/HFES 2000 Congress, 2000.