land Article
Assessing Riparian Vegetation Condition and Function in Disturbed Sites of the Arid Northwestern Mexico Lara Cornejo-Denman 1 , Jose Raul Romo-Leon 1, * ID , Alejandro E. Castellanos 1 ID , Rolando E. Diaz-Caravantes 2 , Jose Luis Moreno-Vázquez 2 ID and Romeo Mendez-Estrella 1 1
2
*
ID
Departamento de Investigaciones Científicas y Tecnológicas, Universidad de Sonora, Hermosillo 83000, Mexico;
[email protected] (L.C.-D.);
[email protected] (A.E.C.);
[email protected] (R.M.-E.) El Colegio de Sonora, Hermosillo 83000, Mexico;
[email protected] (R.E.D.-C.);
[email protected] (J.L.M.-V.) Correspondence:
[email protected]; Tel.: 11+52-662-259-2169
Received: 27 November 2017; Accepted: 18 January 2018; Published: 22 January 2018
Abstract: Transformation or modification of vegetation distribution and structure in arid riparian ecosystems can lead to the loss of ecological function. Mexico has 101,500,000 ha of arid lands, however there is a general lack of information regarding how arid riparian ecosystems are being modified. To assess these modifications, we use eight sites in the San Miguel River (central Sonora) to analyze (1) riparian vegetation composition, structure and distribution using field sampling and remote sensing data from Unmanned Aerial Vehicles (UAV); (2) productivity (proxies), using vegetation indices derived from satellite data; and (3) variability posed by riparian vegetation and vegetation adjacent to riparian habitats. The development of a simple yet informative Anthropogenic-disturbance Index (ADI) allowed us to classify and describe each study site. We found sharp differences in vegetation composition and structure between sites due to the absence/presence of obligate-riparian species. We also report significant difference between EVI (Enhanced Vegetation Index) values for the dry season among vegetation types that develop near the edges of the river but differ in composition, suggesting that land cover changes form obligate-riparian to facultative-riparian species can lead to a loss in potential productivity. Finally, our tests suggest that sites with higher disturbance present lower photosynthetic activity. Keywords: riparian ecosystems; Sonoran desert; remote sensing; land cover/land use
1. Introduction It has been thoroughly documented that human activities, which modify water availability and promote drastic habitat modifications, have caused dramatic changes in riparian vegetation of arid ecosystems in the American southwest [1–4]. Due to the similarities between geographic and ecological conditions of this region and the Mexican northwest, it is reasonable to expect that the disturbance processes could be similar, although fewer studies of riparian ecosystems in the Mexican northwest have been conducted. Water availability in the Mexican northwest is critical, since many of its watersheds and groundwater sources are overexploited, due to intensive use by economic activities such as agriculture and cattle ranching [5–7]. Moreover, previous work suggests that water management practices could potentially modify the structure and function of key ecosystems in arid environments [3,8–10]. In this sense, recent studies describe how groundwater depth restricts the establishment of riparian vegetation in watersheds located in arid environments of central Sonora (northwestern Mexico), particularly in
Land 2018, 7, 13; doi:10.3390/land7010013
www.mdpi.com/journal/land
Land 2018, 7, 13
2 of 24
places where high levels of groundwater depth coincide with a denser distribution of agricultural wells [8]. Groundwater levels can also affect surface runoff, possibly narrowing the river channel; a negative correlation has been found between channel width and the percentage of agricultural land use along the river sides, in several rivers in Sonora [11]. Alteration of groundwater levels and surface runoff can prevent the establishment of obligate-riparian species such as Salix gooddingii and Populus fremontii [12], sometimes causing the complete loss of riparian vegetation or its replacement by drought tolerant desert species like Prosopis sp. or Acacia sp.; these changes in composition can have several consequences on the ecosystem: loss of local biodiversity [13], increase the susceptibility to invasive species [3,14], loss of riparian native corridors [15,16] and decrease in vegetation indices values [17]. Riparian ecosystems are often considered hotspots for ecosystem services [18–20]. In arid environments, this is evident since most economic, social and cultural activities are closely tied to this systems [21–23]. Therefore, riparian ecosystems in arid environments are highly dynamic in terms of changes on land use and land cover [24,25]. These changes often result in the modification of the structure and function of riparian vegetation due to active change (e.g., the clearing of riparian vegetation to establish agricultural areas) or changes introduced by constant pressure posed by human activities (e.g., Cattle Ranching) [11,26,27]. For arid environments, there is a lack of information regarding the assessment of disturbance, however, it is of utmost importance to understand how different disturbance-causing activities are changing riparian habitats in Sonora, and how these changes could be compromising the provision of ecosystem services. Since agriculture and cattle ranching are the main subsistence and commercial activities in the region and because these activities are registered to be the ones that cause the greatest changes in ecosystems all over the state [28,29], we consider them as playing an essential role when assessing disturbance in riparian habitats. Also, for a region with critical water availability issues it is important to have a better understanding of how human activities are changing riparian ecosystems, thus, the monitoring of different vegetation parameters and the generation of a disturb-based classification method can help assess the ecological condition of these ecosystems in Sonora. Different remote sensing techniques can be used to identify areas where obligate-riparian vegetation is being transformed in terms of its composition, aerial images can be especially useful to discriminate vegetation types along rivers [30,31]; at the same time satellite image analysis can be used to derive vegetation indices [32–34] which can provide important information about the behavior of the ecosystem in terms of its productivity. Previous studies using remote sensing suggest a trend towards the modification of riparian vegetation, due to the establishment on facultative species in north western Mexico [8,35]. However, assessments using high spatial resolution imagery to evaluate the previous (using UAV’s) are scarce. The objective of the present study was to analyze disturbance and its effects on function and structure of riparian habitats in arid regions of northwestern Mexico. For the previous we explore the combined use of satellite imagery, Unmanned Aerial Vehicles (UAV) photography and field vegetation sampling to assess the differences and similarities within and between 8 disturbed sites along the San Miguel River in central Sonora. Also, we evaluated several characteristics of riparian vegetation and the adjacent desert scrub: composition, diversity, cover and photosynthetic activity (represented by the Enhanced Vegetation Index, EVI). Finally, we assessed the disturbance degree by the development and application of the ADI. By following the suggested approach, we will be able to assess how disturbance at the local level affects riparian vegetation variables (composition, structure, diversity and cover) and how changes in these relate to shifts in function (photosynthesis) at the landscape level. 2. Materials and Methods In order to assess disturbance of riparian habitats we developed specific qualitative parameters and applied them during site visits. Following this, we evaluated structure, composition and cover of
Land 2018, 7, 13
3 of 24
vegetation on different sites along the river by field sampling. To complement site description, we used aerial imagery to define which vegetation types were present in each site and determine plant cover. Finally, satellite imagery was used to derive the EVI. Land 2018, 7, x FOR PEER REVIEW
3 of 24
2.1. Study Area
used aerial imagery to define which vegetation types were present in each site and determine plant The San Miguel riverimagery (SMR) was is located the central cover. Finally, satellite used toin derive the EVI.part of the northern Mexican state of Sonora
(Figure 1), between 30◦ 45.750 N–29◦ 6.50 N latitude and 111◦ 4.110 W–110◦ 21.10 W longitude and it is a sub 2.1. Study watershed of Area the much larger Sonoran river watershed. It has an extension of 3845 km2 . These two TheMiguel San Miguel (SMR) are is located in the sources central part the northern Sonora rivers (San andriver Sonora) the main of ofwater for theMexican capitalstate cityofof Hermosillo. ◦ (Figure 1), between 30°45.75′N–29°6.5′N latitude and 111°4.11′W–110°21.1′W longitude and it is sub 8 study The mean annual temperature is of 21 C and the mean annual precipitation is of 421 mm. aThe 2. These two watershed of the much larger Sonoran river watershed. It has an extension of 3845 km sites are located along the San Miguel River, two in the northern part, two in the northern-central, two in rivers (San Miguel and Sonora) are the main sources of water for the capital city of Hermosillo. The the southern-central and two in the southern part. According to Shreve and Wiggins [36] classification, mean annual temperature is of 21 °C and the mean annual precipitation is of 421 mm. The 8 study the SMR is located in the Plains of Sonora, which is designated as Arbosuffrutescent Desert and it is sites are located along the San Miguel River, two in the northern part, two in the northern-central, characterized the presence of Olneya trees and Encelia farinosa Classification made by two in theby southern-central and two intesota the southern part. According to bushes. Shreve and Wiggins [36] the National Institute of Geography and theisfollowing of vegetation and land classification, the SMR is located in theStatistics Plains of establishes Sonora, which designatedtypes as Arbosuffrutescent and itoak is characterized by the presence of Olneya tesota trees and mesquite Encelia farinosa bushes. uses Desert in the area: forest, oak-pine forest, microphyllous desert scrub, forest, xerophilous Classification made by the National Institute of Geography and Statistics establishes the following mesquital, subtropical scrub, native and introduced grasslands, riparian vegetation and agriculture. types of vegetation and landin uses the area: oak forest, oak-pine forest, ranching. microphyllous desert The main economic activities theinregion are agriculture and cattle There is ascrub, total of 8266 mesquite forest, xerophilous mesquital, subtropical scrub, native and introduced grasslands, riparian hectares of irrigated lands, 75% of which correspond to forage production [21]. These activities have vegetation and agriculture. The main economic activities in the region are agriculture and cattle developed in the region over hundreds of years, however in the past decades, due to the technological ranching. There is a total of 8266 hectares of irrigated lands, 75% of which correspond to forage advances and the intensive use of riparian habitat, in thethe system become very in terms production [21]. These activities have developed regionhas over hundreds ofdynamic years, however in of land coverthe shifts. On top of this, it has been reported that the SMR aquifer shows signs of overexploitation past decades, due to the technological advances and the intensive use of riparian habitat, the based on recharge-extraction analyses; official data reported antop annual of 1,500,000 system has become very dynamic in terms of land cover shifts. On of this,deficit it has been reported m3 [7], 3 that the SMR aquifer shows signs of overexploitation based on analyses; although the most recent update reports an availability ofrecharge-extraction 17,508,107 m [5], whichofficial arises some 3 [7], although the most recent update reports an data reported an annual deficit of 1,500,000 m confusion and concern due to the fact that this last number was based on a 2008 hydrogeological study availability of 17,508,107 m3 [5], which arises some confusion and concern due to the fact that this last elaborated for a mining project. Given the above, riparian habitats show different scenarios where number was based on a 2008 hydrogeological study elaborated for a mining project. Given the above, water availability has become an economical [22], social [21,23] and ecological [8,37] issue that needs riparian habitats show different scenarios where water availability has become an economical [22], to besocial addressed and land [21,23] by andmanagers ecological [8,37] issueowners. that needs to be addressed by managers and land owners. The The study sites where selected satellite image observation and exploration field trips. study sites where selected through through satellite image observation and exploration field trips. FinalFinal selection was based on the presence of several land uses of interest: agriculture, livestock selection was based on the presence of several land uses of interest: agriculture, livestockgrazing, grazing, human settlements, roads, recreational the presence of riparian vegetation. human settlements, roads, recreational activity activity and theand presence of riparian vegetation.
Figure 1. of of study area. Figure 1.Location Location study area.
Land 2018, 7, 13
4 of 24
2.2. Disturbance Assessment To establish the degree of disturbance on each site, we developed a series of qualitative criteria regarding (1) the intensity and type of human activities; (2) the state of the riparian vegetation; (3) the presence/absence of surface water. Classification of sites was made through applying the ADI, which evaluates the sites according to several criteria (Table 1). A number was assigned to indicate the presence, absence, evidence or intensity of the features observed: superficial water flow, Populus and/or Salix species, cattle, agriculture, roads and/or human settlements and recreational activity. Although the San Miguel River is an intermittent river [38,39], superficial water flow can be continuous during rainy season. Average precipitation in the region during the sampling year was of 382 mm [40]. Since field sampling was done through the rainy season, superficial water flow was expected to be present and, thus, it was considered among the classification criteria. Populus and Salix species are particularly susceptible to groundwater fluctuations and their absence could be an indicator of groundwater scarcity. Livestock and agriculture are the most common economic activities in the area, so their presence and closeness to the river was considered for site classification. Human settlements and recreational activity can also be sources of disturbance so they were also considered for site classification. The selection of the criteria used to develop this index is based on literature that evaluates human water use and its impacts on river flow in the American southwest; these studies report that overexploitation of rivers has caused a reduction in the presence of riparian trees such as Populus fremontii and Salix gooddingii [12,13]. Agriculture, livestock grazing, human settlements and recreational activity were also considered as criteria since these are the main disturbance types reported for riparian ecosystems [4,24,41]. Criteria selection and structure for the index was also based on the environmental condition of riparian areas, as a methodology reported by González and García [42]. The criteria and interpretation of the index values are explained on Tables 1 and 2. Table 1. Criteria used to determine the ADI. Yes
VALUE
Little/Few
VALUE
No
VALUE
Superficial water flow
Continuous flow
1
Intermittent flow
2
Dry riverbed
3
Presence of Populus and/or Salix species
High frequency of these species
1
Lower frequency than other trees
2
Absence of these species
3
Presence or evidence of cattle
Absence of cattle
1
Evidence of grazing, feces, or buffel grass
2
Cattle was seen near or around the river
3
Agriculture
No agricultural areas were seen
1
Presence of agricultural areas smaller than 100 sq. meters
2
Agricultural areas less than 500 m from the river
3
Roads and/or human settlements
Study site located 500 m away from any road or house
1
Presence of roads but no houses
2
Houses and roads near the river
3
Recreational activity
No human presence or infrastructure
1
Human presence but no infrastructure
2
Evidence of human presence (parking places, grills, trash cans, trash)
3
Land 2018, 7, 13
5 of 24
Table 2. Interpretation of the ADI values. ADI
Disturbance Category
6–8
Low: there’s no observable evidence of anthropogenic disturbance. Superficial water flow is continuous (during rainy season); vegetation is dominated by obligate-riparian species.
9–11
Low-medium: there’s an observable evidence of human activities in low intensity; vegetation is dominated by obligate-riparian species.
12–14
Intermediate: superficial water flow may be intermittent, human activities diversify; vegetation is characterized by the presence of facultative-riparian species along with obligate-riparian species.
15–17
Medium-high: superficial water flow is intermittent or the riverbed is dry, human activities diversify, absence of obligate-riparian species and dominance of non-riparian species.
18
High: dry riverbed, human activities intensify, absence of obligate-riparian species and dominance of non-riparian species.
2.3. Field Measurements and Derivation of Diversity Index Vegetation description on each site was made through the registry and derivation of several variables (Table 3). Field sampling was done following the relevé method and protocol [43]. Two major vegetation types where sampled on each site (riparian vegetation and adjacent desert scrub), the purpose of this vegetation description was to compare the variation of several vegetation characteristics of riparian sites and of the adjacent desert scrub sites. Table 3. Variables used for the vegetation description. Variable
Description
How Was It Measured?
The list of species found in each stand.
Field identification and registry, herbarium identification.
Cover
Vertical crown or shoot-area projection for each vegetation strata (herbs, shrubs and trees) per plot.
Continuous (65%) = crown touching. Intermittent (30–64%) = interlocking or touching crowns interrupted by openings. Open (29%) = crowns not touching or infrequently touching.
Richness
Total number of species per stand (for tree and shrub strata only).
Count the different species present on each stand.
Diversity
Diversity of each stand (for tree and shrub strata only).
Represented by the Shannon-Weiner diversity index.
Tree and shrub species with the highest number of individuals per stand.
Count the number of individuals per species.
Composition
Dominance
Two sampling units (stands) were established on each site, one for riparian vegetation and another for the adjacent desert scrub located approximately 200 m from the first stand and in the opposite direction of the river, this distance was considered enough to go past the transition area between riparian vegetation and the adjacent desert vegetation. San Juan Ranch was the only site where desert scrub was not sampled, due to time and climate restrictions. Field sampling consisted in identifying vegetation strata and registering composition and cover for each. First, a 30 × 30 m square was delineated, in which tree species where registered along with the number of individuals per species, cover was estimated for the whole tree strata. Then, a second square of 10 × 10 m was delineated inside the first one and shrub species, number of individuals and strata cover were registered. Finally, a third square of 1 × 1 m was delineated inside the second square and the number of different herbaceous species and strata cover were registered. Two repetitions were made, resulting in a 30 × 90 m (three repetitions per vegetation strata in each sample) stand with a total of 2700 sq. meters sampled for each vegetation type on each site. For each sampling site we calculated diversity of the tree and shrub strata by the derivation of the Shannon-Weiner diversity index [44]. Diversity of the shrub and tree strata for each stand was estimated using the Shannon-Weiner diversity index:
Land 2018, 7, 13
6 of 24
s
H 0 = − ∑ pi log2 pi i =1
where S is the total number of species, pi the proportion of individuals of each species based on the total of individuals (ni/N), ni is the number of individuals of each species and N the total of all individuals of all species. 2.4. Aerial Imagery Sampling and Mosaicking Aerial imagery acquisition requires two processes. First, obtaining aerial images in the field and second, processing those images for the orthomosaic generation. A total of 13 flights were performed in the different study sites, using a UAV (Unmanned Aerial Vehicle). See Supplementary Materials for spatial and temporal specifications of each flight (Table S1). The following subsections describe the process of the image acquisition and orthomosaic generation. 2.4.1. Aerial Imagery Sampling For the acquisition of aerial images several flights were performed at each study site. See Supplementary Materials for flight requirements and image specifications (Table S2). All flights were performed during growing season (August, September and October 2016) with the purpose of recording vegetation cover at its greatest; and during the day (between 11 a.m. and 2 p.m.) to ensure appropriate light conditions. 2.4.2. Mosaicking process The image processing is based on pattern recognition, which establishes a relationship between a pattern (vector of features describing an object) and a class label; those features can be spectral reflectance, texture, emittance values from optical imagery, or geographical features and the object can be a single pixel or a set of adjacent pixels forming a geographical entity [45]. The mosaicking process is performed by photogrammetry software. The process consists on finding common points (keypoints) between the images. When the same keypoint is found on 2 different images they are matched and this will generate a 3D point (Pix4D). These 3D points are needed to generate a Point Cloud from which a Digital Surface Model and an Orthomosaic will derive. This process requires a high overlap between images, which in most cases is at least 75% (Pix4D). Since the UAV has a built-in GPS, all images taken were automatically georeferenced and no ground control points were needed. Georeferenced images from each flight where added to the photogrammetry software for the stitching process, resulting in a total of 13 orthomosaics with an approximate area of 5 hectares each. The spatial resolution expected from the orthomosaic is of 3 cm. 2.5. Satellite Imagery Satellite data was obtained as a land surface reflectance (LASRC) from the Landsat 8 OLI (Operational Land Imager)/TIRS (Thermal Infrared Sensors) Pre-Collection L1T data type, directly from the United States Geological Survey ‘Earth Explorer’ website; these products are radiometrically calibrated and orthorectified using ground control points and digital elevation model data to correct for relief displacement [46]. Landsat 8 data includes 11 bands, from which 7 of them (1–7) were selected and processed in ERDAS IMAGINE 9.2 to create the final stack. Bands 8, 9, 10 and 11 were not used. Since the study area comprises two Landsat 8 scenes and because we wanted to compare photosynthetic activity variations between two seasons, a total of 4 scenes were chosen for two different dates on 2016: May and September. See Supplementary Materials for scene specifications (Table S3). The vegetation index was derived for the complete four scenes but the only pixels involved in the analysis were those corresponding to the digitalized areas from the orthomosaics, obtained from the UAV analysis previously described.
Land 2018, 7, 13
7 of 24
2.6. Vegetation Index Derivation Vegetation indices (VI) are designed based on the spectral response to light of each type of vegetation; this is how indices can provide qualitative and quantitative measurements that can be used to describe photosynthetic activity, structure characteristics and canopy density, among other variables [47,48]. As explained by the previous references, several VI have been related to structural aspects of vegetation, such as Leaf Area Index (LAI); this parameter is related to the amount of available photosynthesizing biomass. The previous can be used as a theoretical basis to derive Net Primary Production from satellite data, as explained by Running et al. [49]. The Normalized Difference Vegetation Index (NDVI) is commonly used in arid regions because of their strong seasonality change but when vegetation density increases during the growth season NDVI can reflect high values with very little variation, which can be interpreted as a spectral signal saturation [50]. Thus, another vegetation index was selected for this study, the Enhanced Vegetation Index (EVI), which presents higher sensitivity in areas where vegetation is dense and it is less prone to light saturation. Enhanced Vegetation Index (EVI) is derived by using the following equation: EV I = G
ρ N IR − ρred ρ N IR + C1 × ρred − C2 × ρblue + L
where ρ is the surface reflectance with atmospheric correction, L is the canopy background adjustment; C1 and C2 are the aerosol resistance coefficients, as described by [50]. EVI values range from 0 to 1, those closer to 1 indicate a greater density and photosynthetic activity of vegetation, those closer to 0 indicate vegetation is scarce or less productive. Although EVI values do not reflect a direct amount of Net Primary Productivity, it is considered as an accurate measure of photosynthetic activity, which is related to the amount of biomass. 2.7. Land Cover Assessment Once obtained, we used orthomosaics to identify the different vegetation types in the sample areas. Our class scheme (Table 4) was developed using observations from the field (regarding community composition and stand physiognomy) and previous classification studies conducted in the area [8]. In order to simplify the classification scheme, all desert vegetation types adjacent to the river is referred to as “Desert Scrub”, even though the formal designation for the Plains of Sonora region (as described by Shreve and Wiggins 1964 classification) is Arbosuffrutescent Desert. Division of riparian classes (Riparian Vegetation and Riparian Mesquite Woodland) is based mainly on the differences in composition between two classes. Considering that Riparian Vegetation is composed mainly by obligate-riparian species and Riparian Mesquite Woodland by facultative-riparian species [51]. Land cover distinction was done through field observation and comparing the field sampling sites with what was shown on the orthomosaic, thus the field sampling sites served as ground control points. Differentiation between land cover types, on the aerial photography was possible through (1) extensive training on the field and (2) training on the analysis and management of each orthomosaic generated. Therefore, our land cover classification was conducted via “heads up digitizing” analysis through expert knowledge. Some of the main elements of photo interpretation used for this analysis were: color (different tree species vary in color), cover (e.g., riparian mesquite woodland tends to be denser than riparian vegetation), distribution, frequency and pattern (e.g., bare ground patches dominated by columnar cacti like Stenocereus thurberi and Lophocereus schottii).
Land 2018, 7, x FOR PEER REVIEW Land 2018, 7, 13
Land Cover Class
8 of 24 8 of 24
Table 4. Land cover descriptions. TableDescription 4. Land cover descriptions.
Literature
The most important tree species found in riparian ecosystems in Sonora Land Cover Class Description Riparian are Salix goodingii and S. bonplandiana, Prosopis velutina and Populus
Literature
Scott et al. 2009 [11] fremontii. Common shrubs include Hymenoclea The most important tree speciesBaccharis found in salicifolia, riparian ecosystems in Sonora are Salix goodingii and S. bonplandiana, Prosopis monogyra, Acacia constricta and A. farnesiana, Celtisvelutina pallida,and Nicotiana glauca. Riparian Vegetation Scott et al. 2009 [11] Populus fremontii.found Common shrubs include BaccharisProsopis, salicifolia, Hymenoclea Riparian Common vegetation on streamways includes Parkinsonia Shreve and Wiggins, 1964 monogyra, Acacia constricta and A. farnesiana, Celtis pallida, Nicotiana glauca. Mesquite florida, Olneya, Acacia greggii and Acacia occidentalis. Common shrubs [36] Common vegetation found on streamways includes Prosopis, Parkinsonia Woodland Riparian include Celtis pallida, Baccharis sarothroides and Lycium. florida, Olneya, Acacia greggii and Acacia occidentalis. Common shrubs Shreve and Wiggins, 1964 [36] Open scrubland with small, low-branching trees, with irregular colonies of Mesquite Woodland include Celtis pallida, Baccharis sarothroides and Lycium. shrubs and widely spaced columnar cacti (Stenocereus thurberi, Lophocereus Shreve and Wiggins, 1964 Open scrubland Olneya with small, trees,optimum with irregular colonies Desert Scrub schottii). Parkinsonia, and low-branching Prosopis find their conditions, [36] of shrubs and widely spaced columnar cacti (Stenocereus thurberi, alternated with colonies of Larrea. Common shrubs include Phaulothamnus Shreve and Wiggins, 1964 [36] Lophocereus schottii). Parkinsonia, Olneya and Prosopis find their optimum Desert Scrub spinescens, Mimosa laxiflora with and Celtis pallida. conditions, alternated colonies of Larrea. Common shrubs include All herbaceous cover Phaulothamnus spinescens, Mimosa laxiflora and Celtis pallida. This cover was considered as an independent class, due to the amount of Herbaceous identified from the This cover was considered as an independent class, due to the amount of All herbaceous cover identified cover variation between seasons, which has a considerable influence on cover orthomosaic was integrated Herbaceous cover cover variation between seasons, which has a considerable influence on from the orthomosaic was EVI values. in this class. EVI values. integrated in this class. Vegetation
2.8. Cover from the the Combination Combination of of Aerial Aerial and and Satellite Satellite Imagery Imagery 2.8. Cover Estimations Estimations from Cover estimations estimations were were derived derived from from each each orthomosaic. orthomosaic. Orthomosaics Orthomosaics were were displayed displayed on on top top of of Cover the satellite satellite scenes scenes (Figure (Figure 2) 2) and and the the image image pixel pixel was was used used as as the the measuring measuring unit unit for for the the vegetation vegetation the types seen on the orthomosaic, thus, every orthomosaic was divided in a grid of 30 × 30 types seen on the orthomosaic, thus, every orthomosaic was divided in a grid of 30 × 30 m m cells. cells. Orthomosaic area area selection selection consisted consisted in in selecting selecting those those pixels pixels with with more more than than 90% 90% of of visible Orthomosaic visible coverage coverage and excluding excluding pixels pixels with with more more than than 10% 10% of of visual visual errors errors such such as as dark dark parts parts (generally (generally pixels pixels at at the the and edges of the mosaic) or pixels with too much shadow. edges of the mosaic) or pixels with too much shadow.
Figure 2. Left: Left:Orthomosaic Orthomosaicshowing showing river section in Galera Right: Image showing the thethe river section in Galera site.site. Right: Image showing the overover-positioning of orthomosaic on Landsat scene, each square represents a Landsat pixel. positioning of orthomosaic on Landsat scene, each square represents a Landsat pixel.
Estimations were were made made for for each each of of the the 900 900 square meter Landsat Landsat 88 pixels Estimations square meter pixels by by direct direct digitalization digitalization using GIS, starting in the inferior left corner of each pixel and continuing clockwise. Measures were were using GIS, starting in the inferior left corner of each pixel and continuing clockwise. Measures registered for for each each vegetation vegetation type type found found on on each each pixel pixel and and then then added added to to have have aa total total sum sum for for each each registered cover class; this sum was converted into a percentage based on the total area used for digitalization. cover class; this sum was converted into a percentage based on the total area used for digitalization.
Land 2018, 7, 13
9 of 24
2.9. Photosynthesis Analysis on Land Cover Classes Using EVI values as a variable for vegetation function, a comparison was made among all land cover classes, among particular land cover classes of interest and between photosynthetic activity and disturbance. EVI values were selected as described below. Each pixel of the Landsat 8 scenes has a unique EVI value. The interposition of the orthomosaic over the Landsat scene allowed us to discern the vegetation types of each pixel, thus having a precise distinction of the photosynthetic activity for each class, which facilitated its comparison. Not all pixels of the orthomosaics were used for the photosynthesis analysis, only those where the land cover class covered more than 50% of the pixel. This pixel selection was done to guarantee that the photosynthetic activity signal corresponds to a dominant land cover class. 2.9.1. Seasonal Photosynthetic Activity per Land Cover Class Photosynthetic activity variation within each vegetation type was analyzed in order to determine if there’s a significant difference among them. EVI values for both seasons (May and September) and for each land cover class were selected and residuals for change were obtained by subtracting May EVI values from September EVI values. A Kruskal-Wallis test was applied to the residues of each land cover class. This analysis was applied to all land cover classes present in all of the study sites. 2.9.2. Photosynthetic Activity of Riparian Vegetation and Riparian Mesquite Woodland The first step for this analysis was to identify which sites represented Riparian Vegetation and Riparian Mesquite Woodland along the edge of the river. The objective is to compare the physiological response (measured as photosynthetic activity) of two land cover classes that develop in the same area and supposedly have the same resource availability (in this case, water). In order to assess the differences in photosynthetic activity between the two riparian land cover classes (Riparian Vegetation and Riparian Mesquite Woodland), EVI values for both seasons (May and September) were selected and analyzed using two Mann-Whitney tests for each site, one for May-data and another for September-data. 2.9.3. Photosynthetic Activity and Disturbance Photosynthetic activity represented by the vegetation index is an important parameter to assess vegetation condition. Thus, it is important to know how this parameter varies in relation to disturbance. Since the ADI was applied to evaluate the condition of riparian sites, this analysis only includes data from land cover classes developed near the river (Riparian Vegetation and Riparian Mesquite Woodland). In order to establish if there’s a relation between photosynthetic activity values of riparian vegetation and disturbance, a linear regression was applied between EVI average values for September and the ADI values for each site. 3. Results 3.1. Site Classification According to the ADI Results of the Anthropogenic-disturbance Index application are presented on Table 5. Distribution and ranking of study sites are presented on Figure 3.
Land 2018, 7, 13
10 of 24
Table 5. Criteria intensity (Y yes, L/F low or few, N no) registered on each site for derivation of the Anthropogenic-disturbance Index. Superficial Water Flow Y Aguilar Ranch Cienega Living Fences El Cajon Nogalera Galera San Juan Ranch Tomas Ranch
L/F
N
X
Presence of Populus and/or Salix Species Y
N
Y
X X X X X
X X X X
L/F X
X
X X X X X
L/F
Presence or Evidence of Cattle
X X X
N
Agriculture Y
L/F
N
X X
X X X X
X X X X X X
Roads and/or Human Settlements Y X X X X X X X X
L/F
N
Recreational Activity Y
L/F
ADI
Disturbance Category
11 12 12 16 15 11 10 10
Low-medium Intermediate Intermediate Medium-high Medium-high Low-medium Low-medium Low-medium
N X X X
X X X X X
LandLand 2018, 7, 13 2018, 7, x FOR PEER REVIEW
of 24 11 11 of 24
Figure the sub subwatershed. watershed. Figure3.3.Distribution Distributionof of sites sites along along the
The two northernsites siteshave have an an intermediate intermediate level areare approximately at a at The two northern levelofofdisturbance—they disturbance—they approximately 10 km distance from the largest town (Cucurpe) and share the presence of cattle near the river. Both a 10 km distance from the largest town (Cucurpe) and share the presence of cattle near the river. sites present some type of management. Cienega stands out due to the presence of cattle all over the Both sites present some type of management. Cienega stands out due to the presence of cattle all over site. On the other hand, the Living Fences site presents living fence rows made of Salix an Populus the site. On the other hand, the Living Fences site presents living fence rows made of Salix an Populus species in several river sections of the site, all of them in different stages of growth. species in several river sections of the site, all of them in different stages of growth. All central sites present the lowest level of disturbance, low-medium, which was unexpected All central sites present the lowest level of disturbance, low-medium, which was unexpected because most of the sites are ranches were different types of management are definitely present. In because most of the sites are ranches were different types of management are definitely present. spite of this, the vegetation on these sites did not show signs of great disturbance, their main common In characteristics spite of this, the these sites did show signs of greatsuch disturbance, main are: vegetation the presenceon and dominance of not obligate-riparian species as Populustheir fremontii common characteristics are: the presence and dominance of obligate-riparian species such and Salix gooddingii, the presence of a constant superficial water flow and the absence of recreational as Populus fremontii and Salix gooddingii, the presence of a constant superficial water flow and the absence activities. of recreational The twoactivities. southern sites are the ones with the highest level of disturbance (Cajon and Nogalera) The two southern sites are theasones with theofhighest level of disturbance (Cajon andofNogalera) and have certain similarities such the absence obligate-riparian trees and the presence at least andthree havehuman certainactivities similarities such as around the absence of obligate-riparian trees and the presence of at least developed the river. Commercial agricultural activity in Nogalera three human activities river. agricultural activity Nogalera stands out, due to the developed presence of around extensivethe pecan treeCommercial (probably Carya illinoinensis) fieldsin about 500 m away thethe river. El Cajon stands outpecan due totree the(probably presence of intense recreational activity. stands out, from due to presence of extensive Carya illinoinensis) fields about 500 m away from the river. El Cajon stands out due to the presence of intense recreational activity. 3.2. Cover, Composition and Diversity from Field Estimations 3.2. Cover, Composition and Diversity from Field Estimations Field measurements are presented for Riparian Vegetation and Desert Scrub stands on each site. Cover presented as a percentage andfor it was estimated for eachand vegetation and Fieldismeasurements are presented Riparian Vegetation Desert strata Scrub(herbs, standsshrubs on each site. trees). Composition was determined for the bush and tree strata on each site. Diversity was derived Cover is presented as a percentage and it was estimated for each vegetation strata (herbs, shrubs and fromComposition field data applying the Shannon-Wiener diversity index. trees). was determined for the bush and tree strata on each site. Diversity was derived from field data applying the Shannon-Wiener diversity index.
Land 2018, 2018, 7, 7, 13FOR PEER REVIEW Land 2018, 7, xx FOR PEER REVIEW
12 of of 24 24 12
3.2.1. Vegetation Vegetation Strata Strata Cover Cover for for Riparian Riparian Vegetation Vegetation and and Desert Desert Scrub Scrub Stands Stands 3.2.1. 3.2.1. Vegetation Strata Cover for Riparian Vegetation and Desert Scrub Stands Riparian Vegetation Vegetation in in all all sites sites shows shows an an herbaceous herbaceous cover cover of of 50% 50% or or more, more, this this can can be be due due to to Riparian Riparian Vegetation inwas all sites shows anthe herbaceous cover ofShrub 50% or more, this can among be due all to the fact that field sampling done during growing season. cover is variable the fact that field sampling was done during the growing season. Shrub cover is variable among all the fact fieldpercentages sampling was done during growing Shrub cover is variable among all sites, thethat lowest in Aguilar Aguilar Ranch,the Cienega andseason. San Juan Juan Ranch can be be due to to the the constant sites, the lowest percentages in Ranch, Cienega and San Ranch can due constant sites, the lowest percentages in Aguilar Ranch, and[4,11,26,52–55]. San Juan RanchTrees can be duemore to thethan constant presence of cattle cattle and the the negative negative effect it has hasCienega on shrubs shrubs cover 30% presence of and effect it on [4,11,26,52–55]. Trees cover more than 30% presence of cattle and the negative effect it has on shrubs [4,11,26,52–55]. Trees cover more than 30% of of the area in most sites (Figure 4), which indicates certain stability among the canopy. Although tree of the area in most sites (Figure 4), which indicates certain stability among the canopy. Although tree the area in most sites (Figure 4), which indicates certain stability among the canopy. Although tree composition in in all all sites sites varies, varies, canopy canopy stability stability is is important important to to maintain maintain riparian riparian habitat habitat conditions. conditions. composition composition in all sites varies, canopy stability is important to maintain riparian habitat conditions.
Figure 4. 4. Cover Cover percentage percentage for for vegetation vegetation strata strata on on the the riparian riparian vegetation vegetation stands. stands. Figure
Desert Scrub Scrub cover cover (Figure (Figure 5) 5) varies varies greatly greatly among among sites, sites, this this makes makes sense sense given given the the distinct distinct Desert terrain characteristics characteristics of of each each site. site. The The two two most disturbed sites (El Cajon and Nogalera) differ greatly terrain two most most disturbed disturbed sites sites (El (El Cajon Cajon and and Nogalera) Nogalera) differ differ greatly greatly in herbaceous and shrub cover. Shrubs have the highest cover in El Cajon (sampling site was a rocky in herbaceous and shrub cover. Shrubs have the highest cover in El Cajon (sampling site was a rocky rocky hill) and the lowest in Nogalera (sampling site was a plain). Herbaceous cover on the Nogalera site hill) and the lowest in Nogalera (sampling site was a plain). Herbaceous cover on the Nogalera site stands out out as as the the highest highest of of all all sites. sites. Tree strata is is higher higher in the the northern site Cienega (63%) and and lowest lowest stands sites. Tree Tree strata higher in the northern northern site site Cienega Cienega (63%) in the other northern site Living Fences (7%), sampling stand in this last site was a steep rocky hill. in the other northern northern site site Living Living Fences Fences (7%), (7%), sampling sampling stand stand in in this this last last site site was was aa steep steep rocky rocky hill. hill. In contrast contrast with with riparian riparian sites, sites, covers covers for for desert desert scrub scrub are are considerably considerably low. low. In low.
Figure 5. Cover percentage for vegetation strata on the desert scrub stands. Figure 5. 5. Cover Cover percentage percentage for for vegetation vegetation strata strata on on the the desert desert scrub scrub stands. stands. Figure
3.2.2. Shrub and Tree Composition for Riparian Vegetation and Desert Scrub Stands Riparian Vegetation stands represented a dominance of obligate-riparian trees such as Populus fremontii, Fraxinus velutina and Salix gooddingii, for sites Aguilar Ranch, Cienega, Living Fences,
Land 2018, 7, 13
13 of 24
Galera, San Juan Ranch and Tomas Ranch (Table 5). El Cajon and Nogalera sites were dominated by facultative-riparian and non-riparian tree species such as Prosopis velutina and Parkinsonia florida. The bush strata in half of the sites were dominated by naturalized/disturb-indicator species such as Ricinus communis and Nicotiana glauca (Table 6). It is important to note that buffel grass (Cenchrus ciliaris) was present in both southern sites, very close to the river, in low frequency but higher in Nogalera than in Cajon. Nogalera site was the only site where a desert tree (Parkinsonia florida) presented the highest number of individuals in the Riparian Vegetation stand, other Desert Scrub species were also found near the dry riverbed such as Cylindropuntia leptocaulis and Lophocereus schottii, although in low frequency. Desert Scrub stands are dominated by facultative-riparian and desert species (Table 7). Some bushes such as Celtis pallida share their distribution between stands and are found along almost every site. Facultative-riparian tree Prosopis velutina was the most common tree found in both the riparian and desert habitats, most of the time having a higher number of individuals on the Desert Scrub stands, except for sites El Cajon and Nogalera, where mesquite trees were present in a much higher frequency in the Riparian Vegetation stands than in the Desert Scrub stands.
Land 2018, 7, 13
14 of 24
Table 6. Dominant bush and tree species by number of individuals in Riparian Vegetation stands for each site. Aguilar Ranch
Cienega
Living Fences
El Cajon
Nogalera
Galera
San Juan Ranch
Tomas Ranch
Bushes
Ricinus communis Baccharis salicifolia
Celtis pallida
Baccharis salicifolia Nicotiana glauca
Celtis pallida Vallesia glabra
Lycium berlandieri
Ricinus communis Nicotiana glauca Ambrosia ambrosioides
Nicotiana glauca Baccharis salicifolia Ricinus communis
Baccharis salicifolia
Trees
Populus fremontii Prosopis velutina Acacia farnesiana
Fraxinus velutina
Salix gooddingii
Prosopis velutina
Parkinsonia florida Prosopis velutina
Populus fremontii Parkinsonia aculeata
Salix gooddingii
Salix gooddingii
Table 7. Dominant bush and tree species by number of individuals in Desert Scrub stands for each site. Aguilar Ranch
Cienega
Living Fences
El Cajon
Nogalera
Galera
San Juan Ranch
Tomas Ranch
Bushes
Celtis pallida
Lycium berlandieri Celtis pallida
Mimosa laxiflora
Mimosa laxiflora
Jathropha cardiophylla
Celtis pallida
n/a
Celtis pallida
Trees
Prosopis velutina
Prosopis velutina
Prosopis velutina
Stenocereus thurberi Olneya tesota
Olneya tesota Parkinsonia florida
Prosopis velutina
n/a
Prosopis velutina
Land 2018, 7, x FOR PEER REVIEW
15 of 24
Land 2018, 7, 13
15 of 24
3.2.3. Shrub and Tree Diversity and Richness for Riparian Vegetation and Desert Scrub Stands diversity index results (Table 8) shows that, for and Riparian Vegetation, one of the 3.2.3.Shannon-Weiner Shrub and Tree Diversity and Richness for Riparian Vegetation Desert Scrub Stands least disturbed sites (Galera) has the higher value and one of the intermediate disturbed sites Shannon-Weiner diversity index results (Table shows for Riparian oneDesert of the (Cienega) has the lowest value. In general, half of the8)sites hadthat, higher diversity Vegetation, values for the least disturbed sites (Galera) has the higher value and one of the intermediate disturbed sites (Cienega) Scrub and the other half had higher diversity values for Riparian Vegetation. Both of the southern has the value. In general, half of thelevels sites had higherand diversity values for the Desert Scrub and sites (El lowest Cajon and Nogalera) present high of shrubs trees diversity. the other half had higher diversity values for Riparian Vegetation. Both of the southern sites (El Cajon and Table Nogalera) present high levels of shrubs andrichness trees diversity. 8. Shannon-Weiner diversity index and values for Riparian Vegetation and Desert Scrub stands, for each site (shrubs and trees). Table 8. Shannon-Weiner diversity index and richness values for Riparian Vegetation and Desert Scrub Riparian Desert Scrub stands, for each site (shrubs and trees). Vegetation Shannon-Weiner Shannon-Weiner Richness Richness Diversity Index Diversity Index Riparian Vegetation Desert Scrub Aguilar RanchShannon-Weiner 1.5821 8 1.6510 11 Richness Diversity Index Richness Shannon-Weiner Diversity Index Cienega 0.4957 4 1.1365 9 Aguilar Ranch 1.5821 8 1.6510 11 Living Fences 1.8725 13 1.8230 11 Cienega 0.4957 4 1.1365 9 El Cajon 1.8535 11 13 1.7179 1.8230 7 Living Fences 1.8725 11 El Cajon 1.8535 7 Nogalera 1.3557 12 11 1.9141 1.7179 14 Nogalera 1.3557 12 1.9141 14 Galera 1.9389 11 0.9598 7 Galera 1.9389 11 0.9598 7 San Juan Ranch 1.8029 11 San Juan Ranch 1.8029 11 Tomas 0.5909 3 3 1.0350 1.0350 11 Tomas RanchRanch 0.5909 11
3.3. 3.3. Land LandCover CoverAssessment Assessmentfrom from Aerial Aerial Imagery Imagery A A total totalof of15 15orthomosaics orthomosaicswere werederived derivedfrom fromUAV UAVflights, flights,88correspond correspondto toRiparian RiparianVegetation Vegetation sites and 7 to Desert Scrub sites (Figures 6 and 7). sites and 7 to Desert Scrub sites (Figures 6 and 7).
Figure 6. 6. Cover Coverpercentage percentagefor forLand Land Cover Cover Classes Classes for for each each site, site, derived derived from from orthomosaics orthomosaics of of Figure Ripariansites. sites.RV RV(Riparian (RiparianVegetation), Vegetation),RMW RMW (Riparian Mesquite Woodland), (Desert Scrub), Riparian (Riparian Mesquite Woodland), DSDS (Desert Scrub), H H (Herbaceous cover). (Herbaceous cover).
Tomas Tomas Ranch Ranch has has the the highest highest cover cover of of riparian riparian vegetation, vegetation, which which may may include include trees trees as as well well as as shrubs and when compared with field measurements it can be established that most of the riparian shrubs and when compared with field measurements it can be established that most of the riparian vegetation vegetation in in this this site site is is represented represented by by shrubs. shrubs. Cienega Cienegaisis the the next next site site with with the the highest highest cover cover of of riparian vegetation, which is dominated mostly by ash trees (Fraxinus velutina). Aguilar Ranch riparian vegetation, which is dominated mostly by ash trees (Fraxinus velutina). Aguilar Ranchstands stands out out to to be be the the site site with with less less vegetation vegetation coverage coverage for for all all land land cover cover classes, classes, this this could could be be due due to to the the closeness of agriculture fields to the riparian study site. Cajon and Nogalera sites differ from the rest closeness of agriculture fields to the riparian study site. Cajon and Nogalera sites differ from the rest of of sites because riparian vegetation is represented by mesquite woodland. Cajon the thethe sites because riparian vegetation herehere is represented by mesquite woodland. Cajon has thehas highest highest of Riparian and of it isby composed by shrubs. This high cover ofcover Riparian MesquiteMesquite WoodlandWoodland and most of it ismost composed shrubs. This high percentage of percentage of cover could be related to the physiography of the place, since its surrounded bycould low cover could be related to the physiography of the place, since its surrounded by low hills which hills which could lower species dissemination to adjacent places and promote species gathering in
Land 2018, 7, 13
16 of 24
Land 2018, 7, x FOR PEER REVIEW
16 of 24
lower species dissemination to adjacent places and promote species gathering in the same area [44], the same area [44], this could also explain the high richness and diversity of this site. The high this could also explain the high richness and diversity of this site. The high percentages of herbaceous percentages of herbaceous cover also mean there are more open spaces between the canopy, along cover also mean there are more open spaces between the canopy, along with the fact that none of the with the fact that none of the classes cover more than 60% of the terrain, this can be a sign of landscape classes cover more than 60% of the terrain, this can be a sign of landscape modifications and species modifications and species dominance shifts [56]. dominance shifts [56].
Figure 7. Cover Coverpercentage percentage Land Cover Classes for each site, derived from orthomosaics of Figure 7. forfor Land Cover Classes for each site, derived from orthomosaics of Desert Desert ScrubRV sites. RV (Riparian Vegetation), (Riparian Mesquite Woodland), (Desert Scrub), Scrub sites. (Riparian Vegetation), RMWRMW (Riparian Mesquite Woodland), DS DS (Desert Scrub), H H (Herbaceous cover). (Herbaceous cover).
Living Fences Fencesand andTomas Tomas Ranch have highest cover for Desert The hill steep hill Living Ranch have thethe highest cover for Desert ScrubScrub class. class. The steep where where Scrub Desertwas Scrub was sampled Livingsite Fences site can be its cover reaching 50%, Desert sampled in LivinginFences can be a cause of aitscause coverofreaching 50%, preventing preventing place to have continuous the one by cattle, sincenot it would the place tothe have continuous disturbancedisturbance such as thesuch one as caused by caused cattle, since it would be as not betoasgraze easy to on the as itflatter is on flatter terrains. though disturbance assessed easy ongraze the hills as hills it is on terrains. Even Even though disturbance was was not not assessed on on the Desert Scrub sites, in some places management practices were evident, such as in Tomas the Desert Scrub sites, in some places management practices were evident, such as in Tomas Ranch, Ranch, were halfsite of the was covered withgrass, buffelwhich grass, comprises which comprises least of the Desert were half of the wassite covered with buffel at leastathalf of half the Desert Scrub Scrub percentage. cover percentage. cover 3.4. Photosynthetic Activity Analysis 3.4.1. 3.4.1. Seasonal Seasonal Photosynthetic Photosynthetic Activity Activity per per Vegetation VegetationType Type The The analysis analysis of of variance variance performed performed with with the the residual residual EVI EVI values values of of May May and and September September shows shows aa clear clear seasonal seasonaldifference differencebetween betweenthe the Desert Scrub class and the rest of the cover and Desert Scrub class and the rest of the cover classesclasses and minor minor differences the other classes (Riparian Vegetation, RiparianMesquite MesquiteWoodland Woodland and differences amongamong the other classes (Riparian Vegetation, Riparian and Herbaceous Cover), this could be due the relative stability of water availability for riparian vegetation Herbaceous Cover), this could be due the relative stability of water availability for riparian vegetation and and the the opposite opposite for for desert desert scrub, scrub, thus thus showing showing aa drastic drastic increase increase on on photosynthetic photosynthetic activity activity during during the the rainy rainy season season in in some some of of our our sites sites (Figure (Figure 8). 8). Desert Desert Scrub Scrub class class values values in in Aguilar Aguilar Ranch Ranch show show to to be be higher higher than than any any other other class, class, meaning meaning that that this class has a higher seasonal variation. Riparian Vegetation and Herbaceous cover show this class has a higher seasonal variation. Riparian Vegetation and Herbaceous cover show the the lowest lowest residual residual values, values, indicating indicating aa low low seasonal seasonal variation variation in in its its photosynthetic photosynthetic activity. activity. Desert Scrub residual values indicate a strong seasonal Desert Scrub residual values indicate a strong seasonal photosynthetic photosynthetic response. response. The The other other two two classes than zero indicating that that May’s photosynthetic activity is higher or similar classes present presentvalues valueslower lower than zero indicating May’s photosynthetic activity is higher or to September’s photosynthetic activity. similar to September’s photosynthetic activity. Desert Desert Scrub Scrub and and Herbaceous Herbaceous residual residual values values are are the the highest highest in in this this site, site, indicating indicating aa higher higher seasonal Riparian Vegetation shows values below zero,zero, indicating that seasonal variation variationthan thanthe theother otherclasses. classes. Riparian Vegetation shows values below indicating in some cases May’s photosynthetic activity is higher or similar to September’s photosynthetic activity. that in some cases May’s photosynthetic activity is higher or similar to September’s photosynthetic
activity.
Land 2018, 7, x13FOR PEER REVIEW Land
17 of of 24 24 17
Figure 8. Differences among residual values of each land cover class in Aguilar Ranch, El Cajon and Tomas RV (Riparian RMW (Riparian Mesquite DS (Desert Scrub), Figure Ranch. 8. Differences among Vegetation), residual values of each land cover class Woodland), in Aguilar Ranch, El Cajon and H (Herbaceous cover). Aguilar Ranch: H = 28.23, P ≤ 0.001, N =Woodland), RV(16) RMW(24) DS(11) H(13). Tomas Ranch. RV (Riparian Vegetation), RMW (Riparian Mesquite DS (Desert Scrub), H El Cajon: H = cover). 14.76, PAguilar ≤ 0.001,Ranch: N = RMW(44) DS(5) H(14).NTomas Ranch: H = 33,DS(11) P ≤ 0.001, N El = VR(17) (Herbaceous H = 28.23, P ≤ 0.001, = RV(16) RMW(24) H(13). Cajon: MR(15) MD(5) MD-Buffel(11) HE(17). H = 14.76, P ≤ 0.001, N = RMW(44) DS(5) H(14). Tomas Ranch: H = 33, P ≤ 0.001, N = VR(17) MR(15)
MD(5) MD-Buffel(11) HE(17).
3.4.2. Photosynthetic Activity of Riparian Vegetation and Riparian Mesquite Woodland 3.4.2. Photosynthetic Activity of Riparian Vegetation and Riparian Mesquite Woodland There were five sites with Riparian Vegetation and Riparian Mesquite Woodland present along Thereofwere five sites with Riparian Vegetation and Riparian difference Mesquite Woodland along the edges the river. September EVI values show no significant for most ofpresent the sites but the edges of the river.and September EVI values show significant difference foreach most of the sites but two (San Juan Ranch Tomas Ranch). These twonosites are ranches close to other, they have (San Juan Ranch and Tomas Ranch). tree These two sites are ranches each have atwo low-medium disturbance and riparian species are dominant inclose both.toOn theother, other they hand, Maya low-medium disturbance and riparian tree speciesthe are two dominant both. May EVI EVI values show a significant difference between classesinon fourOn of the theother sites, hand, with Riparian values show a significant difference between activity the twothan classes on four of the Woodland sites, with (Table Riparian Vegetation maintaining higher photosynthetic Riparian Mesquite 9). Vegetation maintaining higher photosynthetic thanestablishes Riparian Mesquite Woodland 9). This suggests that even when Riparian Mesquiteactivity Woodland near the river it stills(Table requires This suggests that even when Riparian Mesquiteactivity Woodland establishes the it stills requires having precipitation to maintain photosynthetic values similar tonear those ofriver Riparian Vegetation. having precipitation to maintain photosynthetic activity values similar to those of Riparian Table 9. EVI averages for May and September for sites with Riparian Vegetation (RV) and Riparian Vegetation. Mesquite Woodland (RMW). Significance level (P). Values with * show a significant difference.
Table 9. EVI averages for May and September for sites with Riparian Vegetation (RV) and Riparian EVI-Maylevel (P). Values withEVI-September Mesquite Woodland (RMW). Significance * show a significant difference. P P RV RMW RV RMW EVI-May EVI-September P P Aguilar Ranch 0.408 RMW0.372 0.132 0.432 0.408RMW0.228 RV RV Living Fences 0.003 * 0.361 0.4250.408 0.145 Aguilar Ranch 0.408 0.364 0.3720.221 0.132 0.432 0.228 Galera 0.364 0.406 0.009 * 0.484 0.469 0.132 Living Fences 0.364 0.221 0.003 * 0.361 0.425 0.145 San Juan Ranch 0.330 0.201 0.001 * 0.456 0.349 0.001 * Galera 0.364 0.406 0.009 * 0.484 0.469 0.132 Tomas Ranch 0.388 0.211 0.008 * 0.436 0.354 0.001 * San Juan Ranch 0.330 0.201 0.001 * 0.456 0.349 0.001 * Tomas Ranch 0.388 0.211 0.008 * 0.436 0.354 0.001 *
3.4.3. Photosynthetic Activity and Disturbance
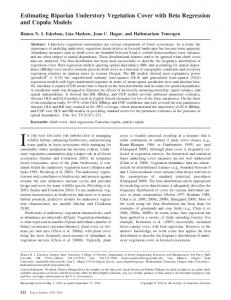
3.4.3.We Photosynthetic Activity and Disturbance performed a correlation analysis between EVI and ADI values of seven of our sites (we exclude Cienega since it presented unique conditions). Our finding that disturbance, as measured We performed a correlation analysis between EVI andsuggests ADI values of seven of our sites (we by the ADI, couldsince partially predict photosynthetic activity a site (estimated by EVI) (Figure 9). exclude Cienega it presented unique conditions). Ouroffinding suggests that disturbance, as Productivity decline in riparian ecosystems has been reported as one of the main consequences measured by the ADI, could partially predict photosynthetic activity of a site (estimated by EVI) of disturbance caused by decline human in activities, as waterhas deviation, agriculture, raise-cattle and (Figure 9). Productivity ripariansuch ecosystems been reported as one of the main mining [4,20,41]. specifically, vegetation indices such such as NDVI and EVI have been found to raisehave consequences of More disturbance caused by human activities, as water deviation, agriculture, acattle relationship with many climatic variables and also with surface and groundwater levels, finding and mining [4,20,41]. More specifically, vegetation indices such as NDVI and EVI have been that, into many the indiceswith decline with deeper levels ofand groundwater withand decreased flood found havecases, a relationship many climatic variables also with and surface groundwater flows [17,57]. levels, finding that, in many cases, the indices decline with deeper levels of groundwater and with decreased flood flows [17,57].
Land 2018, 7, 13 Land 2018, 7, x FOR PEER REVIEW
18 of 24 18 of 24
Productivity - Disturbance 0.60
0.55
EVI Sep
0.50
0.45
0.40
0.35
0.30
0.25 9
10
11
12
13
14
15
16
17
ADI Figure9. 9. EVI-September values of Riparian Vegetation relation with the Anthropogenic Figure EVI-September values of Riparian Vegetation relation with the Anthropogenic DisturbDisturb Index 2 2 IndexR(ADI). R =P0.448, P = 0.100. (ADI). = 0.448, = 0.100.
Discussion 4.4.Discussion 4.1.Disturbance Disturbanceininthe theSMR SMRWatershed Watershed 4.1. Thereis is previous study the that SMR that analyses disturbance inecosystems. riparian ecosystems. There no no previous study in theinSMR analyses disturbance in riparian Previous Previous land use and vegetation classification studies in the area have found that agriculture and land use and vegetation classification studies in the area have found that agriculture and cattle ranching cattle ranching that are the activities the most to land [8],with which are the activities contribute thethat mostcontribute to land cover dynamics [8], cover whichdynamics is consistent theis consistent with the present study given that those activities were present in all of the study sites and present study given that those activities were present in all of the study sites and are determinant to the of disturbance degree Different of riparian habitats. Differentecological indices that evaluate toare thedeterminant disturbance degree riparian habitats. indices that evaluate parameters parameters inbeen riparian have been in many placesall inof Mexico [15,58–60], all of inecological riparian habitats have usedhabitats in many places inused Mexico [15,58–60], them use vegetation them use vegetation parameters such as composition, cover and species density to estimate riparian parameters such as composition, cover and species density to estimate riparian habitat condition. habitat ADIstudy proposed in this study includes and human The ADIcondition. proposed The in this includes composition and composition human activities mainlyactivities but not mainly cover. but not cover. Even though coverinisthe notADI, included in the show ADI, that our results show that thisbe parameter Even though cover is not included our results this parameter could related be related to disturbance. tocould disturbance. TheRiparian Riparian Quality Index developed by Gonzalez and Garcia [42] uses several The Quality Index (RQI)(RQI) developed by Gonzalez and Garcia [42] uses several vegetation vegetation characteristics (e.g., continuity, regeneration and composition) and hydro-morphological characteristics (e.g., continuity, regeneration and composition) and hydro-morphological factors to factors to thecondition ecologicalofcondition of rivers, this designed index wasfordesigned for a evaluate theevaluate ecological rivers, even thougheven this though index was a particular particularriparian European riparian environment, most ofcan its be elements be environments. used in other environments. European environment, most of its elements used incan other Even though Even ADI shares some with the focus RQI, is our main focus is of the assessmenttoof the ADIthough shares the some similarities withsimilarities the RQI, our main the assessment disturbance disturbance to evaluate the ecological condition of rivers. evaluate the ecological condition of rivers. Distribution disturbed sites along river shows that those with highest located Distribution ofof disturbed sites along thethe river shows that those with thethe highest ADIADI are are located in in the south, closer to the city of Hermosillo. These results are consistent with previous studies [23] the south, closer to the city of Hermosillo. These results are consistent with previous studies [23] that that demonstrate how peri-urban communities experience in land use due water to urban water demonstrate how peri-urban communities experience changeschanges in land use due to urban transfer, transfer, these changes include the loss of agricultural land and habitat transformations due these changes include the loss of agricultural land and habitat transformations due to recreational sitesto recreational sites The two sites (El in the present study (Elhave Cajon and establishment. The establishment. two most disturbed sitesmost in thedisturbed present study Cajon and Nogalera) been Nogalera) been modified foragriculture the region:and commercial and modified byhave non-typical activitiesby fornon-typical the region: activities commercial the other agriculture is recreational the other is recreational activity. These activities require a different management and resource activity. These activities require a different management and resource administration compared to administration compared to other more traditional activities (such as subsistence agriculture). Therefore, ecological modification of the riparian habitat by either of the activities mentioned could represent new scenarios for local people.
Land 2018, 7, 13
19 of 24
other more traditional activities (such as subsistence agriculture). Therefore, ecological modification of the riparian habitat by either of the activities mentioned could represent new scenarios for local people. Sites located in the central part of the sub watershed have a low-medium disturbance, most of them are ranches. This stands out due to the fact that ranches are places with frequent human presence and most of the times include some type of resource management. In this case, it could be that the effect of disturbance is not so strong due to the relatively small size of the ranches, where human activities are present but not necessarily intense. The northern sites present an intermediate disturbance degree; they both include some type of management. In the case of Cienega there’s an intense presence of cattle, which could be related to the low shrub cover in both Riparian and Desert habitats, which was less than 10% in both cases. Living Fences site stands out due to the presence of cottonwood and willow fences along the edges of the river, it is important to notice that most of the riparian tree cover was composed by these living fences, that is, almost no other riparian trees were found that were not managed. These living fences are a main characteristic of the traditional type of agricultural activity in the region. Considering the high disturbance degree found in these riparian habitats, the present study could be an update on what Nabhan and Sheridan [61] called a “stable agroecosystem in the upper San Miguel,” stating that it is not necessarily stable if disturbance is so high and riparian vegetation so scarce, although living fences might still hold some additional benefits to the riparian habitat. 4.2. Cover and Composition of Riparian habitats and Desert Habitats Field estimations show that Riparian Vegetation cover is higher than Desert Scrub cover, for all vegetation strata; which is most likely due to resource availability and physical characteristics in riparian habitats which enable vegetation growth, such as soil moisture, organic matter deposition and groundwater [62]. Herbaceous cover was the strata with the highest values for both habitats but it did not reach 100% in any site. Since herbs and shrubs are the most affected by cattle [4], it is interesting to note that one of the places with greatest cattle presence (Cienega) shows a 90% herbaceous cover and a 5% shrub cover, in the riparian habitat. In this particular site, cattle might be having a greater effect on shrub removal and the high percentage of herbaceous cover may be a response to the climatic conditions at the time of sampling (rainy season). The same situation can be seen in the desert habitat for the same site, where shrub cover is only 7%. Compositions of both habitats present some similarities, such as Prosopis velutina, Parkinsonia florida, Celtis pallida and Lycium berlandieri. Riparian habitats show the presence of exotic species Ricinus communis and Nicotiana glauca in most of the low-medium disturbed sites. Ricinus communis is considered as an indicator of disturbed habitats [63]. Nicotiana glauca is widely common in Sonoran rivers [64] and high dominant values in its presence have been found in many places where half of the land has been transformed to agriculture [11]. It stands out that these species were found in the sites with the lowest disturbance degree. Even though many desert species can be found on riparian habitats, this study considers that the abundance and high presence of these species can be a sign of change in the riparian ecosystem. This can be seen in the two sites with the highest disturbance degree (Cajon and Nogalera) where Prosopis velutina and Parkinsonia florida dominated the tree strata. The presence of cacti such as Cylindropuntia leptocaulis and Lophocereus schottii, along with the presence of the invasive buffel grass in riparian habitats of these two sites, could also be an indicator of a gradual vegetation transformation or an increase of aridity in the riparian habitat. Diversity of shrub and tree strata in Cienega is the lowest for riparian habitats, this might be due to the fact that most of the canopy was dominated by a single tree species Fraxinus velutina and almost no other tree species were present. Something similar can be seen in Galera, where the desert habitat has the lowest diversity value and the composition shows a dominance of mesquite in the sampling site.
Land 2018, 7, 13
20 of 24
Contrary to what was expected, vegetation class covers derived from orthomosaics (UAV) show similar averages for both habitats. Riparian habitat shows a 25% cover for Riparian Vegetation and a 23% for Riparian Mesquite Woodland and Desert habitat shows a 21% cover for Desert Scrub and a 27% for Riparian Mesquite Woodland. These similarities can also be a sign of degradation of riparian habitats, where vegetation cover is expected to be higher than in desert habitats. Although when riparian habitat covers are compared within each site, Riparian Vegetation presents higher covers than Riparian Mesquite Woodland in all sites, except for those where it is not present (Cajon and Nogalera). In the desert habitat, Riparian Mesquite Woodland has a higher cover than Desert Scrub in most of the sites. 4.3. Photosynthetic Activity of Riparian Habitats and Desert Habitats Differences in EVI averages between riparian and desert habitats are consistent with other findings [8,17,35] where a higher productivity is attributed to riparian vegetation when compared to its adjacent vegetation and with the fact that water availability promotes vegetation productivity in riparian habitats [55,65,66]. Also, the seasonal difference in EVI values for desert habitat is much greater than in riparian habitat, showing that riparian habitats maintain more stable productivity rates than desert habitats, which respond drastically during the growth season when water is available through precipitation. Riparian vegetation shows higher EVI average values than Riparian Mesquite Woodland in most of the 5 sites where these two classes are present; this was consistent for both seasons. This photosynthetic activity variation is important and could mean that, even when both classes share the same environment and water availability, Riparian Vegetation remains more productive than Riparian Mesquite Woodland. Soil characteristics between these two classes might explain part of the productivity differences, since, as registered by Trujillo [67], Riparian Vegetation in the San Miguel river has a greater amount of carbon and nitrogen and also greater mycorrhizal activity, than Riparian Mesquite Woodland. The productivity-disturbance inverse relationship shows to be significant and consistent with what has been reported before [41], in terms of productivity decline being one of the main consequences of disturbance (according to ADI scores). Based on EVI analysis, our results suggest that riparian sites with high disturbance due to human activities (which include changes in water availability, as suggested by previous studies [8,23,35] and changes in the composition and structure of vegetation) have lower photosynthetic activity (and hence productivity) than less disturbed areas. The use of aerial photography in this study was very helpful to perform a detailed classification analysis since different vegetation types can be easily identified with high spatial resolution imagery. Also, digitalization of the different vegetation types allows for very accurate cover estimation, due to the clear visualization of tree and shrub canopies. In addition, when combined with a coarser resolution sensor (OLI) we were able to identify the exact productivity values for each vegetation type, which was an essential part of this study. 5. Conclusions According to our analysis, the increase of land-cover-change associated human activities can increase disturbance on the vegetation of riparian ecosystems in the San Miguel River. As disturbance increases, photosynthetic activity of Riparian Vegetation decreases. The two sites with the highest degree of disturbance according to the ADI are characterized by the development of particular activities (non-traditional) that were not found in any other site, such as commercial agriculture and recreational activity. Riparian composition in these two sites differs greatly from riparian vegetation in the rest of the sites, due to the almost total absence of obligate-riparian species. Composition in places with the highest disturbance is dominated by facultative-riparian species.
Land 2018, 7, 13
21 of 24
The presence of non-riparian species and facultative-riparian species in riparian habitats is not uncommon, in this study we suggest that the dominant presence of such species could be related to the intensity of human activities developed in the site. Further studies need to be made to sustain or dismiss this suggestion. Disturbance as measured by the Anthropogenic-disturbance Index shows to have no significant effect on shrub and trees richness and diversity. Further studies would need to assess herbaceous composition and diversity and its relation to disturbance. Unmanned Aerial Vehicles constitute an efficient tool to assess and monitor riparian ecosystems. Further studies or management proposals should take this into account for the development of regular monitoring programs on arid and semi-arid watersheds. The remote sensing methods used in this study should be further explored for the study of riparian ecosystems. Especially the use of high efficiency drones could be applied for a more extensive mapping of riparian habitats. The coupling of aerial technologies along with free-access satellite data, is a feasible option for riparian characterization and monitoring. In spite of their small extension and of being highly variable, riparian habitats in arid regions are of crucial importance, an evidence of this is the capacity of Riparian Vegetation to maintain higher photosynthetic activity levels than other vegetation types such as Riparian Mesquite Woodland and Desert Scrub. Since riparian habitats demonstrate high variability in terms of land use, we believe that it is necessary to increase the number of studies regarding their composition and the effects/threats posed by human disturbance. For the previous, the present study provides potential tools to evaluate the effects of different management practices on riparian habitats in arid environments. Supplementary Materials: The following are available online at http://www.mdpi.com/2073-445x/7/1/13/s1, Table S1: Spatial and temporal location of each flight performed. (R) and (D) after site name indicate flight performed over riparian vegetation (R) and over adjacent desert scrub (D). SMH is the abbreviation for San Miguel de Horcasitas municipality, Table S2: Flight requirements and image specifications, Table S3: Characteristics of Landsat 8 scenes. Acknowledgments: The present work was supported by the following projects: (1) “Strengthening Resilience of Arid Region Riparian Corridors Ecohydrology and Decision–Making in the Sonora and San Pedro Watersheds” (funded by the National Science Foundation’s Dynamics of Coupled Natural and Human (CNH) Systems Program); (2) Apoyo a la incorporacion de nuevos PTC (funded by SEP-PRODEP) and (3) grant support CB2013-223525-R (CONACYT). L.C.-D. would also like to thank the National Council for Science and Technology of Mexico (CONACYT) for their support through a postgraduate scholarship. Author Contributions: Lara Cornejo-Denman was the primary author and all authors contributed to the final paper. Jose Raul Romo-Leon contributed to all steps of the analysis and commented on the manuscript. Alejandro E. Castellanos, Jose Luis Moreno-Vázquez and Rolando E. Diaz-Caravantes made important contributions during the development of the research project and commented and revised the manuscript. Romeo Mendez-Estrella contributed with discussion and field work. All authors reviewed and approved the final manuscript. Conflicts of Interest: The authors declare no conflict of interest.
References 1. 2.
3. 4. 5.
Stromberg, J.; Tellman, B. Ecology and Conservation of the San Pedro River; The University of Arizona Press: Tucson, AZ, USA, 2009. Stromberg, J.; Briggs, M.; Gourley, C.; Scott, M.; Shafroth, P.; Stevens, L. Human alterations of riparian ecosystems. In Riparian Areas of the Southwestern United States. Hydrology, Ecology, and Management; Baker, M.B., Ffolliott, P.F., DeBano, L., Neary, D.G., Eds.; Lewis Publishers: Boca Raton, FL, USA, 2004; p. 429. Obedzinski, R.A.; Shaw, C.G.; Neary, D.G. Declining woody vegetation in riparian ecosystems of the western united states. West. J. Appl. For. 2001, 16, 169–181. Zaimes, G. Understanding Arizona’s Riparian Areas; Zaimes, G., Ed.; Arizona Cooperative Extension—The University of Arizona: Tucson, AZ, USA, 2007. CONAGUA. Actualización de la Disponibilidad Media Anual de Agua en el Acuífero Río San Miguel (2625), Estado de Sonora; Secretaría de Medio Ambiente y Recursos Naturales—Comisión Nacional del Agua: México, 2015.
Land 2018, 7, 13
6. 7. 8.
9. 10.
11.
12.
13. 14.
15. 16.
17.
18.
19. 20. 21. 22. 23. 24.
25.
26.
22 of 24
Moreno, J.L.; Marañón, B.; López, D. Los acuíferos sobreexplotados: Origen, crisis y gestión social. In El Agua en México: Cauces y Encauces; Academia Mexicana de Ciencias: Tlalpan, México, 2010; p. 702. CONAGUA. Disponibilidad Media Anual de Agua Subterránea. 2625 Río San Miguel; Secretaría de Medio Ambiente y Recursos Naturales—Comisión Nacional del Agua: México, 2009. Mendez-Estrella, R.; Romo-Leon, J.; Castellanos, A.; Gandarilla-Aizpuro, F.; Hartfield, K. Analyzing landscape trends on agriculture, introduced exotic grasslands and riparian ecosystems in arid regions of mexico. Remote Sens. 2016, 8, 664. [CrossRef] Williams, C.A.; Cooper, D.J. Mechanisms of riparian cottonwood decline along regulated rivers. Ecosystems 2005, 8, 382–395. [CrossRef] Petrakis, R.E.; van Leeuwen, W.J.D.; Villarreal, M.L.; Tashjian, P.; Dello Russo, R.; Scott, C.A. Historical analysis of riparian vegetation change in response to shifting management objectives on the middle rio grande. Land 2017, 6, 29. [CrossRef] Scott, M.L.; Nagler, P.L.; Glenn, E.P.; Valdes-Casillas, C.; Erker, J.A.; Reynolds, E.W.; Shafroth, P.B.; Gomez-Limon, E.; Jones, C.L. Assessing the extent and diversity of riparian ecosystems in Sonora, Mexico. Biodivers. Conserv. 2009, 18, 247–269. [CrossRef] Lite, S.J.; Bagstad, K.J.; Stromberg, J.C. Riparian plant species richness along lateral and longitudinal gradients of water stress and flood disturbance, san pedro river, arizona, USA. J. Arid Environ. 2005, 63, 785–813. [CrossRef] Stromberg, J.; Tiller, R.; Richter, B. Effects of ground water decline on riparian vegetation of semiarid regions: The san pedro, arizona. Ecol. Appl. 1996, 6, 113–131. [CrossRef] Shafroth, P.B.; Cleverly, J.R.; Dudley, T.L.; Taylor, J.P.; Van Riper, C., III; Weeks, E.P.; Stuart, J.N. Control of tamarix in the western united states: Implications for water salvage, wildlife use, and riparian restoration. Environ. Manag. 2005, 35, 231–246. [CrossRef] [PubMed] Villaseñor, J.F. Habitat Use and the Effects of Disturbance on Wintering Birds Using Riparian Habitats in Sonora, Mexico; University of Montana: Missoula, MT, USA, 2007. DeBano, L.F.; DeBano, S.J.; Wooster, D.E.; Baker, M.B. Linkages between riparian corridors and surrounding watersheds. In Riparian Areas of the Southwestern United States. Hydrology, Ecology, and Management; Baker, M.B., Ffolliott, P.F., DeBano, L., Neary, D.G., Eds.; Lewis Publishers: Boca Raton, FL, USA, 2004; p. 429. Nguyen, U.; Glenn, E.; Nagler, P.; Scott, R. Long-term decrease in satellite vegetation indices in response to environmental variables in an iconic desert riparian ecosystem: The Upper San Pedro, Arizona, USA. Ecohydrology 2014, 8, 610–625. [CrossRef] Jones, K.B.; Slonecker, E.T.; Nash, M.S.; Neale, A.C.; Wade, T.G.; Hamann, S. Riparian habitat changes across the continental united states (1972–2003) and potential impications for sustaining ecosystem services. Landsc. Ecol. 2010, 25, 1261–1275. [CrossRef] Chan, D. Using Ecosystem Services to Understand the Impact of Land Cover Change: A Case Study of the Upper San Pedro Watershed; University of Arizona: Tucson, AZ, USA, 2013. Patten, D. Riparian ecosytems of semi-arid north america: Diversity and human impacts. Wetlands 1998, 18, 498–512. [CrossRef] Navarro-Navarro, L.A.; Moreno-Vazquez, J.L.; Scott, C.A. Social networks for management of water scarcity: Evidence from the san miguel watershed, sonora, mexico. Water Altern. 2017, 10, 41–64. Lutz, A.N. Human Adaptation to Social and Environmental Change in Rural Communities of the San Miguel Watershed in Arid Northwest Mexico; The University of Arizona: Tucson, AZ, USA, 2017. Díaz-Caravantes, R.E.; Sánchez-Flores, E. Water transfer effects on peri-urban land use/land cover: A case study in a semi-arid region of mexico. Appl. Geogr. 2011, 31, 413–425. [CrossRef] House-Peters, L.; Scott, C.A. Assessing the impacts of land use change on water availability, management, and resilience in arid region riparian corridors: A case study of the san pedro and rio sonora watersheds in southwestern USA and northwestern mexico. In Proceedings of the XIV World Water Congress of the International Water Resources Association, Porto de Galinhas, Brazil, 25–29 September 2011. Ely, C.C.; Kepner, W.G.; Goodrich, D.C.; Nash, M.S. Investigating Historic Parcel Changes to Understand Land Use Trends—A Methodology and Application for the San Pedro River Watershed; United States Environmental Protection Agency: Washington, DC, USA, 2013. Webb, R.H.; Leake, S.A. Ground-water surface-water interactions and long-term change in riverine riparian vegetation in the southwestern united states. J. Hydrol. 2006, 320, 302–323. [CrossRef]
Land 2018, 7, 13
27.
28.
29. 30.
31.
32. 33. 34. 35.
36. 37. 38.
39. 40. 41. 42. 43. 44. 45. 46. 47. 48.
49. 50.
23 of 24
Villarreal, M.; Leeuwen, W.V.; Romo, J.R. Mapping and monitoring riparian vegetation distribution, structure and composition with regression tree models and post-classification change metrics. Int. J. Remote Sens. 2012, 33, 4266–4290. [CrossRef] Castellanos-Villegas, A.; Bravo, L.; Koch, G.; Llano, J.; López, D.; Méndez, R.; Rodríguez, J.; Romo, R.; Sisk, T.D.; Yanes-Arvayo, G. Impactos ecológicos por el uso del terreno en el funcionamiento de ecosistemas áridos y semiáridos. In Diversidad Biológica de Sonora; Freaner, F.M., Devender, T.V., Eds.; UNAM-CONABIO: Hermosillo, Mexico, 2010. Búrquez, A.; Martínez-Yrízar, A. Conservation and landscape transformation in sonora, méxico. J. Southwest 1997, 39, 371–398. Akasheh, O.Z.; Neale, C.M.U.; Jayanthi, H. Detailed mapping of riparian vegetation in the middle rio grande river using high resolution multi-spectral airborne remote sensing. J. Arid Environ. 2008, 72, 1734–1744. [CrossRef] Jensen, A.; Hardy, T.; McKee, M.; Chen, Y. Using a multispectral autonomous unmanned aerial remote sensing platform (aggieair) for riparian and wetlands applications. In Proceedings of the International Geoscience and Remote Sensing Symposium, Vancouver, BC, Canada, 24–29 July 2011; pp. 3413–3416. Box, E.O.; Fujiwara, K. Vegetation types and their broad-scale distribution. In Vegetation Ecology, 2nd ed.; John Wiley & Sons, Ltd.: New York, NY, USA, 2013; p. 578. Lambers, H.; Chapin, F.S., III; Pons, T.L. Plant Physiological Ecology, 2nd ed.; Springer: New York, NY, USA, 2008. Cohen, W.B.; Goward, S.N. Landsat’s role in ecological applications of remote sensing. BioScience 2004, 54, 535–545. [CrossRef] Mendez-Estrella, R.; Romo-Leon, J.; Castellanos, A. Mapping changes in carbon storage and productivity services provided by riparian ecosystems of semi-arid environments in northwestern mexico. Int. J. Geo-Inf. 2017, 6, 298. [CrossRef] Shreve, F.; Wiggins, I.L. Vegetation of the Sonoran Desert; Stanford University Press: Palo Alto, CA, USA, 1964. Galaz, O. Estructura y Diversidad de la Comunidad de Plantas Del Hábitat Ribereño de la Parte Baja Del Río San Miguel, Sonora; Universidad de Sonora: Hermosillo, Mexico, 2016. Vivoni, E.; Gutiérrez-Jurado, H.; Aragón, C.; Méndez-Baroso, L.; Rinehart, A.; Wyckoff, R. Variation of hydrometeorological conditions along a topographic transect in northwestern Mexico during the north american monsoon. J. Clim. 2007, 20, 1792–1809. [CrossRef] CONAGUA. Programa Detallado de Acciones de Gestión Integral Para la Restauración Hidrológica Del Río Sonora; Secretaría de Medio Ambiente y Recursos Naturales—Comisión Nacional del Agua: México, 2013. SIAFESON, R.D.E.M.A.D.S. Remas. Available online: http://www.siafeson.com/remas/index.php/ (accessed on 15 January 2018). Poff, B.; Koestner, K.A.; Neary, D.G.; Henderson, V. Threats to riparian ecosystems in western North America: An analysis of existing literature1. J. Am. Water Resour. Assoc. 2011, 47, 1241–1254. [CrossRef] González, M.; García, D. Riparian Quality Index (RQI): A methodology for characterising and assessing the environmental conditions of riparian zones. Limnetica 2011, 30, 235–254. Mueller-Dombois, D.; Ellenberg, H. Aims and Methods of Vegetation Ecology; John Wiley & Sons: New York, NY, USA, 1974. Gurevitch, J.; Scheiner, S.M.; Fox, G.A. The Ecology of Plants; Sinauer Associates, Inc.: Sunderland, MA, USA, 2006; p. 574. Mather, B.T.A.P.M. Classification Methods for Remotely Sensed Data, 2nd ed.; CRC Press—Taylor & Frances Group: Boca Raton, FL, USA, 2009; p. 357. USGS. Landsat Missions. Available online: https://landsat.usgs.gov/geometry (accessed on 15 January 2018). Bannari, A.; Morin, D.; Bonn, F.; Huete, A.R. A review of vegetation indices. Remote Sens. Rev. 1995, 13, 95–120. [CrossRef] Glenn, E.; Huete, A.; Nagler, P.; Nelson, S. Relationship between remotely-sensed vegetation indices, canopy attributes and plant physiological processes: What vegetation indices can and cannot tell us about the landscape. Sensors 2008, 8, 2136–2160. [CrossRef] [PubMed] Running, S.W.; Nemani, R.R.; Heinsch, F.A.; Zhao, M.; Reeves, M.; Hashimoto, H. A continuous satellite-derived measure of global terrestrial primary production. BioScience 2004, 54, 547–560. [CrossRef] Huete, A.; Didan, K.; Miura, T.; Rodriguez, E.P.; Gao, X.; Ferreira, L.G. Overview of the radiometric and biophysical performance of the modis vegetation indices. Remote Sens. Environ. 2002, 83, 195–213. [CrossRef]
Land 2018, 7, 13
51.
52.
53. 54. 55. 56. 57. 58. 59. 60.
61. 62.
63. 64.
65.
66.
67.
24 of 24
McLaughiln, S.P. Riparian flora. In Riparian Areas of the Southwestern United States. Hydrology, Ecology, and Management; Baker, M.B., Ffolliott, P.F., DeBano, L., Neary, D.G., Eds.; Lewis Publishers: Boca Raton, FL, USA, 2004; pp. 127–140. Clary, W.P.; Kruse, W.H. Livestock grazing in riparian areas: Environmental impacts, management practices and management implications. In Riparian Areas of the Southwestern United States. Hydrology, Ecology, and Management; Baker, M.B., Ffolliott, P.F., DeBano, L., Neary, D.G., Eds.; Lewis Publishers: Boca Raton, FL, USA, 2004; p. 429. Stromberg, J. Riparian mesquite forests: A review of their ecology, threats, and recovery potential. J. Ariz-Nev. Acad. Sci. 1993, 27, 111–124. Stromberg, J.C.; Setaro, D.L.; Gallo, E.L.; Lohse, K.A.; Meixner, T. Riparian vegetation of ephemeral streams. J. Arid Environ. 2017, 138, 27–37. [CrossRef] Malanson, G.P. Riparian Landscapes; Cambridge University Press: Cambridge, UK, 1993; p. 306. Fernandes, M.R.; Aguiar, F.C.; Ferreira, M.T. Assessing riparian vegetation structure and the influence of land use using landscape metrics and geostatistical tools. Landsc. Urban Plan. 2011, 99, 166–177. [CrossRef] Fu, B.; Burgher, I. Riparian vegetation ndvi dynamics and its relationship with climate, surface water and groundwater. J. Arid Environ. 2015, 113, 59–68. [CrossRef] Mendoza, M. Vegetación Ribereña: Indicador de la Salud Del Río de la Reserva de la Biósfera de la Barranca de Metztitlán; Colegio de Postgraduados: Texcoco, Mexico, 2014. Ramírez, J.E. Caracterización Del Ecosistema de Ribera y su Valor Indicador Del Estado Ecológico en la Subcuenca Valle de Bravo-Amanalco, Estado de México; Universidad Nacional Autónoma de México: Mexico City, Mexico, 2010. LANCIS. Evidencias de Las Afectaciones a la Integridad Funcional de Los Ecosistemas Del Río Bacanuchi y el Río Sonora Por el Derrame de la Mina Buena Vista Del Cobre: Avances Del Diagnóstico Ambiental; Universidad Nacional Autónoma de México—Laboratorio Nacional de Ciencias de la Sostenibilidad: Mexico City, Mexico, 2016. Nabhan, G.; Sheridan, T. Living fencerows of the Rio San Miguel, Sonora, Mexico: Traditional technology for floodplain management. Hum. Ecol. 1977, 5, 97–111. [CrossRef] DeBano, L.F.; Schmidt, L.J. Definitions and classifications. In Riparian Areas of the Southwestern United States. Hydrology, Ecology, and Management; Baker, M.B., Ffolliott, P.F., DeBano, L., Neary, D.G., Eds.; Lewis Publishers: Boca Raton, FL, USA, 2004; p. 429. CONABIO. Malezas de México. Available online: http://www.conabio.gob.mx/malezasdemexico/2inicio/ home-malezas-mexico.htm (accessed on 15 January 2018). Van Devender, T.; Felger, R.; Fishbein, M.; Molina-Freaner, F.; Sánchez-Escalante, J.; Reina-Guerrero, A. Biodiversidad de las plantas vasculares. In Diversidad Biológica de Sonora; Molina-Freaner, F., Van Devender, T., Eds.; UNAM—CONABIO: Hermosillo, Mexico, 2010; pp. 229–262. Stromberg, J.; Beauchamp, V.; Dixon, M.; Lite, S.; Paradzick, C. Importance of low-flow and high-flow characteristics to restoration of riparian vegetation along rivers in arid south-western united states. Freshw. Biol. 2007, 52, 651–679. [CrossRef] Richardson, D.; Holmes, P.; Esler, K.; Galatowitsch, S.; Stromberg, J.; Kirkamn, S.; Pysek, P.; Hobbs, R. Riparian vegetation: Degradation, alien plant invasions, and restoration prospects. Divers. Distrib. 2007, 13, 126–139. [CrossRef] Trujillo, C. Interacciones Bióticas y de Nutrientes en el Suelo de la Vegetación Ribereña y Mezquital en el río San Miguel, Sonora; Universidad de Sonora: Hermosillo, Mexico, 2014. © 2018 by the authors. Licensee MDPI, Basel, Switzerland. This article is an open access article distributed under the terms and conditions of the Creative Commons Attribution (CC BY) license (http://creativecommons.org/licenses/by/4.0/).