Proceedings of the Interdisciplinary STEM Teaching and Learning Conference Volume 1
Article 5
5-2017
Assessing Student Progress and Performance across the Curriculum Christopher G. Brown Georgia Gwinnett College,
[email protected]
Jennell M. Talley Georgia Gwinnett College,
[email protected]
Bekah Ward Dr. Georgia Gwinnett College,
[email protected]
Christopher I. Brandon Jr. Georgia Gwinnett College,
[email protected]
Jill Penn Georgia Gwinnett College,
[email protected] See next page for additional authors
Follow this and additional works at: http://digitalcommons.georgiasouthern.edu/ stem_proceedings Part of the Science and Mathematics Education Commons Recommended Citation Brown, Christopher G.; Talley, Jennell M.; Ward, Bekah Dr.; Brandon, Christopher I. Jr.; Penn, Jill; and Javazon, Elisabeth (2017) "Assessing Student Progress and Performance across the Curriculum," Proceedings of the Interdisciplinary STEM Teaching and Learning Conference: Vol. 1 , Article 5. Available at: http://digitalcommons.georgiasouthern.edu/stem_proceedings/vol1/iss1/5
This article is brought to you for free and open access by Digital Commons@Georgia Southern. It has been accepted for inclusion in Proceedings of the Interdisciplinary STEM Teaching and Learning Conference by an authorized administrator of Digital Commons@Georgia Southern. For more information, please contact
[email protected].
Assessing Student Progress and Performance across the Curriculum Authors
Christopher G. Brown, Jennell M. Talley, Bekah Ward Dr., Christopher I. Brandon Jr., Jill Penn, and Elisabeth Javazon
This article is available in Proceedings of the Interdisciplinary STEM Teaching and Learning Conference: http://digitalcommons.georgiasouthern.edu/stem_proceedings/vol1/iss1/5
Assessing Student Progress and Performance across the Curriculum: A Tool to Evaluate Program Success Quickly Christopher Brown, Georgia Gwinnett College Jennell Talley, Georgia Gwinnett College Rebekah Ward, Georgia Gwinnett College Christopher Brandon, Georgia Gwinnett College Jill Penn, Georgia Gwinnett College Elisabeth Javazon, Georgia Gwinnett College Abstract: Evaluation of student learning is of paramount importance to the educational community and allows reflection on program successes and weaknesses; however, best practices are hotly debated. This project designed and implemented an assessment system in which an identical, mixed-format assessment was given to all levels of students in the Georgia Gwinnett College biology program at the start of the semester for academic years 2014-15, 2015-16 and Fall of 2016. The assessment contained multiple choice and free-response questions, and evaluated lab reports from core courses in the biology program. This system allows for longitudinal assessment of students, provides quick results for timely action, and can allow analysis of interesting demographic questions. We found student achievement on program goals was lower than previously assessed and student performance on multiple choice questions was higher than free-response questions. There was a modest, but temporary, gain in performance on the ability to effectively communicate science. Additionally, males outperformed their female counterparts and Hispanics underperformed their non-Hispanic peers. Keywords: program goals, longitudinal comparison, higher education, formative and summative assessment Acknowledgements: This work was funded by a grant from the University System of Georgia STEM Initiative II Project. We would like to thank all the faculty in the biology discipline at Georgia Gwinnett College who volunteered their services and class time to make this project a success.
34
Introduction Collegiate programs frequently determine a set of goals that reflect the required outcomes of the program. Evaluating student performance on program goals is of vital importance to determine progress through the program and identify targets for future remediation (Boyer 1990). In other words, faculty should know how well their students meet the goals set for them and adjust accordingly. Ideally, students become increasingly proficient in content knowledge and essential skills pertaining to their given field, i.e., seniors should display a higher mastery of outcomes than juniors, who are more capable than sophomores, and so on (Gardner et al. 1983). Graduates should possess the abilities expected of a budding professional and therefore be capable of success in a relevant field or post-graduate program. The ongoing process of improving assessment and evaluation began in earnest in 1918, has since experienced many significant changes in focus, including the Reagan administration report A Nation At Risk, and more recently has received new impetus from the Obama administration’s “College Scorecard” initiative (Sims 1992). Furthermore, faculty should play a creative and consistent role in the development and implementation of any program assessment so they and their students can benefit (Emil and Cress 2014, Stohlman 2015). Content knowledge, conceptual understanding and acquisition of essential skills often determine student progress over the duration of an academic program. Metrics used to determine proficiency on goals include longitudinal standardized exams, exit exams, portfolio building, and capstone or senior field experience analysis (Banta et al. 2009, Ruben 2016). Each metric has benefits and costs and proper assessment is often time-consuming. Exit exams are relatively quick and provide data comparable across students and campuses, but they often do not directly address a given institution’s progress towards specific goals (Astin 2012). Exit exams also do not provide a baseline of performance or a sequence of progress; perhaps student performance at the end of a program is the same as it was at the beginning, or students make gains but fall short of a preset numerical goal (Tucker 2006). Students may also refrain from putting forth their best effort on exams not linked directly to success in a course. Alternatively, questions relevant to course goals can be embedded in exams given in diverse courses (Astin 2012), but the data then reflect progress in courses, not in programs, and must be aggregated, thus losing specificity. This type of assessment can also introduce bias from professors with expectations for individual students
35
with whom they are familiar (Imrie et al. 2014). Neither exit exams nor examembedded questions provide true longitudinal data, which can allow educators to pinpoint areas of weakness in the curriculum. Here, we describe a comprehensive method of program evaluation that provides detailed longitudinal assessment of program goals while minimizing time constraints and mediating potential biases. The described changes in evaluation methods took place within the biology discipline in the school of Science and Technology at Georgia Gwinnett College (GGC). GGC is a relatively new public, four-year, access institution that has grown rapidly in the last decade (from fewer than 100 students to almost 13,000 since being established in 2005). However, classes remain relatively small; biology classes are usually 24 students. Additionally, the college is highly diverse, 73% non-white, and has many students (36%) who are the first in their family to attend college. Importantly, biology majors at GGC are demographically representative of the entire school. Biology majors are expected to show proficiency in content and laboratory skills as determined by seven program goals designed by the discipline’s faculty (Table 1). Previously, program goals were assessed by measuring course goals using exam-embedded questions given to every student. These multiple-choice questions were on the final exam of every section of every course and graded by the corresponding professor. If an evaluation tool is to serve as formative for the faculty to modify the program, it must reveal a chain of causality; meaning instruction provides (or does not provide) increasing content knowledge for students (Hawthorne 1989). Because the previous method lacked consistent, unbiased, longitudinal assessment of any of the program goals, we were unable to robustly assess content achievement in any program goals. Table 1. Program Goals for the biology program at Georgia Gwinnett College. 1. Communicate in oral and written form the ability to locate, critique, and utilize scholarly resources. 2. Demonstrate proficiency in basic lab skills and experimental design. 3. Apply basic chemistry and math to the study of the life sciences. 4. Know the structures and functions of cells. 5. Know the structures and functions of biomolecules (nucleic acids, pro teins, lipids, carbohydrates). 6. Explain the sources of genetic variation and determine patterns of inheritance. Describe the role of evolutionary mechanisms in biological diversity.
36
For many years, students at all ranks had consistently reached our ‘satisfactory rate’ of 70% or more for every goal. These high levels of success could either have been due to genuine measurement of knowledge and skills or insufficient rigor on questions. As a result, faculty confidence in assessment was low. Surveys conducted at the discipline level suggested faculty did not agree with the following assertions: (1) our current assessment methods significantly help to inform teaching, (2) accurately reflect our majors’ knowledge and skills, or (3) the amount of time and energy we spend on assessment is appropriate. These results broadly match faculty opinion of assessment elsewhere (Emil and Cress 2014). Therefore a new measurement tool and evaluation method was designed by faculty in the biology program in order to improve our ability to discern areas in need of remediation. The measurement tool consisted of a single comprehensive exam given to randomized subsets of students from all ranks in the core courses required for completion of a biology degree. The exam included open-ended questions (free response) in addition to multiple-choice questions to evaluate application, rather than simple retrieval. The importance of free response questions in the assessment of higher order learning is well established (e.g., Birenbaum and Kikumi Tatsuoka 1987, Becker and Johnston 1999, Nichols and Sugrue 1999, Resnick and Zurawsky 2007, Heyborne et al. 2011). Essay and short answer questions can allow students to cover a wider range of content than a multiple choice or matching question, they more easily assess the integrative and/or applied levels on Bloom's taxonomy as students are typically asked to “apply” or “explain”, and allow students to express their reasoning for a given answer, providing important information for formative assessment. The exam was administered to a random selection of courses at the beginning of the semester, thus uncoupling student performance with professor evaluation, ‘teaching to the test,’ or confusing student knowledge with ‘cramming’ for a final. Identical tests were given to students at all levels (freshmen, sophomores, juniors, and seniors), providing consistency and facilitating an instantaneous, longitudinal comparison of student performance before completion of the program. In addition to the standardized tests, we gathered a sample of lab reports from classes common to all students in the program. Student-written lab reports facilitated assessment of goals 1 and 2 which pertain to scientific communication and experimental design. Tests, as well as lab reports, were scored simultaneously by a panel of biology faculty from diverse sub-disciplines.
37
Grading was blind; graders had no knowledge of student identity, rank, or course. We hold this assessment method reduces subjectivity, while providing detailed analysis of student progress through a program in time to affect change. It is efficient and provides faculty full control over program assessment while not being overburdensome. Here, we provide a description of the method with brief examples of the data it provides. Our method is not specific to biology or STEM programs and easily could be applied to other curricula at other institutions. Methods Design and Administration of the Assessment Exam To assess the program, we designed and administered a standardized test to a sample of students at each level of the biology program. The exam consisted of twenty to twenty-five multiple-choice questions and one or two open-ended, short answer questions (free response). At first, questions were created by faculty in the discipline, but recent versions of the exam consisted of vetted questions derived from open-source concept maps (e.g., American Association for the Advancement of Science: http://assessment.aaas.org/topics/ and San Diego State University Division of Undergraduate Studies: http://go.sdsu.edu/dus/ctl/cabs. aspx). Each question was directly linked to a program goal. The exam was administered to a randomized, representative set of core biology major courses during the first week of the class; if the course had a lab then the test was administered during lab. Half of the common courses were assessed in the fall and half in the spring. Therefore, all courses common to the core were evaluated each academic year. The program goals evaluated are shown in Table 1. A total of 558 biology majors from fall of 2014 through fall of 2016 were evaluated. Students were required to take the exam, but were asked for informed consent to allow use of their responses in publication. Only data from students who gave consent are presented in this paper. Exam questions were optimized over the duration of the project, thus no questions were used on more than one exam during the duration of the study. Tests were given by a designated test administrator (i.e., a faculty member not associated with the course) at the beginning of each semester. Test administrators read from a standardized script which provided reasoning for the exam. At first, students provided an anonymous identification code, but more recently, students provided their
38
student ID in order to analyze additional information collected by the Office of Academic Assessment, such as college admission test scores and grade point averages (GPA) and true academic rank. The anonymous identification code or student ID were on both the multiple choice and free response sections of the exam to ensure easy tracking of individual student performance. Grading Exams Multiple-choice questions were scored with Scantron ScoreIT software. For each free response question, a panel of full-time faculty graders worked collaboratively to create a rubric before grading (see Stevens and Levi 2013 for information about rubrics). Graders were blind to the identity, current course, and rank of the students being assessed. This was done in an attempt to remove potential biases that can arise when grading the work of students with knowledge of expected performance. Additionally, faculty were given ten control questions used for standardization of the free response to attempt to discern grading bias. For the first two years, faculty who volunteered for grading were awarded a modest stipend for their day’s work. More recently, administration and grading of the exam fell to the program goals committee. Collection of Demographics At the time of the exam, a separate survey was given to students to assess demographic data such as gender, age, and race. To avoid influencing performance by drawing attention to cultural groups, i.e., stereotype threat (Steele, et al. 2002), this survey was given only after completion of the content sections of the exam. The demographics survey also gathered data about major, career plans, enrollment status (full-time or part-time), and workload. Determining Rank Unfortunately, determining level in the program (e.g., freshmen, sophomore, junior, or senior) is difficult since students often do not correctly report their rank, or have deferred taking courses in the program for several semesters resulting in their rank by hours not equivalent to progress in the major courses. Therefore, we determined rank in the program by combining information on each student’s self-reported rank, the class in which the test was administered, and which classes they report having passed. Together, these responses provide a more accurate measurement of each student’s rank with
39
respect to their degree. When ‘rank’ is mentioned throughout the paper, it is their rank using the above described ‘algorithm’. Our ranks include freshmen, sophomore, junior, and senior Grading of Lab Reports Our first program goal addresses students’ ability to communicate scientifically and perform scholarship. To assess this goal, we asked professors from core biology courses to submit lab reports assigned during the semester. Lab reports were stripped of class and student identification when graded, but unfortunately, they could not be completely anonymized because the subject matter of the class dictated the subject of the lab report. Thus faculty who have taught the course were potentially able to surmise the course of origin. Demographic data was not taken for students submitting lab reports. Therefore, lab reports were analyzed by comparing classes, which roughly corresponded to rank. To control for professor grading differences, faculty scored lab reports together in the same room, used the same grading rubric and tried to standardize grading using a ‘practice’ lab report. Additionally, faculty were unknowingly given five of the same lab reports to allow for detection of significant differences in grading. Faculty who volunteered for grading were awarded a modest stipend for their day’s work. Statistical Analysis Difference between means were tested with Student’s t-tests and ANOVA. Significant differences among groups were compared using TukeyKramer post hoc tests. Comparison of scores on multiple-choice and free response questions was performed with paired t-tests with individual students as replicates. Sample sizes vary depending on the comparisons being tested and whether or not the particular exam required students to provide the relevant information. Analysis was performed using JMP 13 statistical software from SAS. Results Demographics Race and ethnicity data, which were only measured in the fall of 2014, matched those of the biology department and school as a whole, indicating our sample was representative. 63% of students tested were female, 57% of students
40
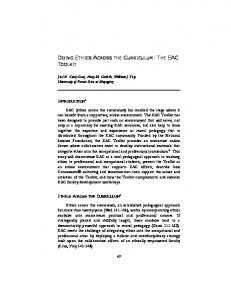
were traditional college age (18-22 y), and 82% maintained a full-time college schedule (12 credit-hours or more). 82% of students had a job outside of school, with 18% of the total working more than 30 hours a week. A third of students indicated English was not the primary language spoken in their home. 47% of students surveyed intended to enter medical school after completing their bachelor’s degree, 29% planned on attending graduate school, and the remaining 24% were split between careers in other health professions, education, or an unlisted field. Career plans did not differ noticeably across ranks. Item Analysis Using ScoreIt, individual questions were analyzed to evaluate student performance across ranks in the program and to identify moments in the academic experience where key student misconceptions were addressed. An example of the data available by question is shown in Figure 1; it shows the percentage of students who chose each answer (A-E) for each class rank. More students progressively chose the correct answer B, while E was progressively chosen less frequently. Answer A appears to be a distractor, while answer D is eliminated as a plausible choice by students by their junior year. Using this information, we can analyze each question to determine how students progress through the program at a conceptual level. Figure 1. Diagram of student choices on an example multiple-choice question across rank. Each multiple-choice question linked to a core concept was analyzed individually using ScoreIt and JMP. The relative proportion of answers was broken down by rank within the program. Column width corresponds to sample size.
41
In addition, ScoreIt provides point-biserial correlation analysis, which correlates (1) the likelihood each question is answered correctly with (2) the students’ overall grades on the exam (Varma 2008). A question with a low pointbiserial value is one more likely to be answered correctly by students who did poorly on the exam overall than students who did well overall. Such questions should be evaluated for confusing wording or for not matching the style or content of the rest of the exam. Overall Scores Mean scores of all tests combined was 48 +/- 17%, well below the historical goal of 70% set by the program’s faculty. There was a significant interaction between student rank within the program and the semester the test was given (Fig. 2), indicating differences in the questions on the exam across semesters. Full factorial ANOVA analysis confirmed both rank and exam are significant determinants of overall score (Table 2). However, most tests showed a significant jump only between incoming freshmen to first-semester sophomores. After the freshman year, there were no differences among the top three ranks, excepting the fall 2016 exam, when seniors scored significantly higher than their lower-ranked peers. Influence of Sex and Ethnicity Effects of demographic differences were also assessed and we report a few intriguing findings here. Across exams, males performed significantly better than females (male score = 52 +/- 18, female score = 45 +/- 16, t = 4.3, df = 446, p