ASSESSING STUDENTS' LEARNING WHEN USING SOFTWARE ENGINEERING WEBWORLDS Peter D Chalk South Bank University School of Computing London SE1 0AA
[email protected] www.sbu.ac.uk/~chalkp/ww
ABSTRACT Web-based interactive learning environments (Webworlds) for software engineering education can be categorised in terms of their modelling capabilities - exploratory or expressive. A model as an 'object to think with' can be a powerful tool for monitoring the way students learn. Exploratory Webworlds (such as simulations) provide an environment in which students can explore the effects of changing variable values. The focus here is on expressive modelling using diagramming tools freely available on the Web and the results of student assignments are used to highlight features that support learning. Methods for researching, monitoring, providing feedback to and assessing work produced by students are demonstrated, using a collaborative Web space and a method for analysing the 'learning paths' will be described. Preliminary data analysis appears to support the claim for enhanced studentcentred learning and the need for further research. Keywords Webworlds, modelling environments, Web supported learning, software engineering education.
1. INTRODUCTION There is some evidence that students benefit from using Web-based learning environments (Webworlds) to learn some aspects of software engineering [2]. It has been argued that one method of categorising Webworlds is to consider them to be modelling environments in which students can explore a given model or express their Permission to make digital or hard copies of all or part of this work for personal or classroom use is granted without fee provided that copies are not made or distributed for profit or commercial advantage and that copies bear this notice and the full citation on the first page. To copy otherwise, to republish, to post on servers or to redistribute to lists, requires prior specific permission. th
Annual Conference on the Teaching of Computing, 8 Edinburgh © 2000 LTSN Centre for Information and Computer Science
own model [1]. This paper considers the hypothesis that increased learning takes place when students are actively engaged in expressing their own model, a view suggested by the work of Laurillard, Papert, Mellar et al, and others [8], [11], [10]. In addition, it compares two Webworlds that are both diagramming tools but where one has the capability of executing its model. A methodology for researching the learning taking place (using students' models and comments stored in a collaborative Web space BSCW [6]) can also be used to assess the process of students doing an assignment. This generates additional material for the tutor to base an assessment upon and addresses a number of problems such as assessing individual contributions to group work, plagiarism, and students who do not attend tutorials. Tools for assessment are still in a pilot stage but include metrics for collaboration, learning paths and students' self-reporting. Initial results (as students are completing their second and final assignment of this semester) are positive. They show support for both the BSCW scaffolding of the learning process and for an element of apprenticeship learning [9].
2. WEBWORLDS UNDER STUDY Three Webworlds were chosen for assignments on a Level 2 Software Engineering Unit taught by the author to approximately 100 Degree and non-degree (HND) students. Topics under study that require practical activity were matched to available Webworlds (WWs) as follows: a.
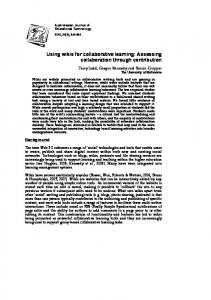
Use of a CASE tool to design and develop program code: JSP Editor (see Figure 3);
b.
Calculating complexity metrics and white box testing: Java Flowgraph Editor (see Figure 2);
c.
Dynamic performance Animators (see Figure 1).
analysis:
Sorting
The Sort Animator (Figure 1) is classified here as an example of exploratory modelling as it is used here solely for the purpose of measuring and analysing the performance of different algorithms. Other, similar, animators were made available from the unit Web site, allowing the students to vary parameters
such as the sort algorithm chosen and the amount and ordering of data.
be thought of as executing the model. It is hypothesised that this feature will enable students to compare the output with the expected (or found) code and hence verify the correctness of their design. This powerful feedback is analogous to that obtained in Papert's Logo microworld [11].
Fig. 1 Sort Animator: exploratory modelling.
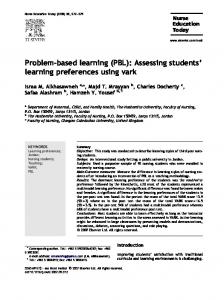
The Java Flowgraph Editor (JFE, [3]) in Figure 2 was chosen to assist with the drawing of flow graphs used to calculate McCabe's complexity metric and the number of paths need for structural testing. See Pressman [12] for an explanation of these topics. The drawing of a diagram (or model) is an example of expressive modelling and this is hypothesised to be an example of active learning, hopefully an improvement on passive learning. For their assignment, students were asked to draw the flow graph and deposit their diagram in the BSCW web space. Feedback on the diagram (or model) was then provided by their peers, or by the tutor.
Fig. 3 JSP Editor: diagram tool and code generator
3. STUDENT ASSIGNMENTS The first assignment was set in the beginning of the semester (in February and March this year) following pilot trials on an earlier Data Structures and Algorithms unit. Students (who had previously covered software development in depth in level 1) were asked to add a new option to a menu-driven program, design, code and test it, reporting on metrics and the use of an on-line learning environment. The on-line environment which they had to use consisted of a collaborative Web space called BSCW (Basic Support for Co-operative Work [6]), the unit Web site and links to the two Webworlds JSPE and JFE contained within BSCW. This meant that their (at least) initial following of those links could be recorded and notified to the tutor/ researcher. Students had to store their work in the BSCW team areas and, again, these events were notified by daily email and by lists on demand.
Fig. 2 Java Flowgraph Editor: expressive tool.
The second CASE tool, which is also freely available on the Web, is JSP Editor (JSPE shown in Figure 3 [5]). JSPE assists with the drawing of JSP diagrams (expressive modelling) and has a number of other features which make it a more advanced tool than JFE. First, it enforces the correct syntax of a JSP diagram and an attempt to breach it is not allowed. You have to choose whether you want it to draw a sequence, selection or iteration and cannot use freehand drawing. Second, it has the very powerful feature of a development CASE tool of translating the JSP diagram into C (or Pascal) code. This can
The second assignment (in April and May this year) consisted of analysing the performance of sort algorithms and re-engineering the sort option within the same system, using the same environment as in assignment 1. Again, the students had to use the sort animator Webworlds whose links were given via BSCW for recording purposes, as well as the other two Webworlds, JSPE and JFE.
4. RESEARCH METHODOLOGY Some of the techniques described in [2] regarding the use of attitude questionnaires, interviews and pre and post-tests established, at least, that some students felt that they benefited from using Webworlds. However, it was not clear how. During the period of this study, more extensive use of BSCW records, the structure of the assignments
and the use of student reports and individual essays all contributed to a richer set of data to be analysed.
currently available. However, by following the changes in file contents, some learning paths were identified and counted. The results are shown in the table in Figure 5. The mark for Web work does not include marks for the students' collaborative work nor their individual evaluation essays. It is primarily a mark for the quality of their JSP design, flow graph analysis and coding/testing. It is thus a crude measure of their learning or exercise of knowledge or skill during the assignment.
In this paper we report on a number of techniques and tools which are now being refined (and hopefully will be automated) for the tracking of what the author terms learning paths which are considered to consist of a sequence of events that are generated on objects to think with. In addition, unprompted student self-reporting in their evaluation essays constitutes a body of written evidence, which has been coded, and the initial results are also presented here. Further evidence (not yet available) will be provided by their answers to a specific exam question on the topics covered by the research.
Group name
Web work mark
Group size
No. of files stored
'Learning paths'
H1
A-
4
11
0
4.1 Learning paths
H2
B
4
22
1
A typical learning path is shown in Figure 4. The objects to think with are the Webworlds (labelled ww), the models or diagrams (d) and comments (c). The student learner (s) and tutor (t), or other peer students, interact with the objects, following links (l), saving their model or comment (sa), reading a comment on it (r) and, hopefully, correcting the model and storing an amended version (d1a here). This is hypothesised to constitute a learning path and evidence of learning in the form of an improved model, similar to the learning cycle of Kolb [7] and many others.
H3
B
4
4
0
H4
B-
4
5
0
C2
A-
4
13
6
C3
A
2
13
0
C5
D+
4
18
0
C6
A-
2
23
1
C7
B
3
18
0
C11
D
4
5
0
C12
A
4
22
1
C14
A
4
13
0
C16
D
1
1
0
ww
Fig. 5 Assignment 1 Web collaborations (c=0.47)
l 3/4, 11/4
s
sa 3/4
d1
r 5/4
t
r 9/4
c1 sa 11/4
sa 7/4
d1a
Fig. 4 Learning Path (s=student; t=tutor; ww=webworld; d=diagram; c=comment; l=link; sa=save; r=read; 3/4=date)
Large volumes of BSCW data have been gathered in an attempt to construct learning paths, but a full analysis has not yet been attempted and may require an automated tool. The data does allow a crude numerical analysis of results to be undertaken and this is shown in the following section.
4.2 BSCW Metrics During both assignments, BSCW team areas, event lists and files stored were recorded, some metrics gathered and the results analysed. The author was responsible for two tutorial groups (called H and C) and for the 40 or so students, grouped by an average of four. For the first assignment, only the very crude figure of number of files stored is
The correlation coefficient of 0.47 between the mark and the number of files stored indicates a possible relationship. There are not enough learning paths identified to carry out any statistical analysis but, as can be seen, all students who did respond to feedback and improve their model achieved an A or B grade. Unfortunately, as evidenced elsewhere, students are not yet experienced enough in the use of Webbased collaboration to make full use of feedback and there is some evidence of shyness or lack of confidence in posting comments, attempts at solutions and responding to tutor feedback. Lack of response could also be due to tutor inexperience, assignment structure and unclear assessment criteria. The table in Figure 6 shows a similar set of results for students during assignment 2 (which has just finished at the time of writing). Preliminary analysis has not yet shown up many learning paths, again, perhaps for the reasons cited above. Certainly this is an area the author intends to investigate further. One possibility will be the writing of a tool to identify possible paths from the daily event lists as they accumulate. Contenders can then be analysed by the inspection of the model and comment files.
Web work mark
Grp size
Used web
Events in BSCW
Days when hits
Learn paths
H1
A+
4
4
49
13
1
H2
B+
5
2
37
5
0
H4
A-
3
3
11
4
0
C2
A
4
4
75
16
1
C3
A
2
2
16
5
0
C6
A
3
3
42
10
0
C11
D
4
0
0
0
0
C12
A+
4
4
107
14
1
A+
4
4
98
11
1
Grp
C14
4.3 Student responses The table in Figure 7 lists a selection of quotes from the 32 student essays written following assignment 2 only. The comments have been coded (but not yet independently verified) according to some of the criteria identified in previous papers ([1, [2]) and judged as positive or negative together with the number of students reporting this or similar responses. n
BSCW Freq.
"Used more than last time"
+
7
Collab & feedback
"Excellent for group & lecturer to work together"
+
13
"Some people do not like it, needs synchronous features"
-
4
"Essential projects"
+
1
Apprentice
in
larger
scale
Java Flowgraph Editor Tool Usability
"Found it difficult to use, as did others, not useful"
-
12
Visual
"Nested loops are shown"
+
1
"We are now familiar with its use and confident using it"
+
4
"Don't like it"
-
2
JSP Editor Freq. access Attitude
&
+
21
"Lacks complete notation"
-
6
Execute
"Differences can be seen between generated C code & the Sort Web site"
+
15
Explore
"We analysed and compared algorithms"
+
7
Features
"Easy to re-engineer as various sites provided code"
+
2
Visual
"Produced results"
+
3
very
interesting
Webworlds & WBL
Marks in assignment 1 and 2 for teams that appear in both tables correlate at 0.96, which is very high, showing little change in ability and acting as a confirmation figure. The correlation between marks and number of files (not shown) in assignment 2 was 0.64, somewhat higher than assignment 1. An additional and similar correlation, between the number of events and the marks, was 0.61 so, possibly, the main feature is that students made more use of BSCW once they knew it was to be marked and the students with higher ability, not surprisingly, made the best use of it. All the groups showing learning paths scored A grades and had the most days when BSCW events occurred.
Typical comment
"Useful when designing"
Sort Animators
Fig. 6 Assignment 2 Web collaborations
Code
Tool Usability
Learning tools
"Consolidates CASE tools"
learning
of
+
3
Apprentice
"Very interesting that tools [& code] used by engineers can be found"
+
3
Resource
"Research available"
+
3
material
readily
Fig. 7 Student responses (n = approximate number of students making a similar response; total 32)
The results for BSCW show a very high level of student satisfaction and acknowledgement of the role it can play in their learning. An example quote about the use of BSCW to discuss their model was "When I accessed his flowgraph I found an obvious mistake". This bears out the concept of having objects to think with in the form of models (diagrams in this case) which express a logical structure or design. The comments on JSP Editor also confirm the importance of having an executable model. An example of how a student found JSPE's executability useful is in the quote: "I know there are errors in the design as I was unable to illustrate the nested loops in the generated code". Many other quotes such as this are not listed in Figure 7 but show in detail exactly how this aspect helped. Comments on JFE negatively confirm the need for an executable model but also criticise heavily its usability. Comments about the Sort Animator and other similar Webworlds reflect those reported in [1] and elsewhere about the usefulness of visualisation in computer science. Comments on how students realised they were using software and tools that are similar to those used by professionals add weight to the theory of apprenticeship learning [2]. Follow-up interviews are planned to investigate these comments in more depth and relate them to BSCW records. Students of weaker ability will need to be interviewed to discover why they have not used BSCW or tried to get tutor feedback on their models. Suggestions for additional or improved Webworlds will also hopefully result.
5. CONCLUSIONS The results presented in this paper cannot be said to justify a definite conclusion about student learning using Webworlds. The most positive results concern the correlation between BSCW usage and the quality of work produced but this does not show that one causes the other. Student self-reporting supports the hypothesis that the additional features in JSP Editor (particularly the code generation or executability) make it a much more powerful tool than JFE. There is sufficient evidence here to justify the use of BSCW and Webworlds as appropriate examples of open and distributed learning environments and tools to support student-centred learning. Finally, some measures and techniques for continuing research in this area are presented and show some promise, particularly if they can be automated. Already, the results are assisting with assessing students based on the process of their assignment, an additional benefit worth consideration by the facilitators (and assessors) of future student-centred learning. Additional facilities are required within BSCW (or its equivalent) and the Webworlds themselves if data is to be collected to provide greater insight into what the students are doing within their assignments (rather than just viewing the interactions from the outside using the admittedly crude techniques described in this paper)*.
6. REFERENCES [1] Chalk, P. D., Webworlds - Web-based modelling environments for learning software engineering, Journal of Computer Science Education 10.1, 1-18 (2000). [2] Chalk, P. D., Apprenticeship learning of software engineering using Webworlds, Proceedings of ACM ITiCSE (2000, to appear). [3] Cumberbatch, S. Java Flowgraph Editor, Final year project report, South Bank University, Web
Site: http://www.sbu.ac.uk /~chalkp/proj/sharron (1999). [4] Dershem, H. L. and Brummond, P., Tools for web-based sorting animation. Proceedings of the 1998 SIGCSE Symposium, Atlanta, 222226. Web Site: http://www.cs.hope.edu /~alganim/ccaa/ccaa.html (1998). [5] Engström, H., JSP Editor, Web Site. http://www.ida.his.se/ida/~henrike/JSP/example. chtml (1997). [6] Horz Informatik, Basic Support for Co-operative Work (BSCW), Version 3.1, Web Site: http://www.horz.technopark.gmd.de/ (1997). [7] Kolb, D. A., Experiential Learning. Englewood Cliffs, N. J.: Prentice-Hall (1984). [8] Laurillard, D. Rethinking University Teaching: A Framework for the Effective Use of Educational Technology, Routledge (1993). [9] Lave, J. and Wenger, E. Situated Learning: Legitimate Peripheral Participation, Cambridge University Press (1991). [10] Mellar, H., Bliss, J., Boohan, R., Ogborn, J., and Tompsett, C. (Eds.) Learning with Artificial Worlds: Computer Based Modeling in the Curriculum, The Falmer Press (1994). [11] Papert, S. Mindstorms: Children, Computers and Powerful Ideas, Brighton, Sussex: Harvester Press (1980). [12] Pressman, R., Software Engineering: Practioner's Approach. McGraw-Hill (1997).
A
* The author would like to thank a reviewer for this final remark.