Aug 27, 2018 - on air, water, marine and land environment and biodiversity. Several DNAs ...... dicators such as access to clean energy, sustainable mobil- ity, better ...... as analysts have regularly suggested may be the case (Bel- lassen et ...
Randall Spalding-Fecher, Amrita Narayan Achanta, Peter Erickson, Erik Haites, Michael Lazarus, Neha Pahuja, Nimisha Pandey, Stephen Seres and Ritika Tewari
ASSESSING THE IMPACT OF THE CLEAN DEVELOPMENT MECHANISM REPORT COMMISSIONED BY THE HIGH-LEVEL PANEL ON THE CDM POLICY DIALOGUE
FINAL REPORT July 15, 2012
ISBN: Printed in Luxembourg
ASSESSING THE IMPACT OF THE CLEAN DEVELOPMENT MECHANISM REPORT COMMISSIONED BY THE HIGH-LEVEL PANEL ON THE CDM POLICY DIALOGUE
Randall Spalding-Fecher, Amrita Narayan Achanta, Pete Erickson, Erik Haites, Michael Lazarus, Neha Pahuja, Nimisha Pandey, Stephen Seres and Ritika Tewari
FINAL REPORT July 15, 2012
Table of contents Executive summary..................................................................................................................................4 Key findings on the impact of the CDM..............................................................................................................................................................5 Options for enhancing the impact of the CDM...............................................................................................................................................9
Acknowledgements................................................................................................................................ 14 Acronyms.................................................................................................................................................. 15 List of figures.......................................................................................................................................... 16 List of tables........................................................................................................................................... 17 1 Introduction....................................................................................................................................... 18 2 �Impact on Annex I Party ambition levels through cost-effective emission reductions........................................................................................................................ 20 2.1 �Impact on minimizing the marginal costs of emission reductions achieved by Annex I countries....................... 21 2.2 �Mitigation cost-effectiveness by project type.................................................................................................................................. 25 2.3 �Impact on the ambition of commitments for the first commitment period of the Kyoto Protocol....................... 27
3 �Impact on sustainable development......................................................................................... 28 3.1 �Current UNFCCC requirements and procedures.............................................................................................................................. 29 3.2 �An overview of sustainable development criteria set by DNAs.............................................................................................. 31 3.3 �Literature review on sustainable development benefits............................................................................................................ 35 3.4 �Analysis of sustainable development impacts reported in registered PDDs................................................................... 43 3.5 �Assessing claims of negative impacts of CDM projects............................................................................................................. 47 3.6 �Options for enhancing the sustainable development contribution of the CDM............................................................. 50
4 �Impact on net GHG emission reductions ................................................................................ 54 4.1 Framework for analysis............................................................................................................................................................................... 55 4.2 CER flows: historical and projected........................................................................................................................................................ 56 4.3 Additionality – assessing the evidence............................................................................................................................................... 60 4.4 �Potential for over- or undercrediting under the CDM................................................................................................................... 71 4.5 �Options for improving the net mitigation impact of the CDM................................................................................................. 76
5 �Impact on energy security and clean energy investment in developing countries................................................................................................................. 84 5.1 5.2 5.3 5.4
Impact on energy security......................................................................................................................................................................... 85 Impact on renewable energy investments........................................................................................................................................ 86 Impact on the use of domestic fossil fuels...................................................................................................................................... 98 Impact on energy efficiency................................................................................................................................................................... 100
6 �Impact on technology transfer .................................................................................................102 6.1 �Technology transfer under the Convention and its Kyoto Protocol ................................................................................... 103 6.2 Developments at the Executive Board ............................................................................................................................................ 103 6.3 �Technology transfer requirements at the DNA level................................................................................................................. 103 6.4 Key findings from the literature review............................................................................................................................................ 104 6.5 �Analysis of reporting on technology transfer in PDDs.............................................................................................................. 106 6.6 Options for enhancing technology transfer.................................................................................................................................... 108
3
7 �Financing for CDM projects........................................................................................................110 7.1 7.2 7.3 7.4 7.5 7.6
Total investment leveraged by the CDM......................................................................................................................................... 111 Comparison of CDM and non-CDM projects.................................................................................................................................. 114 Foreign and domestic finance............................................................................................................................................................... 117 Sources of foreign finance...................................................................................................................................................................... 119 Types of finance.......................................................................................................................................................................................... 119 Barriers to investment in CDM projects........................................................................................................................................... 120
8 �Regional distribution of CDM projects..............................................................................................................................126 8.1 �A brief history of the regional distribution issue.......................................................................................................................... 127 8.2 Status quo of regional distribution..................................................................................................................................................... 127 8.3 Drivers of regional distribution............................................................................................................................................................. 130 8.4 �Options for enhancing the regional distribution of and access to the CDM.................................................................. 132
9 Suppressed demand ....................................................................................................................136 9.1 Background and definitions.................................................................................................................................................................... 137 9.2 Suppressed demand under the CDM ............................................................................................................................................... 140 9.3 Implications and concerns...................................................................................................................................................................... 142
10 Conclusions......................................................................................................................................144 10.1 Key findings on the impact of the CDM........................................................................................................................................ 145 10.2 Options for enhancing the impact of the CDM.......................................................................................................................... 158
11 References ......................................................................................................................................154 Annex A �Research questions from the terms of reference..................................................169 Annex B Data sources and projections of CERs........................................................................171 Annex C �Detailed mitigation costs by length of crediting period.......................................172
Executive summary
Executive summary
The clean development mechanism (CDM) Policy Dialogue was established by the CDM Executive Board (EB) in late 2011, with the objective of providing recommendations on how best to position the CDM to respond to future challenges and opportunities so as to ensure the effectiveness of the mechanism in contributing to future global climate action. The CDM Policy Dialogue is implemented by a High-Level Panel, which is composed of distinguished individuals who possess a broad range of experience and expertise in fields of relevance to the operation and aims of the CDM. This report on assessing the impact of the CDM is one of three research reports commissioned by the High-Level Panel on the CDM Policy Dialogue, the other two covering the governance of the CDM and the future context of the CDM. The objective of this report is to provide an independent assessment of the impact of the CDM across a broad range of
5
metrics and possible effects. The impact of the CDM is assessed firstly in relation to its original purposes stated in Article 12 of the Kyoto Protocol, namely “to assist Parties not included in Annex I in achieving sustainable development and in contributing to the ultimate objective of the Convention, and to assist Parties included in Annex I in achieving compliance with their quantified emission limitation and reduction commitments”. Beyond sustainable development and cost-effective emission reductions, there are other potential impacts of the CDM that have been highlighted by stakeholders in their submissions to the CDM Policy Dialogue and in the literature on the CDM. These include potential impacts on technology transfer, financing, net global greenhouse gas (GHG) emissions, energy security, clean energy investment and the regional distribution of projects, which are all also addressed in the report. The following summary highlights the key research findings as well as options for enhancing the positive impacts of the CDM.
Key findings on the impact of the CDM Impact on the cost of compliance for Annex I countries The analysis presented in this report suggests that the lower bound of savings for Annex I countries through the CDM is $3.6 billion. This is based on both government and private-sector savings. For the private sector, the CDM may have reduced compliance costs for firms in the European Union emissions trading scheme and Japan by at least $2.3 billion for the period from 2008 to 2012. These savings were estimated based on the extent to which certified emission reduction (CER) prices have been below European Union Allowance (EUA) prices. Since CERs have also had the effect of lowering the price of EUAs, the overall savings are likely to have been understated. For the public sector, the use of CERs by Annex I governments to meet their national emission limitation commitments will yield an additional $1.3 billion in savings.
Impact on sustainable development At an operational level, designated national authorities (DNAs) articulate the concept of sustainable development to include at least three dimensions: the social, the economic and the environmental. The actual definition of sustainable development criteria and indicators, however, differs significantly across countries.
The majority of the studies on the impact of the CDM agree that the CDM has a positive impact on the various facets of sustainable development in the host countries. Employment generation was one of the most widely reported impacts in the literature. Studies note that the CDM is the only climate change mechanism that offers an innovative solution to the challenge of how to incorporate sustainable development considerations into emission mitigation activities. Even some of the studies that question the extent of its sustainable development impacts find that the CDM has contributed to the development of a global carbon market, allowing for temporal and spatial flexibility in achieving emission reduction targets. A common view among stakeholder inputs to the CDM Policy Dialogue is that capacity-building for low-carbon development within developing countries may be one of the most important sustainable development impacts of the CDM. This capacity-building has not only engaged the local private sector in climate change mitigation and increased awareness of mitigation opportunities, but has also laid the foundation for domestic climate change policy, including emissions trading and other programmes, in many major developing countries. In terms of project types, most studies conclude that industrial gas projects have fewer co-benefits than renewable energy and forestry projects, but a few studies challenge this finding,
6
Assessing the impact of the clean development mechanism
arguing that industrial projects can also have significant benefits. All studies agree that renewable energy projects can be particularly beneficial to developing countries. A study comparing project impacts in different countries suggests that Indian projects bring greater benefits for infrastructural development than either Chinese or Brazilian projects, but with the involvement of less technology transfer. On the other hand, Chinese projects contribute strongly to the protection of the local environment and natural resources. A comparative assessment of the performance of labelled projects (i.e. projects with additional certification from outside of the UNFCCC, such as Gold Standard and Community Development Carbon Fund projects) versus non-labelled ones concluded that, overall, labelled projects do not significantly surpass non-labelled ones in terms of sustainable development benefits. However, the influence of labelled projects on the social aspects of sustainable development tends to exceed that of comparable ordinary activities, while the opposite holds true for their contribution to economic development. In addition to reviewing the literature, this study conducted an analysis of 202 registered project design documents (PDDs) to assess the reported contribution to sustainable development. The results of the PDD analysis show that 99% of PDDs reported sustainable development benefits: 96% mentioned economic benefits, 86% mentioned social benefits and 74% mentioned environmental benefits. Most of the PDDs mentioned more than one sustainable development benefit. Among sustainable development indicators, most of the PDDs mentioned benefits in terms of: improved local quality of life (82%), employment generation (80%) and contribution to national energy security (76%). In the sample of 79 small-scale and 123 large-scale projects, sustainable development benefits are mentioned more often in relation to small-scale projects than to large-scale projects. In the case of around 5% of the large-scale projects the PDDs did not mention any sustainable development benefit other than the transfer of technology.
reduction targets in the final agreement. The current negotiations on the future of the climate change regime, however, are very much informed by the quantitative analysis of various flexibility mechanisms and that analysis will be very likely to influence any future emission reduction targets.
Impact on net GHG emissions The CDM was intended as a zero-sum instrument, allowing increased emissions in developed countries in exchange for corresponding decreased emissions in developing countries, with no net impact on global GHG emissions. In practice, however, to the extent that some CDM projects may not have been additional, or may have been awarded more credits than the actual emission reductions achieved (e.g. due to overly high baselines, leakage or perverse incentives), the CDM could lead to a net increase in global GHG emissions. By contrast, if CDM projects have caused more emission reductions to occur than the number of credits issued and used (e.g. baselines are conservative and technologies outlast their crediting periods), then the CDM could lead to a net decrease in global GHG emissions.
Impact on Annex I Party ambition levels under the Kyoto Protocol
This report finds that, to a large extent, the assessment of the net mitigation impact of the CDM hinges on judgements regarding the additionality of CDM projects in the power sector, especially wind and hydro, but also natural gas, coal, waste-gas capture and biomass energy power projects. These project types are projected to be the source of over half of the CERs issued by 2020. Researchers have expressed concerns that a substantial portion of these projects should be considered non-additional, leading to a significant net increase in global GHG emissions. Project developers, in contrast, have asserted that these concerns are “outdated” or “unfounded”. If these projects are indeed largely additional, they would represent a potentially large source of undercrediting, owing to the potential for these projects to operate well beyond their 10- or 21-year crediting periods. The difference in views on power sector project additionality translates to a wide divergence in the total net mitigation impact of the CDM.
While in retrospect it is clear that the CDM has reduced the compliance costs for Annex I countries to meet their commitments under the Kyoto Protocol, the prospect of reduced costs due to the CDM does not appear to have been a factor in defining the ambition of the quantitative emission reduction commitments made by Parties in Kyoto in 1997. The complexity of the negotiations, the focus on other issues and the lack of information on the potential of the CDM meant that the negotiators did not make quantitative links between the availability of the CDM and the emission
Industrial gas (HFC and N2O) destruction activities have been among the most controversial CDM projects and by far the most important sources of CERs to date (i.e. accounting for 75% of issued CERs). While evidence suggests that perverse incentives and leakage have thus far led to more credits being issued than the actual emission reductions achieved, methodological changes and the expected decrease in the share of CERs issued and used for these project types mean that these projects are relatively less important in terms of the net emissions impact of the CDM going forward.
Executive summary
Impact on energy security While most CDM project types have the potential to increase security of energy supply by utilizing domestic resources or improving efficiency, it is difficult to see this impact at the national level. In terms of supply security, most of the major host countries are more dependent on imported energy than they were a decade ago. In addition, some of the proposed advanced fossil fuel CDM projects are located in coastal areas and will import their fuel, even though most of these projects use domestic resources. In terms of access, the CDM has had a limited impact on increasing access to energy services, but this is changing with the growth of programmes of activities (PoAs) focused on basic energy services and efficiency.
Impact on clean energy investment Almost all countries have significant renewable energy resources, the development of which could increase national energy security. Large-scale renewable power is the largest CDM project category and, within this, wind, hydropower and biomass are the largest contributors to new electricity capacity. Registered CDM projects have accounted for more than 110,000 MW of renewable electricity capacity over the last 10 years, which is roughly the total power generation capacity of Africa. More than 90% of this renewable electricity capacity is in five countries: China, India, Brazil, Vietnam and Mexico. The challenge is that the underlying economics of these large renewable-power projects, which are favourable in many markets, and the small contribution of carbon revenue to profitability make it very difficult to judge whether the projects are driven by the CDM or other widespread national incentives for renewable power development. Stakeholder views and the literature suggest that the CDM may have had a major impact on smaller renewable energy markets and catalysed market development in the wind power sector in India, but that projects may have been driven primarily by national incentives rather than CDM benefits in some sectors in China. Demonstrating additionality conclusively will always be challenging with these technologies, owing to the small financial impact of CERs. The CDM also includes substantial investments in natural gas (~27,000 MW) and high-efficiency coal (~16,000 MW), as well as in power generation using waste heat and waste gases (~6,000 MW). While these fossil fuel projects are generally based on domestic energy resources, some also use imported fossil fuels and there is no distinction made between these two types of projects, despite the
7
associated implications for energy security. High-efficiency and lower-carbon fossil fuel projects have faced accusations of being common practice, both because almost all new projects (particularly in India and China) are applying for the CDM and because the financial impact of carbon revenue is small, as is the case for wind and hydropower. Unlike the renewable power projects, however, the additional challenge for non-additional fossil fuel projects is that they lock in developing countries to relatively high-carbon growth trajectories. Energy efficiency has been almost entirely left out of the CDM, with few approved methodologies and projects, because the traditional barriers facing energy efficiency (e.g. split incentives, information asymmetries and transaction costs) have been amplified under the CDM. The success of the Indian compact fluorescent lamp programme notwithstanding, many experts argue that tapping energy efficiency potentials requires either a new, more focused, mechanism or significant changes in the CDM rules.
Impact on technology transfer While technology transfer is not explicitly included as an objective of the CDM, other decisions of the Conference of the Parties (COP) have alluded to the importance of technology transfer under the UNFCCC. In summary, the literature cites a range of impacts on technology transfer: from the CDM contributing “significantly” to technology transfer, through technology transfer taking place in less than half of the CDM projects, to technology transfer being minimal. Importantly, the latter study uses a more stringent benchmark for establishing technology transfer than all of the other studies. According to previous empirical studies, 27–39% of CDM projects report technology transfer as a component of the project design. However, because projects are not required to report technology transfer, a substantial portion of projects that do not explicitly claim this benefit may nevertheless involve some form of technology transfer. For example, a recent study based on a follow-up survey after an analysis of PDDs indicated that the actual proportion of projects involving technology transfer could be as high as 44%. Technology transfer is reported more often for large-scale projects. Most, but not all, studies find that unilateral and small-scale projects are less likely to involve technology transfer. Host-country policies can also have an impact on the rate of technology transfer. In addition, previous studies indicate that the frequency of technology transfer claims has remained stable as a share of the number of projects but has declined as a share of the estimated annual emission reductions.
8
Assessing the impact of the clean development mechanism
According to the PDD analysis carried out for this study, 27% of registered projects analysed reported some form of technology transfer. Most of these projects reported both transfer of equipment and knowledge. Some sectors, such as coal mine methane and reforestation, did not report any technology transfer within this sample, while others, such as renewable energy and methane avoidance, reported higher than average levels of technology transfer. Higher levels of technology transfer are reported for small-scale projects than for large-scale projects, which is surprising given the findings of previous studies and may reflect the smaller sample size. The analysis found that the leading countries in terms of transferring technologies were Japan, Germany, the USA, Denmark, Italy and the United Kingdom.
Financing for CDM projects The estimated capital investment for 4,832 registered or soon-to-be registered CDM projects is $215 billion. Annual investment peaked in 2008 at about $41 billion. A large number of projects are undergoing validation and they could lead to a new, much higher, peak for annual capital investment in 2012. Capital investment is dominated by wind and hydro projects and is concentrated in eastern Asia. Most investment in CDM and Annex I renewable energy projects comes from domestic sources. The indications are that the share of projects with foreign investment has been rising, both for CDM and Annex I projects, as project size has increased and the industry has grown. The share of projects with foreign investment is higher for Annex I projects than for CDM projects, but the gap appears to be narrowing. The pattern of foreign investment in CDM renewable energy projects is complex. About half of the projects with foreign investment receive funds from multiple countries. When the investment comes from a single country, it is a little more likely to come from an Annex I country than a nonAnnex I country. The largest individual flow of investment is from Hong Kong in Chinese projects. A comparison of CDM and Annex I renewable energy projects (e.g. geothermal, hydro, solar and wind) finds that CDM projects have a larger average capacity than similar projects in Annex I countries, often three or four times larger. CDM projects are 15% (solar photovoltaic) to 50% (geothermal and solar thermal power) less capital-intensive ($/ MWe capacity) on average than similar Annex I projects. The average capital investment in both CDM and Annex
I renewable energy projects has increased significantly over the past decade. Many of the barriers to investment in CDM projects (e.g. poor investment climate and regulatory frameworks) are not specific to the CDM project cycle, but are generic challenges faced in relation to domestic and foreign investments in developing countries. In addition, barriers at the international level (e.g. CDM rule complexity) may affect all countries, while national and project-level barriers (e.g. access to finance and lack of migration potential) influence the distribution of CDM projects and CERs across countries. Important CDM-specific barriers at the national level are the CDM regulatory framework and institutional capacity, which goes beyond the DNA to include the lack of project consultants, auditors and financiers within the host country.
Regional distribution of CDM projects As a market mechanism, the distribution of CDM projects and CERs has generally matched the distribution of mitigation potential across countries. This has meant that many countries with small economies and low emission levels have been left out of the CDM entirely, although the number of countries participating continues to grow. The emissions of many countries in Africa and the group of the least developed countries (LDCs), as well as some in Asia, constitute a very small share of non-Annex I emissions, so many do not yet host any CDM projects and those that do account for only for a small share of the CERs issued. While the most important driver of project distribution is national mitigation potential, the general investment climate is also critical. Having a strong CDM institutional capacity and framework is necessary but not sufficient in itself to attract projects. At the project level, lack of access to early-stage seed funding for CDM costs and the high unit transaction costs are important barriers to CDM project development in many poorer countries, but it is often the lack of underlying project finance that prevents CDM projects from moving ahead in the underrepresented countries. Because of their low emission levels and small national economies, opening up CDM opportunities for underrepresented countries will require the simplification and streamlining of the CDM rules, innovative approaches to the development of national capacity and the mobilization of financing for both transaction costs and underlying project investments.
Executive summary
Suppressed demand One of the challenges of applying GHG emission accounting approaches in poor communities is that the current consumption of many household services (e.g. heating and cooking energy, lighting and potable water) may not reflect the real demand for those services. This could be a result of lack of infrastructure, lack of natural resources or poverty, particularly the high costs of these services relative to household incomes. The situation of ‘suppressed demand’ creates a problem for setting baselines and has negatively
9
affected CDM project development in Africa, the LDCs and other underrepresented areas. Ironically, although new large-scale power plants do not have to show that they actually displace other plants (existing or new), many smallscale energy projects can only claim credit for displacing historical (very low level) emissions from households. The new guidelines from the EB on accounting for suppressed demand are an important step forward; implementing them will require significant expert and stakeholder input to ensure that simplification is balanced with maintaining overall environmental integrity.
Options for enhancing the impact of the CDM The options below have been developed on the basis of reviews of the literature, stakeholder inputs to the CDM Policy Dialogue process, interviews with experts in the field and the analysis conducted by the research team. Given that the focus of this research was on the impacts of the CDM, the options for the future have not been subject to a feasibility analysis or an analysis of the politics surrounding their implementation. For more detailed institutional analysis and context, readers are referred to the two other research reports prepared for the CDM Policy Dialogue on the governance of the CDM and the future context of the CDM. Not all of the options below can be implemented by the EB, as many would require the approval of the Conference of the Parties serving as the meeting of the Parties to the Kyoto Protocol (CMP) or may even be implemented by actors outside the UNFCCC. The actors involved in each option are illustrated in table ES1.
Sustainable development For most stakeholders sustainable development is one of the most important impacts of the CDM and there is a desire to enhance this impact. In addition, almost all stakeholders would agree that any interventions should not infringe upon the host country’s right to determine whether a given CDM project meets its sustainable development priorities. There is broad commonality across countries as to how they define sustainable development criteria at a high level, even if the detail of this application varies widely.
Depending on individual stakeholder priorities, there are three possible objectives of interventions related to sustainable development impacts: (a) increasing the overall sustainable development benefits originating from the CDM project pipeline; (b) measuring and reporting those benefits to the DNAs and other stakeholders; and (c) systematically preventing negative impacts. However, there may be differences amongst stakeholder groups in prioritizing interventions. For example, stakeholders that feel that CDM projects are generally delivering many positive benefits may want to focus on preventing negative impacts rather than increasing the monitoring of benefits. On the other hand, stakeholders that feel that negative impacts are best addressed at a national level may instead focus more on the measurement of impacts and enhancing benefits. The caveat to these choices is that it will be difficult to measure progress towards either greater positive impacts or fewer negative impacts without some form of monitoring and reporting system. Providing a ‘menu’ of sustainable development indicators could enhance the documentation of the sustainable development benefits of the CDM. This menu could be compiled from current criteria or other international sources. Given that most DNAs already have criteria, they could also make these more accessible by reporting their own sustainable development criteria on the UNFCCC website, just as the national definitions of forest are currently reported. Revising the PDD format to provide more guidelines on how project participants should declare their sustainable development contributions could assist DNAs in their
10
Assessing the impact of the clean development mechanism
decision-making process, whether or not the guidelines were linked to a list of specific indicators.
require broad political agreements as well as a sound empirical evidence base upon which to prioritize.
Improved voluntary reporting of sustainable development benefits could go a step further, providing for both initial and ongoing declarations. These declarations could rely on either DNA-specific guidelines or draw on international reporting options. Any monitoring would have to be designed in such a way as to minimize the transaction costs.
Capacity-building for DNAs could strengthen the ability of DNAs, particularly those with the least resources, to apply their national criteria for sustainable development in the project approval process. It could include the sharing of experiences at a regional and subregional level and providing information on ‘best practice’ in project evaluation.
Mandatory monitoring of sustainable development benefits would provide a much more robust information base for the DNAs and other stakeholders than simple declarations in the PDD. There are many variations to monitoring, but none of these should infringe on the host country’s sovereign right to determine whether a project meets its own sustainable development criteria. The DNA and project participants could choose which indicators were appropriate for the specific project, in the light of the host country’s priorities. The monitoring could be supervised by the DNA, according to national criteria and procedures, or could be part of the UNFCCC project cycle. Verification could be conducted at validation and/or during verification (i.e. after project implementation). While this would add transaction costs, without some verification it is unclear how reliable any reporting would be.
Although not discussed in detail in this report, an enhanced stakeholder consultation and appeals process could also strengthen positive sustainable development impacts. The options for this are discussed in the report on the governance of the CDM. DNAs could work towards strengthening the process of local stakeholder consultation. The relevant local authorities could be made more aware about sustainability issues and their role in the effective implementation of sustainable development benefits. Negative sustainable development impacts could be one of the possible grounds for a grievance. The governance reforms proposed under an enhanced stakeholder consultation and appeals process are also relevant to sustainable development impacts, particularly negative ones.
Safeguards against negative impacts, such as human rights violations, corruption and labour exploitation, could also be strengthened in several ways. As a first step, the DNA could ensure that claims of negative impacts were taken up within the legal structure and processes of the host country. In addition, the PDD could be expanded to include a checklist of key safeguard issues. As with the reporting of benefits, the reporting of safeguards could happen at the start of the project only, or they could be reported periodically after implementation. The verification of compliance with safeguards could be undertaken by the DNA along with the verification of sustainable development benefits. The consequences of inadequate performance could range from project developers being provided with information to assist them with compliance through to suspending the further issuance of CERs for a project. This could be based on the project not following through on sustainable development benefits and/or the project violating one of the safeguards. The DNA could decide on this, however, according to national criteria and procedures. Preferences for specific project types or technologies could be established to differentiate eligibility and procedures across project types, scales or regions. This would
Regional distribution Given the importance that the Parties have placed on the regional distribution issue, the following measures could increase access to the CDM in underrepresented countries and regions: Capacity-building for the local financial sector to mobilize domestic finance – Given that CDM projects are mostly domestically financed, enhancing the awareness and capacity of the local financial sector in underrepresented countries could increase the flow of finance to CDM projects. Host countries in which availability of capital is a constraint could also take steps to encourage greater domestic investment in CDM projects and to facilitate foreign investment in CDM projects. Including Africa in the ‘LDC track’ – Given that the guidance of the CMP on ‘equitable regional distribution’ always specifies Africa as well as the LDCs and countries with fewer than 10 projects, African countries could be included in all of the special provisions made for the LDCs in the CDM rules. Focused DNA support – Focusing on the sharing of experiences and best practices, particularly within regions, to faciliate joint decision-making on regional PoAs.
Executive summary
Grants and/or loans for transaction costs – The CDM Loan Scheme should be critically reviewed after one year to determine its effectiveness at removing barriers related to transaction costs. In addition, a grant scheme could be considered for some portion or all of these transaction costs, for particular project types or areas where the loan scheme is not effective. Standardization of parameters, including standardized baselines – The creation of a special standardized baseline track for household-level services (e.g. electrification, water purification and cooking). Guidance on specific standardized parameters (e.g. fraction of non-renewable biomass by country) should also be provided by the EB. Standardization of procedures – A further simplified the project cycle could be applied to projects from underrepresented regions, including automatic registration (e.g. the elimination of validation procedures in favour of listing projects with the UNFCCC on the basis of clear templates and checking these requirements at initial verification). This could also be done on the basis of project scale, with microscale projects benefiting from expedited procedures.
Technology transfer Several actions could improve the transparency of technology transfer benefits and enhance this impact of the CDM: Improved database and data availability would involve the UNFCCC improving the way in which data on technology components and transfer are generated from the large number of projects in the pipeline and presented. A database could be created with more information on technological specifications and the name of the technology supplier or technical project developer. This may further facilitate technology transfer for new countries and potential project participants. Improved reporting on technology transfer could address the issue of the limited information on technology transfer currently provided in PDDs, which is often inadequate and inconsistent. More comprehensive and clear information on technology transfer would enable better decision-making by DNAs. This would most probably require a revision to the PDD format and guidance. Guidance from DNAs could assist by providing a clear and more operational definition of technology transfer in the project approval process. Host countries could also influence the extent and nature of technology transfer by including technology transfer within their sustainable
11
development criteria, defining the criteria or indicators of technology transfer clearly and implementing these criteria stringently.
Net emissions impact Shifting towards the sectors with the highest degree of confidence in the additionality of their projects would improve the overall integrity of the CDM, but it would not lead to a net decrease in emissions. To achieve that objective other approaches such as discounting or shorter crediting periods would be needed. There are several options available that could potentially improve or increase the net mitigation impact of the CDM. Each option carries with it a set of advantages and limitations (discussed in detail in the main text of this report) and, in many cases, may run the risk of missing opportunities for otherwise-additional projects to proceed. The findings of this research indicate that: Discounting credits from particular project types may be a particularly effective option for increasing the net mitigation benefit of project types with relatively certain additionality and very low abatement costs (e.g. HFC destruction at HCFC-22 plants and N2O destruction at adipic acid plants). Shorter crediting periods may be a more effective option than discounting for increasing the net mitigation benefit of project types with higher capital costs (and lower recurrent costs) or where it is likely that projects are serving to accelerate the pace of technology adoption. Creating ‘negative lists’ (i.e. excluding certain project types) would be the most straightforward approach for project types where additionality cannot be determined with a high degree of confidence, such as some large-scale power generation project types, as discussed below. Other interventions, such as positive lists, standardized baselines and additionality, and transitioning to policy- or sectorbased crediting, could all potentially lead to net mitigation benefits; however, the mitigation outcome would be highly dependent on how such interventions were implemented (e.g. baseline levels and crediting thresholds chosen).
Large-scale power generation: wind, hydropower, natural gas and coal Determining additionality with a high degree of confidence is only possible for sectors or technologies for which the incentive provided by the CDM (i.e. carbon revenue) can be clearly demonstrated as the main cause of the project. This means
12
Assessing the impact of the clean development mechanism
that much more caution is needed in relation to projects in sectors where the incentive provided by the CDM is small relative to other decision-making factors and, as a result, the ratio of the ‘signal’ (CDM intervention) to ‘noise’ (other factors) is low. Research findings suggest that the likeliest incidence of a low ‘signal-to-noise’ ratio is in large-scale power generation, particularly wind, hydropower, natural gas and coal projects. Several options could address this concern: The improvement of the current additionality approach could seek to increase consistency, transparency and objectivity of investment analysis and common practice analysis. This should be based on detailed research on project economics to clarify the ‘signal-to-noise’ ratio for these project types. This research would involve detailed analysis of not only the impact of carbon revenue on registered projects (i.e. including assessment of actual carbon prices in contracts), but also the magnitude of this impact relative to variability in other key parameters (e.g. electricity tariffs, capital costs and other public incentives and measures). While there has been substantial research on this topic already, as cited throughout this report, no one has taken a comprehensive look at the financial details for these CDM project types. Nevertheless, there could be scope to improve consistency (e.g. whether to use common discount rates across a country rather than those in the PDD) and transparency (e.g. verifying some of the assumptions in the PDD by referring to independent sources) for these projects so as to clarify the share of truly additional projects. Alternative additionality determination approaches could also be used for technologies for which market-based investment analysis is not appropriate (e.g. where the main determinant of profitability and investment is public decision-making). Market penetration rates, default technology comparisons or other criteria could be used to test additionality rather than the current additionality tool. While the current standardized baseline development process of the EB does not include power generation yet, this could be expanded. The challenge of applying standardized baselines, however, would be that all renewables (except some large hydro and geothermal) are zero-emission sources, so they cannot be ranked by emissions, and the current
standardized baseline guidelines still consider financial attractiveness as a key criterion. Shifting some technologies to sectoral or policy-based (e.g. nationally appropriate mitigation action crediting) approaches, other new market mechanisms or noncredited climate finance instruments could reduce uncertainty within the CDM. Note, however, that similar challenges of identifying the impact of the carbon market signal on the development of the power sector must still be addressed under any market mechanism if it is to be used for offsetting (and even more so if it is to be used for net reductions). The restriction of eligibility by geography, scale or subtype could directly address the strongest additionality concerns related to market maturity, public incentives and low ‘signal-to-noise’ ratio for specific technologies by limiting the CDM to the geographies, project scales or subtypes for which there is the highest likelihood of conclusive additionality testing with investment analysis. The exclusion of entire categories or technology types would eliminate any uncertainty about additionality for those sectors, but this is obviously more politically difficult and also carries with it the risk of missed opportunities.
Suppressed demand Building upon the current work of the EB on suppressed demand, options include: (a) limiting methodological changes to account for suppressed demand to methodologies relevant to household services; (b) developing a clear plan for approving ‘minimum service levels’ and baseline technology choices, including who will be involved and how, and the time frame within which the ‘minimum service levels’ should be achievable; (c) ensuring that the ‘minimum service levels’ are universal and not country specific; (d) using the methodology revision process to establish consistency across all sectors; and (e) providing guidance on how often the ‘minimum service level’ and/or baseline technology should be reviewed and, if necessary, updated.
13
Executive summary
Table ES1. Summary of options for enhancing the impact of the CDM and which actors would implement them Option
EB
COP
DNAs
Others
Sustainable development
Provision of menu of sustainable development indicators
✖
Revision of PDD format with regard to guidelines on reporting sustainable development contributions
✖
Improved voluntary reporting of benefits
✖
Mandatory monitoring and reporting of benefits Safeguards against negative impacts
✖
✖
✖ ✖
✖
✖
✖
Consequences for inadequate performance
✖
Preferences for project types
✖
Capacity-building for DNAs
✖
Enhanced stakeholder consultation and appeals
✖
✖
Inclusion of Africa in ‘LDC track’
✖
✖
Focused DNA support
✖
Grants and/or loans for transaction costs
✖
Standardization of parameters and baselines
✖
✖ ✖
✖
Regional distribution
Capacity-building for local financial sector
✖
Standardization of procedures
✖ ✖ ✖
Technology transfer
Improved database and data availability
✖
Improved reporting in PDDs
✖
Guidance to project owners on DNA preferences
✖
Net emissions impact
Discounting
✖
Shorter crediting periods
✖
Negative listing
✖
Large-scale power generation
Improvement of current additionality approach
✖
Alternative additionality approaches
✖
✖
Shifting technologies to sectoral approaches
✖
Restriction of eligibility by geography, scale and subtype
✖
Exclusion of entire categories or types
✖
✖
Suppressed demand
Procedures, minimum service levels, technology choice and updates
✖
Note: �Others include the Nairobi Framework partners outside of the UNFCCC, such as the United Nations Environment Programme, the World Bank and the African Development Bank.
14
Assessing the impact of the clean development mechanism
Acknowledgements This report has benefited from the input, support and insightful comments of many individuals. Firstly we would like to thank Pedro Barata for his support and guidance. We also acknowledge the extensive support and access to data provided by Grant Kirkman as well as Niclas Svenningsen and Kishor Rajhansa at the UNFCCC. The research team is grateful for the sources, insights and contacts provided by the following people: Axel Michaelowa, Matthias Krey, Nicolas Muller, Marc Andre Marr, Christoph Sutter, Renat Heuberger, Ingo Phul, Guido Traub-Schmidt, Bill Farmer, Morten Pedersen, Steve Thorne, Gareth Phillips, Jane Ellis, Christoph Arens, Wolfgang Sterk, Martin Burian, Lena Ruthner, Andrei Marcu, Noriko Fujiwara, Anja Kollmuss, Karen Olsen, Jørgen Fennhan, Glenn Hodes, Søren Lütken, Jørund Buen, Alexander Ochs, Xing Fu-Bertaux, Roberto Schaeffer, Michael Grubb, James Wilde, Niklas Hohne, Tobias Schmidt, Andrew Gilder, Irving Mintzer, Amber
Leonard, Juan Pablo Castro, Jemler Hoogzaad, Hans Jurgen Stehr, Jean-Jacques Becker, Harald Dovland, Georg Borsting, Bengt Bostrum, Richard Bradley, Sushma Gera, Raul Estrada Oyuela, Lambert Schneider, Jürg Füsller, Christiaan Vrolijk, Michael Gillenwater, Mischa Classens, Ajay Mathur, Chintan Shah, Weiquan Wang, Jose Miquez, Bill O’Connor, Anne Arquit Niederberger, Rana Adib, Peter Zhou, Rajesh Sethi, Steven Schiller, Swan Fauveaud, David Victor, Yongfu Huang, Alyssa Johl, Anton Cartwright, Alexandrina Platonova-Oquab, Carsten Warnecke, Coutney Blodgett, Daisuke Hayashi, Eva Filzmoser, Henk Sa, Laura Williamson, Lindiwe Chauke, Marius Keller, Martina Jung and Perumal Arumugam. Finally we would like to thank the members of the HighLevel Panel on the CDM Policy Dialogue and their advisors, who provided insightful research papers and helpful comments.
Acronyms
Acronyms AAU Assigned amount unit ACM Approved consolidated large-scale methodology AM Approved methodology (large scale) AMS Approved small-scale methodology BNEF Bloomberg New Energy Finance CDM Clean development mechanism CERs Certified emission reductions COP Conference of the Parties CME Coordinating and managing entity CMP Conference of the Parties serving as the meeting of the Parties to the Kyoto Protocol CPA Component project activity CPA-DD Component project activity design document DNA Designated national authority DOE Designated operational entity EB Executive Board of the clean development mechanism EE Energy efficiency ERU Emission reduction unit EUA European Union Allowance EU ETS European Union emissions trading scheme FDI Foreign direct investment GDP Gross domestic product GJ Gigajoule HCFCs Hydrochlorofluorocarbons HFC Hydrofluorocarbon IRR Internal rate of return kWh Kilowatt hour LDC Least developed country MAC Marginal abatement cost MW Megawatt MWe Megawatt equivalent N2O Nitrous oxide pCDM Programmatic clean development mechanism PDD Project design document PFC Perfluorocarbon PoA Programme of activities PV Photovoltaic SIDS Small island developing States tCO2 Tonnes of carbon dioxide tCO2e Tonnes of carbon dioxide equivalent UNFCCC United Nations Framework Convention on Climate Change The symbol $ means US dollars in all cases.
15
16
Assessing the impact of the clean development mechanism
List of figures Figure 1. MAC curves for 2020 for 10 Annex I countries ................................................................................................................ 22 Figure 2. Estimated mitigation costs by project type........................................................................................................................ 24 Figure 3. Estimated mitigation costs by year ($/tCO2e).................................................................................................................. 26 Figure 4. Composition of the study sample in terms of project types...................................................................................... 42 Figure 5. Composition of the study sample in terms of regions.................................................................................................. 43 Figure 6. Percentages of PDDs mentioning various sustainable development indicators ............................................ 46 Figure 7. Sustainable development benefits cited by project type............................................................................................. 46 Figure 8. Sustainable development benefits cited by region ....................................................................................................... 47 Figure 9. Approach to the assessment of claims of negative impacts of CDM projects................................................. 48 Figure 10. �Forecast of cumulative issuance of CERs for projects in the CDM pipeline, by project type (million CERs).................................................................................................................................................... 59 Figure 11. Imports and exports as a share of total primary energy supply for selected countries............................... 85 Figure 12. Share of projects in the CDM pipeline................................................................................................................................... 86 Figure 13. Share of expected CERs issued for projects in the CDM pipeline up to 2020................................................... 87 Figure 14. Electrical generation capacity of registered renewable energy CDM projects (MW)..................................... 87 Figure 15. R � ange of renewable energy costs from IPCC Special Report on Renewable Energy Sources and Climate Change Mitigation................................................................................... 89 Figure 16. �Annual ‘carbon returns on investment’ by project type – share of projects with specific carbon returns........................................................................................................................................................ 90 Figure 17. Dependence of the costs of renewable energy technology on regional/national variables...................... 91 Figure 18. CDM project capacity as a share of total installed market capacity for wind power, 2011...................... 91 Figure 19. Growth of wind power capacity in China and India, total market and registered CDM projects ............. 92 Figure 20. Newly registered CDM hydropower capacity by year for selected countries..................................................... 95 Figure 21. New CDM hydropower projects entering the validation pipeline by year for selected countries............. 96 Figure 22. Newly installed CDM biomass power capacity by year in selected countries (MW)...................................... 97 Figure 23. New CDM biomass projects entering the validation pipeline by year for selected countries.................... 97 Figure 24. Share of PoAs and normal CDM projects, by sector.................................................................................................... 100 Figure 25. �Capital cost per tonne of emissions reduced annually, by project type ($, average, maximum and minimum)............................................................................................................................... 111 Figure 26. �Capital cost per tonne of emissions reduced annually, by project type ($, average, maximum and minimum) (continued)...................................................................................................... 112 Figure 27. Investment in CDM projects, by year................................................................................................................................... 113 Figure 28. Investment in registered and soon-to-be registered CDM projects, by subregion....................................... 113 Figure 29. Average capacity (MWe) per project by project type for CDM and non-CDM projects............................... 115 Figure 30. Capital intensity (capital cost in $/MWe) by project type for CDM and non-CDM projects...................... 116 Figure 31. Average asset value per project for CDM and Annex I renewable energy projects..................................... 116 Figure 32. Share of domestically financed renewable energy projects by project type.................................................. 117 Figure 33. Trend in the share of domestically financed renewable energy projects.......................................................... 118 Figure 34. Prices of EUAs, secondary CERs and primary CERs, 2008–2011......................................................................... 121 Figure 35. Average time from period of public comment on validation to registration of CDM projects............... 122 Figure 36. Review and rejection history of CDM projects, by year.............................................................................................. 123 Figure 37. Unit transaction costs for World Bank CDM projects................................................................................................... 125 Figure 38. Distribution of registered CDM projects by country..................................................................................................... 128 Figure 39. Issued CERs as a share of national CO2 emissions .................................................................................................... 129 Figure 40. Share of PoAs and share of traditional CDM projects, by region.......................................................................... 130 Figure 41. Share of CERs from registered projects versus share of non-Annex I CO2 emissions................................ 131 Figure 42. �Relative service levels for different baseline assumptions about suppressed demand effects and minimum service level ..................................................................................................................................................... 139
List of tables
17
Figure 43. �Baseline and project service levels under different assumptions of suppressed demand effects and minimum service level ..................................................................................................................................................... 139 Figure 44. �Baseline and project energy consumption under different scenarios (historical versus project technology)................................................................................................................................. 140 Figure 45. Project mitigation costs for fixed (10-year) crediting period................................................................................... 172 Figure 46. Project mitigation costs for renewable (up to 21-year) crediting period.......................................................... 172
List of tables Table 1. Estimated savings as a result of the use of CERs for compliance by EU ETS installations........................ 23 Table 2. Sustainable development criteria most frequently used by DNAs......................................................................... 33 Table 3. �Summary of methodologies employed to assess the sustainability impacts of CDM projects and conclusions from reviewed studies................................................................................................................................ 36 Table 4. Criteria to assess the sustainable development impacts of CDM projects........................................................ 45 Table 5. Case studies of potential negative impacts of CDM projects................................................................................... 49 Table 6. Summary of options for enhancing sustainable development impacts............................................................... 51 Table 7. Potential outcomes of the CDM and their implication for its net emissions impact .................................... 56 Table 8. Project registration and CER issuance as of June 1, 2012......................................................................................... 57 Table 9. Use of CERs by EU ETS and government buyers, 2008–2011 (million CERs)................................................... 57 Table 10. �Forecast cumulative issuance of CERs from projects in the CDM pipeline (million CERs) (after accounting for validation and issuance risks)....................................................................................................... 58 Table 11. �Share of registered CDM projects using investment and barrier analyses to demonstrate additionality...................................................................................................................................................... 61 Table 12. IRRs with and without carbon revenue, by project type................................................................................................ 63 Table 13. Summary of systemic concerns regarding the CDM’s additionality tool ............................................................. 65 Table 14. Summary of additionality-related concerns in relation to the major CDM project types ........................... 66 Table 15. Practices or outcomes that can lead to overcrediting under the CDM.................................................................. 72 Table 16. Practices or outcomes that can lead to undercrediting under the CDM............................................................... 73 Table 17. Summary of potential for over- and undercrediting for major CDM project types......................................... 75 Table 18. Net increase (+) or decrease (-) in global emissions, cumulative up to 2020 (MtCO2e).............................. 77 Table 19. Options for improving the net mitigation impact of the CDM................................................................................... 79 Table 20. �Capacity of wind, hydropower and biomass CDM projects in the CDM registration pipeline – top 10 countries....................................................................................................... 88 Table 21. National incentives to encourage renewable energy in major CDM host countries....................................... 93 Table 22. �Hydropower: total market size and registered CDM projects in selected CDM host countries (MW), 2011...................................................................................................................... 95 Table 23. �Biomass power: total market size and registered CDM projects in selected CDM host countries (MW), 2011...................................................................................................................... 97 Table 24. Fossil fuel related CDM projects: number, CERs issued up to 2020 and MW capacity................................ 99 Table 25. Coal and natural gas projects by methodology and country..................................................................................... 99 Table 26. Results of the level I analysis, based on five typologies........................................................................................... 107 Table 27. �Number of projects by project type and category for which the BNEF database has asset values............................................................................................................ 114 Table 28. Project finance by type of project for CDM renewable energy projects............................................................. 120 Table 29. Summary of the major barriers to investment in CDM projects............................................................................ 120 Table 30. Numbers of registered CDM projects of different countries, by region.............................................................. 128 Table 30. Numbers of registered CDM projects of different countries, by region.............................................................. 129 Table 32. �Summary of options for enhancing the impact of the CDM and which actors would implement them........................................................................................................................ 152
1 Introduction
1 Introduction
When adopting the Kyoto Protocol in 1997, Parties to the United Nations Framework Convention on Climate Change (UNFCCC) established the clean development mechanism (CDM) with the twin goals of contributing to the sustainable development of developing countries and assisting developed countries to meet their emission limitation targets. Over the last 14 years public and private entities have engaged in the rapid development and implementation of this mechanism, which is expected to result by 2012 in over 1 billion tonnes of carbon dioxide equivalent (tCO2e) emission reductions from project activities and programmes in over 70 countries. International cooperation to address climate change now stands at a crossroads as we approach the conclusion of the Kyoto Protocol’s first commitment period in 2012. Parties have thus intensified their efforts to expand existing agreements and develop new ones in a manner that reflects their respective needs and capacities. The CDM Policy Dialogue was established by the CDM Executive Board (EB) in late 2011, with the objective of providing recommendations on how best to position the CDM to respond to future challenges and opportunities so as to ensure the effectiveness of the mechanism in contributing to future global climate action. The CDM Policy Dialogue is implemented by a High-Level Panel, which is composed of distinguished individuals who possess a broad range of experience and expertise in fields of relevance to the operation and aims of the CDM. This High-Level Panel conducts and oversees the CDM Policy Dialogue and will deliver, as its main output, an independent report setting out the Panel’s recommendations for the future position of the CDM, its priorities and modes of operation. The High-Level Panel is implementing the CDM Policy Dialogue through targeted research and different types of stakeholder meetings, so as to independently form a basis for drawing conclusions and making recommendations about different aspects of the mechanism. This research report on the impact of the CDM is one of three reports commissioned by the High-Level Panel, the other two covering the governance of the CDM and the future context of the CDM. The objective of this report is to provide an independent assessment of the impact of the CDM across a broad range of metrics and possible effects. The impact of the CDM is assessed firstly in relation to its original purposes stated in Article 12 of the Kyoto Protocol, namely “to assist Parties not included in Annex I in achieving sustainable development and in contributing to the ultimate objective of the Convention, and to assist Parties included in Annex I in achieving compliance with their quantified emission limitation and reduction commitments”. Beyond sustainable development and cost-effective emission reductions, there are other potential impacts of the CDM
19
that have been highlighted by stakeholders in their submissions to the CDM Policy Dialogue and in the literature on the CDM. These include potential impacts on technology transfer, investment in low-carbon development, net global greenhouse gas (GHG) emissions, energy security, clean energy investment and accounting for suppressed demand. The term “impact” in this report is interpreted quite broadly and is, for the most part, assessed separately from the question of additionality (i.e. the extent to which the value of expected CDM revenues caused CDM projects to take place). Nonetheless, it is important to recognize that these aspects are fundamentally inseparable. The CDM as a mechanism has an impact on sustainable development, technology transfer, energy security or other outcomes only to the extent that CDM projects are additional. To the extent that CDM projects are not additional, any associated sustainability or energy security benefits, for example, would have also occurred in the absence of the CDM and therefore the ‘impact of the CDM’ is zero. As a consequence, views on additionality are critical not only in terms of the net emissions impact, as assessed in chapter 4, but also in terms of the impacts discussed in other chapters, particularly the impact on energy markets, which is covered in chapter 5. Except where explicitly noted, discussions on impacts in other chapters implicitly assume full additionality. In addition, the regional distribution of CDM projects is a key issue highlighted by all stakeholders and is addressed in this analysis. Where possible, the impacts of the CDM have been evaluated quantitatively, although this is not always possible if there are no data available (e.g. no verified sustainable development impact data). The quantitative analysis and review of the literature have been supplemented by inputs from a wide range of experts and stakeholders, both as part of the CDM Policy Dialogue stakeholder engagement process and through interviews by the research team. The report is structured to include a chapter for each of the areas of impact evaluated: sustainable development, cost-effective emission reductions, net global GHG emissions, energy security, clean energy investment, technology transfer, financing, regional distribution of CDM projects and accounting for suppressed demand. The concluding chapter then summarizes the findings and recommendations resulting from the study. The sections of this report in which the questions posed in the terms of reference for this study are addressed are shown in annex A.1
1 �This report does not contain an introductory explanation of the CDM project cycle and rules, but this can be found in the report commissioned by the CDM Policy Dialogue on the governance of the CDM (Classens, 2012).
2 �Impact on Annex I Party ambition levels through cost-effective emission reductions
2 Impact on Annex I Party ambition levels through cost-effective emission reductions
As discussed in the introduction to this report, one of the two main purposes of the CDM was to assist Annex I Parties in achieving compliance with their emission reduction targets. This purpose was to be achieved by providing them with lower-cost opportunities for emission reductions to supplement their domestic actions. This chapter addresses the questions of how cost-effective the CDM has been and
21
to what extent it has reduced the marginal costs of emission reductions for Annex I countries. In addition, the last section of the chapter addresses the question of whether the availability of the CDM as part of the Kyoto Protocol increased the ambition of the commitments made by Annex I Parties at Kyoto in 1997.
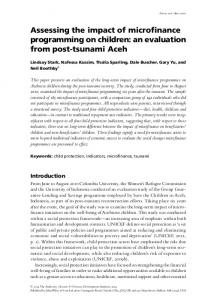
2.1 �Impact on minimizing the marginal costs of emission reductions achieved by Annex I countries Annex I Parties to the Kyoto Protocol have national emission limitation commitments for the period 2008–2012. Each country’s commitment is expressed as a cumulative total for the period relative to five times its base year (usually 1990) emission level. To meet its commitment, a country can implement policies and measures to reduce domestic emissions and/or purchase compliance units – assigned amount units (AAUs), emission reduction units (ERUs) and certified emission reductions (CERs) – from other countries. A marginal abatement cost (MAC) curve is a tool that can be used by a country to help identify the lowest-cost options for meeting its national commitment. A MAC curve displays possible emission reduction measures in order of increasing marginal cost ($/tCO2e reduced), starting with the most cost-effective measure. For each option, the curve shows the cost per metric tCO2e reduced on the vertical axis and the potential emission reduction, in tCO2e per year, on the horizontal axis. Each step on a curve represents an emission reduction option.2 Figure 1 shows MAC curves for 2020 for 10 Annex I countries. Countries whose curves lie closer to the vertical axis, such as Japan, Norway and Switzerland, have more limited emission reduction potential, so meeting a given percentage emission reduction from the 1990 level would be more costly. The emission reduction commitments of Annex I countries, expressed as a percentage of their 1990
2 �The horizontal steps implicitly assume that all installations of each option have the same marginal cost. In reality the cost is likely to differ, so each horizontal line should be replaced by an upward sloping curve of the marginal costs of different installations. Then part of the potential reduction for an option may be more costly than some installations of the next most expensive option.
emission level, differ, so each country’s compliance cost depends both on its MAC curve and its commitment.3 In principle, each Annex I country could minimize the cost of meeting its emission reduction commitment domestically by starting with the lowest-cost option and implementing all of the emission reduction options needed to achieve sufficient reductions to meet its national commitment. The total compliance cost would be the area under the curve and the marginal cost would be the cost per tCO2e reduced of the last option included. If the price of compliance units, such as CERs, is lower than the marginal cost of the last option, the total compliance cost can be reduced by purchasing such units and implementing fewer domestic reduction options. Any options which have a higher marginal cost than the price of compliance units are not implemented and units equal to the reductions expected to be achieved by those options are purchased. In practice, the marginal abatement cost curve changes because the projected baseline emissions change (due to macroeconomic conditions, for example), the projected fuel prices change and the cost or performance of various options change (Wagner et al., 2012; Kesicki & Ekins, 2011).4 Also, the policies implemented by a country may not cover all of the lower-cost options or may not achieve the full potential emission reduction for each option, so the policies needed to meet a national commitment are more costly than suggested by the MAC curve (Grubb et al., 2011; Kesicki & Ekins, 2011). In Europe, some of the policies are 3 �The commitments of Japan, Norway and Switzerland are 94%, 101% and 92%, respectively, of their 1990 emission levels. 4 �Thus the precision suggested by the curve is misleading. But options can be grouped into cost ranges. And the groups of options that need to be implemented to achieve the emission reduction target can be identified.
22
Assessing the impact of the clean development mechanism
Figure 1. MAC curves for 2020 for 10 Annex I countries 50
Marginal abatement cost Euro/tCO2eq
40
30
20
10
0 0%
-5%
-10%
-15%
-20%
-25%
-30%
-10
-20
Emissions relative to baseline AU
CA
JP
NZ
NO
RU
CH
UA
US
EU
Source: Wagner et al. (2012), figure 8.
strictly domestic, while others are adopted by the European Union (EU), so it is less likely that the policies applied in each country will fully capture the low-cost options. The CDM can help Annex I countries to reduce compliance costs in two ways. Firstly, the government can choose to purchase CERs (and other compliance units) instead of implementing policies to achieve more costly domestic reductions. Secondly, where permitted by the national government, entities subject to a domestic policy can use CERs (and other compliance units) to comply with that policy. The government then uses those CERs to offset the higher domestic emissions. For example, installations in the European Union emissions trading scheme (EU ETS) and Japanese firms with voluntary commitments can use CERs for compliance. Use of CERs by installations in the EU ETS for compliance has been the dominant use of CERs to date, accounting for almost half of the CERs issued up to March 31, 2012.
The cost savings already realized by installations in the EU ETS are estimated first. These are then extrapolated to cover CER use by Japanese firms. Finally, a crude estimate of the cost savings achieved by Annex I Parties thanks to the use of CERs by both firms and governments for the 2008– 2012 commitment period is developed. Each year, installations in the EU ETS must submit valid compliance units – European Union Allowances (EUAs), CERs or ERUs – equal to their actual emission level in the previous year. EUAs equal to the annual emissions cap are distributed each year, mostly through free allocation to participating installations. EUAs, like CERs, can be freely traded. CERs have a lower market price than EUAs but both are equivalent for compliance, so using CERs reduces compliance costs. Using CERs also reduces demand for EUAs and so may also lower their market price. Thus, a lower bound estimate of the compliance cost saving to EU ETS installations resulting from the use of CERs
2 Impact on Annex I Party ambition levels through cost-effective emission reductions
23
Table 1. Estimated savings as a result of the use of CERs for compliance by EU ETS installations1 Year
CERs used (million)
EUA–CER spread (€)*
Saving (€ million)
2008
82.5
1.90
156.8
2009
77.9
1.34
104.4
2010
116.9
3.19
372.9
2011
178.8
3.07
548.9
Total
456.1
1,183.0
Source: Authors’ calculations. Note: *Price spread on April 30 of the subsequent year.
1 �Trotignon (2011) estimates the savings for 2008 and 2009 at €283 million (range €100 to €546 million) compared with the estimate of €261 million in this report. Trotignon uses the average of the daily spreads and the minimum and maximum daily spreads for the range. He also has a greater use of CERs for compliance – 170.4 million for the two years compared with 160.4 million in this report.
can be calculated from the difference in the market prices of CERs and EUAs and the quantity of CERs used for compliance. The quantity of CERs used for compliance each year is known. The EUA–CER spread changes daily and has varied widely over time from less than €1 to over €5.5 The estimated cost savings, then, depend on the price spread used for the calculation. The relevant price spread is the one on the day that installations must decide which EUAs and CERs to submit for compliance, namely April 30 of the subsequent year. Since both EUAs and CERs can be banked for use in future years, the spread at the time the compliance decision is made best reflects the value of the savings to the installation. The estimated compliance cost saving to EU ETS installations for the period 2008–2011 as a result of the use of CERs is calculated in table 1. The total saving over the four years is almost €1.2 billion ($1.5 billion). Both the number of CERs used for compliance and the EUA–CER price spread have generally increased over time. Greater use of CERs for compliance has been made possible by the growth in the number of CERs issued. For 2008 and 2009, use of CERs for compliance represented about 75% of the CERs issued prior to the compliance deadline. By 2011 cumulative use had fallen to about half of the CERs issued. In 2010 the EU announced that installations will no longer be able to use CERs from HFC and N2O projects after 2012, so there is an incentive to use CERs from such projects during 2010, 2011 and 2012. This accounts for some of the growth in the use of CERs for compliance during 2010 and 2011.
The increased EUA–CER spread has been driven by reduced emissions and the cap on the use of CERs for compliance by EU ETS installations. The recession during 2009 and 2010 led to a reduction in EU ETS installations’ emissions, thus reducing the demand for EUAs, CERs and other compliance units (ERUs).6 Growth in the issuance of CERs (and ERUs) has increased the supply of compliance units. As a result, prices have fallen. The price of EUAs fell from €24.11 on April 30, 2008 to €6.94 on April 30, 2012.7 The price of CERs has fallen more – the EUA–CER spread has increased – because use of CERs and ERUs for compliance is capped and the EU has announced that this cap will apply up to 2020.8 Thus the demand for CERs for use for compliance by EU ETS installations is fixed, while the supply is increasing. The availability of CERs should also lower the market price of EUAs. The price of EUAs fell by over €17 between April 30, 2008 and April 30, 2012. During that period, over 5 billion EUAs were used for compliance by EU ETS installations. An estimate of the savings resulting from the impact of CERs on the price of EUAs would require significant modelling work. As an illustrative calculation, if even €1 of the price decline has been due to the availability of CERs, then the CDM would have reduced compliance costs by a further €5 billion ($6.5 billion). Thus, the cost savings resulting from the impact of CERs on the price of EUAs could be
6 �ERUs are emission reduction units issued for emission reductions in developed countries. They can be used for compliance by EU ETS installations. 7 �April 30 prices for 2008 to 2012 are as follows: €24.11, €12.92, €14.25, €16.27 and €6.94.
5 �The price spread on a given day reflects expectations about the future supply of and demand for EUAs and CERs. Profits or losses due to sales of EUAs and CERs are due to trading activity and are not related to compliance.
8 �The cap, about 1,450 million, covers the use of both CERs and ERUs, but the supply of CERs is much larger than the supply of ERUs – 919 million CERs and 143 million ERUs as of April 30, 2012.
24
Assessing the impact of the clean development mechanism
much larger than the savings resulting from the use of CERs for compliance. The use of CERs by Japanese firms to meet their voluntary commitments is estimated at 36 million CERs to date. There is no market price that can be used to estimate a price spread and hence cost savings resulting from the use of CERs for compliance by Japanese firms. Assuming that the cost saving is the same as for installations in the EU ETS, this yields an estimated compliance cost saving of €92 million ($120 million).9 For the 2008–2012 commitment period, there will be cost savings to Annex I Parties thanks to the use of CERs by both firms and governments. Installations in the EU ETS will probably use as many CERs for compliance in 2012 as for compliance in 2011, because CERs from HFC and N2O projects will no longer be accepted after 2012. The EUA–CER price spread may also widen, since the quantity of CERs issued is rising while the use of CERs for compliance through to 2020 is capped.10 Thus, the assumption that the compliance cost savings for 2012 are the same as those for 2011, at €548.9 million, is probably conservative. That would bring the total saving to €1.7 billion ($2.2 billion). Assuming that the savings to Japanese firms are equal to the annual average for 2008–2011 would bring the total savings for the commitment period to about €115 million ($150 million). Government use of CERs, ERUs and purchased AAUs to help achieve compliance with their 2008–2102 emission
limitation commitments by Japan and several European countries is projected at 500 to 600 million units (Kossoy & Guigon, 2012, table 5).11 Most of this demand is likely to be met by CERs. To calculate the cost savings would require information on the costs of the domestic policies each country would have implemented in lieu of their CER purchases as well as information on the cost of the CERs purchased. EU member States are expected to account for most of the government use of CERs to meet their 2008–2012 national commitments. Use of purchased CERs allows these countries to avoid implementing more costly domestic mitigation options. It is likely that the cost of the avoided options would exceed the price of EUAs, which reflects the cost of the domestic options being implemented. Thus, the EUA– CER spread, at €2.56 per CER, is probably a conservative estimate of the cost saving resulting from government use of purchased CERs. Assuming that Annex I governments use about 400 million CERs for compliance, the estimated savings are about €1 billion ($1.3 billion).12 In summary, the CDM has reduced compliance costs for firms in the EU ETS and Japan by at least $3.6 billion for the period from 2008 to 2011. The savings could be much larger, depending on the impact of CER use on the price of EUAs. For the 2008–2012 commitment period, the compliance cost savings for these firms are estimated to be at least $2.3 billion. Annex I government use of CERs to meet their national emission limitation commitments will yield an additional $1.3 billion in savings.
2.2 �Mitigation cost-effectiveness by project type 91011
Most12project design documents (PDDs) that include an investment analysis provide sufficient information to calculate the projected cost per tCO2e emissions reduced. The estimated mitigation costs differ substantially by project type. Estimated costs by project type for 2,336 registered and soon-to-be registered projects as of June 2012 are 9 �The saving to EU ETS installations is €2.56 per CER (€1,166.9 million/456.1 million CERs from table 1), so the saving for 36 million CERs is €92 million. 10 �A proposed temporary reduction of the quantity of EUAs issued or the setting of a minimum price for EUAs would also tend to increase the EUA–CER price spread. 11 �Actual use of CERs will not be known until compliance with national emission limitation commitments for 2008–2012 is assessed, probably in 2014. 12 �CERs are expected to account for most of the 500 to 600 million units projected to be purchased and used for compliance by Annex I Parties.
shown in figure 2. The project mitigation cost is the present value of all capital and operating costs over the life of the project less the present value of any revenue from sources other than the sale of CERs (e.g. for electricity generated), divided by the anticipated emission reductions over the life of the project. Thus, the project mitigation cost is measured in cost per tCO2e reduced.13 The bar represents one standard deviation above and below the average cost, while the line illustrates the minimum and maximum values.14 13 �This metric is expressed in the same way as the capital investment by project type in figure 26, but the two are calculated and interpreted very differently. The project mitigation cost includes all operating costs and all revenue other than the sale of CERs over the life of the project, while the capital investment by project type does not. 14 �Where a line goes to the axis, the value has been truncated.
2 Impact on Annex I Party ambition levels through cost-effective emission reductions
25
Based averagemitigation +/- one standard most project types have an estimated mitigation cost below $10/ Figureon2.the Estimated costs by deviation, project type ($/tCO2e) 800
100 90 80 70 60 50 40 30 20 10 -10 -20 -30 -40 -50
700 600 500 400 300 200 100
or t s id EE in e du st ry
EE
su
pp
ly
ar
sp an
So l
Tr
Tid al W in d
-100
Co
al
Bi
om
as
s e AR ne rg y be d/ C em m i EE ne m ent ow et h n ge ane ne ra tio En n er EE s gy er vic di st Fo rib e ss ut il io fu n el sw itc Fu h g Ge itiv e ot he rm al Hy d L M ro an et dfi ha ll ne ga av s oi da nc e PF N Cs 2 an O d SF 6
0
Source: Authors’ calculations based on the estimated data provided in PDDs for 2,336 registered or soon-to-be registered projects as of June 2012. Note:
AR = afforestation/reforestation; EE = energy efficiency.
tCO2e and have a negative cost component. As indicated in figure 2, solar,15 transport, energy efficiency (EE) industry and EE supply-side projects have much higher mitigation costs. The project mitigation costs are sensitive to the discount rate used. The estimates shown use the discount rate proposed in the PDD.16 The project mitigation costs are also sensitive to the project crediting period. The estimates shown assume the crediting period is the project life or the maximum crediting period including renewals, whichever is shorter. Most project participants choose a renewable crediting period. Project mitigation costs tend to be much lower with renewable crediting periods ($2.42/tCO2e) when compared with fixed crediting periods ($23.80/tCO2e).17 The calculations do not include transaction costs, such as fees to designated operational entities (DOEs) for validation and verification, host-country levies or designated national authority (DNA) charges, the administrative cost levy of the EB, the share of proceeds for the Adaptation Fund and costs associated with the sale of CERs.
15 �The mitigation cost for solar projects is the average for several subtypes. Solar photovoltaic and solar thermal projects have a mitigation cost of $306/tCO2e and $325/tCO2e, but solar cooking and water heating have much lower costs at $3/tCO2e and $4/tCO2e. 16 �The mitigation cost was also calculated using the default values for expected return on equity as listed in the “Guidelines on the assessment of investment analysis” (report on the sixty-second meeting of the EB, annex 5), but no significant differences were detected. 17 �See annex D for mitigation costs for different crediting periods.
A mitigation cost below $10/tCO2e is probably necessary for a project to be viable. The total cost, after including the transaction costs, needs to be lower than the price of CERs, which has been between $13 and $20 for most of the 2008–2011 period.18 The mitigation cost is a measure of a project’s net costs, so a negative cost means the project is profitable without revenue from the sale of CERs. It is tempting, but incorrect, to interpret a negative project mitigation cost as indicating that a project is not additional. Firstly, a CDM project can be profitable without CER revenue, but it is still additional if the baseline scenario is more profitable. Although the number and types of projects for which this is the case has not been analysed, numerous PDDs claim that the project scenario would not be chosen despite its profitability because a more lucrative option is available. Secondly, a CDM project can be profitable but still be additional if lack of access to capital or other barriers exist to restrict the implementation of the project. Many PDDs include detailed investment data but document the existence of such barriers. Thirdly, the transaction costs mentioned above are not included in the calculation.
18 �Although the price of CERs was in the €20 range in mid-2008, it was between €10 and €15 before falling below €10 during the last half of 2011.
26
Assessing the impact of the clean development mechanism
Figure 3. Estimated mitigation costs by year ($/tCO2e) Fixed Crediting Period 45 40 35 30 25 20 15 10 5 0 -5 -10
Renewable Crediting Period 4 3 2 1
2002 2003 2004 2005 2006 2007 2008 2009 2010
0 2003
2004
2005
2006
2007
2008
2009
2010 2011
Source: Authors’ analysis.
In addition, it is likely that the mitigation costs are somewhat understated. The average emission reduction performance of CDM projects is below the level anticipated in the PDD, thus the true mitigation cost is somewhat higher.19 Finally, the calculations assume that crediting periods will be renewed with the same baseline and projected emission reductions. If that does not happen, the mitigation costs will be higher than these estimates. The project mitigation costs are not directly comparable to the costs of similar emission reduction options in MAC curves. A MAC curve applies to a country, reflects a specific baseline scenario (fuel prices, etc.) and technology performance (lifetime, etc.) and typically uses a social discount rate. The project mitigation cost estimates are based on projects in different countries that probably have different baselines, have a limited crediting period and use private discount rates.
19 �The June 2012 CDM Pipeline Overview reports that for 1,580 projects with CERs issued, the quantity issued is 93.4% of the emission reductions anticipated in the PDD.
Furthermore, although the project mitigation cost is a relatively accurate measure of the project’s costs over its lifetime, it may not represent the true abatement cost. If the baseline scenario includes costs, these should be subtracted from the project mitigation cost when calculating the marginal abatement cost. For example, most CDM renewable energy projects defer investment in fossil-fired generation, so the marginal abatement cost is the mitigation cost for the CDM project less the cost of the fossil-fired capacity avoided. Figure 3 shows the trend in project mitigation costs based on the same set of projects. It suggests that the average mitigation cost has been increasing. This may reflect a change in the mix of project types, namely relatively more N2O, PFC and SF6 projects with low mitigation costs during the early years of the CDM. It may also reflect a more stringent assessment of additionality over time, leading to fewer projects that are economically viable without the revenue from the sale of CERs being registered.
2 Impact on Annex I Party ambition levels through cost-effective emission reductions
27
2.3 �Impact on the ambition of commitments for the first commitment period of the Kyoto Protocol Another potential impact of the CDM could be that the availability of flexibility in meeting their emission reduction targets encouraged Annex I countries to take on more ambitious targets than they would have without the CDM. In other words, even though the CDM was intended as an offset mechanism, did the availability of low-cost mitigation opportunities lead to more ambitious targets being taken on by Annex I countries? Article 4, paragraph 2(a), of the Convention says that “Parties may implement such policies and measures jointly with other Parties and may assist other Parties in contributing to the achievement of the objective of the Convention”. This concept of ‘joint implementation’ (JI) preceded the current JI mechanism under the Kyoto Protocol (Oberthür, 1993). This concept and the literature on gains from emissions trading in the USA led several researchers prior to 1997 to analyse the potential gains from emissions trading under the Convention and how this could reduce the costs of meeting particular global targets (e.g. Maddison, 1995; Weyant & Hill, 1999; Hammitt & Adams, 1996). The research utilized estimated MAC curves (see section 2.1) for both Annex I countries and non-Annex I countries to assess the gains from trading. Many of the Parties to the Convention, however, strongly objected to any notion of emissions trading, particularly India, China and the EU (Grubb et al., 1999; Streck, 2004). The USA was the main force pushing for international emissions trading among Annex I countries throughout the negotiations leading up to the conference in Kyoto. After Sweden, the USA was also the most important player in the ‘activities implemented jointly’ pilot phase of testing of the concept of JI between Annex I and non-Annex I countries (Schwarze, 2000). Despite Sweden’s involvement, and to a lesser extent Germany, France, Netherlands and Belgium, the EU was not supportive of the idea of project-based emissions trading with non-Annex I countries, nor was it in favour of international emissions trading in the early Kyoto Protocol negotiations (Grubb et al., 1999). Southern countries, such as India and China, also raised strong concerns about shifting the responsibility for emission reductions to developing countries and the ‘cream-skimming’ of cheap mitigation opportunities in poor countries (Chatterjee & Spalding-Fecher, 1997; Jepma, 1995; Parikh, 1995; Maya et al., 1996).
The CDM as we know it today emerged in the final month or two of the negotiations of the Kyoto Protocol. In June 1997, Brazil had put forward a proposal for a ‘Clean Development Fund’ that would use penalties paid by Annex I countries for non-compliance with their commitments to fund mitigation projects (and possibly adaptation) in developing countries. The fund proposal included ways of allocating the funding among developing countries, which was the origin of the concerns over regional distribution that emerged shortly after the Kyoto conference (see this discussion in section 8.1). Only in the final pre-Kyoto negotiating sessions in September 1997 did this idea shift to a mechanism that could allow companies or countries to invest in developing countries in exchange for offsets against their emission reduction targets (Grubb et al., 1999; Estrada Oyuela, 2012; Depledge, 2000). Even for the USA, then, there was very little time to assess how the CDM might affect the cost of meeting different targets. For the EU and Japan, even emissions trading among Annex I countries was not being considered when formulating their proposed commitments. Interviews with negotiators from Annex I countries as part of this research process confirmed that the inclusion of the CDM in the Kyoto Protocol did not have a quantitative impact on the commitments Annex I countries made in the final hours of the negotiations. For the USA there was some value in having a mechanism that directly engaged developing countries in mitigation, because of pressure from the US Congress. For some other countries (e.g. the EU), even emissions trading had not been a priority, while for others (e.g. Norway) flexibility was important, but mainly among countries taking on commitments. Also, most Annex I countries were more concerned about the number of gases included in the commitments, the role of land use, land-use change and forestry and the differential commitments of Annex I countries than about offsetting in developing countries. The CDM did not, therefore, lead to more ambitious emission reduction commitments for Annex I countries, even though it was an important part of the overall package that was finally agreed in Kyoto.
3 �Impact on sustainable development
3 Impact on sustainable development
Contributing to sustainable development in host countries is the first objective of the CDM mentioned in Article 12 of the Kyoto Protocol and is given the same level of importance as assisting Annex I Parties to meet their emission reduction targets. This chapter addresses the research questions as to what extent the CDM has, in fact, contributed to sustainable development and how these contributions can be enhanced. After a brief overview of UNFCCC requirements and procedures, the chapter then provides an overview of the criteria currently used by DNAs to assess the sustainable development contributions of CDM projects. This is followed by an extensive review of the literature on
29
sustainable development and the CDM. We then present new analysis undertaken for this study on the reporting of sustainable development impacts in registered PDDs and the resulting trends in reported impacts by country/region and project type. This is followed by a discussion of negative impacts of CDM projects and how to evaluate the claims against some CDM projects of social and environmental harm caused by project implementation. Finally, we turn to a discussion of options for enhancing the sustainable development contribution of the CDM, including how to minimize negative impacts.
3.1 �Current UNFCCC requirements and procedures20 Since the adoption of the Kyoto Protocol, there have been five decisions by the Conference of the Parties serving as the meeting of the Parties to the Kyoto Protocol (CMP) that have provided consistent guidance on Article 12 as to how the sustainable development component of project activities is to be determined: 20 ▶▶ Decisions 17/CP.7,21 1/CMP.2, 2/CMP.3 and 2/CMP.4 each have recitals that affirm or reaffirm “that it is the host Party’s prerogative to confirm whether a clean development mechanism project activity assists it in achieving sustainable development”. ▶▶ Decision 3/CMP.1, annex, paragraph 40, relates to the procedures for the registration of a CDM project activity and provides that: “The designated operational entity shall: (a) Prior to the submission of the validation report to the Executive Board have received from the project participants written approval of voluntary participation from the designated national authority of each Party involved, including confirmation by the host Party that the project activity assists it in achieving sustainable development”. No further guidance has been provided as to how the DNAs should assess the sustainable development impact of CDM projects. The PDD, which is used to register CDM projects, simply requires the project proponent to include in the description “the view of the project participants of the 20 �This chapter is based on a more detailed assessment of technology transfer and the CDM commissioned by the CDM Policy Dialogue (TERI, 2012). 21 �The Conference of the Parties assumed the responsibilities of the CMP for this decision (see decision 17/CP.7).
contribution of the project activity to sustainable development (max. one page)”. It should be noted that the PDD for programmatic CDM projects (PoAs) does not even contain this requirement. Over the years this set-up has been criticized by different CDM stakeholder groups, in particular by local non-governmental organizations (NGOs), claiming the following shortcomings: ▶▶ The lack of definition of sustainable development makes the requirement for CDM projects to contribute to sustainable development in the host country meaningless. ▶▶ In several cases registered projects are not contributing to sustainable development and in some cases are even detrimental to sustainable development. ▶▶ Since sustainable development is not included in the monitoring requirements of the CDM, the real impact of CDM projects is not known or reported.22 ▶▶ Based on the above, there is a concern that, in some cases, the sustainable development impact of CDM projects is ignored. Notwithstanding the recognition that the CDM gives the host country DNA a clear and exclusive right to assess and
22 �The UNFCCC secretariat’s report entitled “Benefits of the Clean Development Mechanism 2011” (UNFCCC, 2011a) attempts to correlate claims of sustainable development benefits as stated in the PDDs with the responses received in a survey of project participants after project implementation, but finds that the reported impacts often differ significantly.
30
Assessing the impact of the clean development mechanism
confirm the contribution to sustainable development of a CDM project, the CDM EB is currently engaged in discussions on to what extent the Board may provide guidance on this matter. In order to support this discussion, the Board launched at its sixty-first meeting a call for public inputs on sustainable development co-benefits and negative impacts of CDM project activities. The responses to the call were presented in a synthesis report by the EB at its sixty-fifth meeting. The Board noted that the “assessment of the contribution of project activities to sustainable development is under the authority of DNAs” and requested the secretariat to “undertake an analysis of the potential implications of the proposed measures and of what issues are within the remit of the Board to address”. At the seventh session of the CMP (decision 8/CMP.7), Parties requested the Board to “continue its work and develop appropriate voluntary measures to highlight the co-benefits brought about by clean development mechanism project activities and programmes of activities, while maintaining the prerogative of Parties to define their sustainable development criteria”. At EB 67, the Board considered a concept note on highlighting sustainable development co-benefits on a voluntary basis (EB 67 proposed agenda, annotations to the proposed agenda, annex 13). This note outlined the objective of enhancing reporting on co-benefits, the principles and constraints, and several options for implementation. Constraints include that any measure must be voluntary for project participants and that it must not undermine the role of the DNA in determining whether the CDM project contributed to sustainable development. Following discussion
of this concept note, the Board requested the secretariat to develop a tool to include the following features: ▶▶ A checklist approach based on best practices and drawing on a wide selection of possible sources. ▶▶ Flexibility to include the voluntary tool in existing CDM documents and workflows. ▶▶ That a project participant or coordinating and managing entity (CME) may make an initial declaration using the voluntary tool. ▶▶ That a project participant or CME may choose to update, change or withdraw the initial declaration if circumstances change at any time prior to or after registration of the CDM project activity or PoA. In the concept note for EB 67, the secretariat noted that such a checklist could be used in several ways in the CDM project cycle, namely: ▶▶ As an initial declaration at the start of project development. ▶▶ As an initial declaration that is updated during project implementation. ▶▶ As an initial and updated declaration that is subject to validation and verification. ▶▶ All of the above, plus possible adverse consequences for projects failing to perform.
3 Impact on sustainable development
31
3.2 �An overview of sustainable development criteria set by DNAs 3.2.1 Introduction Under the Kyoto Protocol, host countries have the responsibility of deciding what contributes to sustainable development (Marrakesh Accords, 2001). Each host country has to set up a DNA, which has the prime responsibility of determining whether CDM projects from its country will support sustainable development. As DNAs decide on sustainable development criteria on the basis of their national development priorities, there is wide variation in the way and detail in which these criteria are defined. The following section attempts to map this diversity and provide a summary of the sustainable development criteria used by DNAs and the common approaches employed to provide the letter of approval (LoA) to project proponents. The present assessment is based on three main data sources: a compilation of questionnaire responses from DNAs, sustainability criteria as provided on DNA websites and relevant literature sources. The study was initiated with a sample of 51 countries. Of these, criteria for 20 countries could not be assessed owing to lack of information. Some DNAs do not have a website, others do not web-host their sustainable development criteria, while in some cases the information available on DNA websites was not accessible (e.g. language issues or website not working). Finland, being an Annex I country, was not included in the assessment. Hence, this confines the current assessment to an examination of the sustainable development criteria used by 30 countries.
3.2.2 �Criteria set by DNAs to assess the sustainable development benefits of CDM projects
and environmental dimensions. Technological benefits are usually either incorporated into the economic benefits or are a separate category. The degree of detail in which DNAs explain their sustainable development criteria differs. The approaches used by countries can be defined as per the following typology (see also table 2): ▶▶ General listing of criteria/indicators under the three/ four categories: 24 For example, India, Morocco, Brazil, Korea, Kenya, Armenia, Uzbekistan, UAE, Peru, Senegal, El Salvador, Nicaragua, Bolivia and Mali give a list of indicators under social, economic and environmental categories. ▶▶ Listing of criteria and a set of indicators under each category: For example, Vietnam, Malaysia, Indonesia, South Africa, Rwanda, Zimbabwe, Mauritius, Panama and Serbia describe the criteria under each category and give a list of indicators suggesting what the criteria incorporate. ▶▶ Listing of indicators under criteria, with scoring of each indicator: For example, Thailand, Bhutan and Georgia provide elaborate scoring for sustainable development indicators under a set of criteria under each category. Economic benefits: DNAs investigate project-specific, local and national benefits of CDM projects in order to assess the economic benefits. However, the major focus of DNAs while assessing the economic benefits of projects is on local and subnational (regional) benefits. The common project-specific criteria are the impact on cost-effectiveness of the project with respect to the baseline (Morocco and Georgia) and whether there is mutual consent between different stakeholders in the project (Indonesia and Korea).
Most of the surveyed DNAs23 mention that they have an operational definition of sustainable development in their country (six of the nine non-Annex I DNAs who responded to the survey). In Korea the operational definition is specified under the federal laws and in Mauritius under the national DNA regulations. Broadly, most countries define their sustainable development criteria under the social, economic
Most DNAs expect CDM projects to contribute towards strengthening the local economy of the region by generating additional income for the local communities, by creating employment opportunities and by bringing in additional investment (Madagascar, Thailand, Serbia, Bolivia, Burundi, Vietnam, Zimbabwe, Uzbekistan, Brazil, Bolivia and Nicaragua).
23 �A survey questionnaire was sent by the UNFCCC to all DNAs on April 29, 2012 with a deadline of May 25, 2012. Responses to the survey were received from 10 countries’ DNAs: Bhutan, Burundi, Republic of Korea, Zimbabwe, Mexico, Finland, Mali, Madagascar, Mauritius and South Africa.
24 �While these countries only provide a listing of criteria/indicators, some of these are quite elaborate.
32
Assessing the impact of the clean development mechanism
DNAs also assess the impact of the project activity on investment in the region and in the priority sectors of their country (Mauritius, Mexico, Thailand, Korea, India, South Africa, Armenia, El Salvador, Senegal, Bolivia and Serbia). Countries also give consideration to the impact of the project activity on the macroeconomic sustainability of the country through its impact on the balance of payments (Bhutan, Zimbabwe, Georgia, South Africa, Mauritius, Morocco, Rwanda, Serbia and Armenia). Environmental benefits: The majority of DNAs rely on the environmental laws and regulations and the standards set by national, provincial and local governments in deciding whether the project is contributing positively to the local environment. DNAs provide an elaborate list of indicators to check the impact of projects on the environment. The environmental benefits of CDM projects expected by DNAs relate to GHG emission reductions, the impact of the project on the environment and resources and the project’s contribution to the sustainability of resources. The impact of the project on the local environment and resources is the most frequently used criterion. Many DNAs emphasize the impact of the project on the environment. Most of them further elaborate the impacts on air, water, marine and land environment and biodiversity. Several DNAs give a special mention to the sustainability of resource use through efficient resource usage, the local community’s access to resources and the avoidance of resource degradation (Korea, India, Vietnam, Rwanda, Malaysia, Indonesia, Morocco, South Africa, Mauritius, Serbia, Georgia, Armenia, Uzbekistan and Thailand). Social benefits: The impact that a CDM project has on the improvement of the quality of life of the local community is the most frequently used criterion. However, DNAs usually specify indicators that would justify the improvement of the life of local communities by the project. These include: assisting in poverty alleviation through employment generation; ensuring no adverse effects on health; engaging in developmental activities to support society; enhancing access to public services; and promoting local industry. Among these, impact on human health and engaging in developmental activities appear most frequently. Developmental activities highlighted by DNAs include infrastructure creation, provision of healthcare, educational facilities and civic amenities. Most DNAs require effective community participation throughout the project cycle, ranging from consultations during project design and planning to providing local resources, services and labour during project implementation (Mauritius, Zimbabwe, Indonesia, Kenya, Thailand, Serbia, Georgia, Armenia, Bolivia, Peru, El Salvador and Rwanda).
The Peruvian DNA requires a written agreement between the project proponent and local communities to issue the LoA. DNAs also emphasize the ability of the project to generate technical skills and knowledge in the local community. In addition, many DNAs account for the alignment of the project to provincial and national government objectives, local development priorities and specific sectoral objectives.
3.2.3 Procedures for issuing the LoA The procedures for granting an LoA differ greatly from country to country and so does the institutional set-up of the DNAs. However, many DNAs have a requirement for the review of the project by technical and sectoral experts or relevant ministries. Almost all countries have representation from key ministries in the approval process. Their role is to review and evaluate the project and provide support to the DNA in its decision-making. In Kenya, for example, there is a National CDM Clearing House, with representation from the public and private sectors, institutions, civil society and academia. Most DNAs decide on the compliance of the project with the sustainable development priorities of the country keeping the designated sustainable development indicators as a reference. Usually the project is not expected to fulfil all the criteria/indicators but to describe the ones to which it will contribute. However, some countries do specify this information. For instance, the DNA of Thailand, which has developed a method of scoring for each indicator under a defined set of criteria for all three dimensions of sustainable development (social, economic and environmental), mentions that a project needs to have a positive total score for all indicators mentioned and for each sector. Some DNAs incorporate certain special checks to ensure that sustainable development requirements are fulfilled. For example, the South African, Brazilian and Malaysian DNAs expect the PDDs to be validated by a DOE before submission for host-country approval (although the validation does not include verifying the sustainable development benefits). The Rwandan DNA expects an updated sustainable development checklist demonstrating how the sustainable development criteria are being met once the project is operating each time a verification of the project is conducted. The online assessment also reveals that there are many countries which do not have a DNA website. Previous studies (Arens, Burian et al., 2011) mention that the absence of a DNA website can function as a barrier to investors and can be a sign that these DNAs do not actively promote the CDM within the host country. However, the lack of financial
3 Impact on sustainable development
33
Table 2. Sustainable development criteria most frequently used by DNAs To assess the economic benefits of CDM projects
1.
Additional investment generated
2.
Employment generation 2.1 Number of jobs created for the local community: within the project activity in the area 2.2 Quality of jobs created
3.
Income generation
4.
Contribution to sustainability of balance of payments by its: impact on foreign exchange requirements impact on foreign direct investment contribution to macroeconomic sustainability impact on imports and exports
5.
Clean energy development: generation from renewable sources of energy access to clean energy cost of energy reduction in energy dependence and energy intensity
6.
Contribution towards improvement of technologies Use of technologies that are: cleaner, more efficient and environmentally friendly locally appropriate best available, modern and proven (not obsolete or substandard)
To assess the environmental benefits of CDM projects
1.
GHG emission reduction
2.
Impact on environment
3.
Impact on air, water and land resources
4.
Impact on solid waste generation or disposal
5.
Impact on conservation/promotion of biodiversity (genetic, species and ecosystem) and ecosystems
6.
Contribution to resource sustainability: efficiency of resource usage access of local community to resources impact on resource degradation
To assess the social benefits of CDM projects
1.
Quality of life of local communities 1.1 Poverty reduction 1.2 Impact on human health: health of the community in the project area occupational health and safety measures 1.3 Inclusion of developmental activities to support the society 1.4 Accessibility of local public services 1.5 Promotion of local industries
2.
Effective public/community participation in project design, planning and implementation
3.
Capacity/skill/knowledge development
4.
Consistency with/contribution to national, provincial and local development and sectoral priorities
Source: Survey of DNAs.
34
Assessing the impact of the clean development mechanism
resources and capacity issues of such DNAs also need to be considered.
3.2.5 �Insights from stakeholder inputs
3.2.4 �Insights from literature on the sustainable development criteria of DNAs
The issues of sustainable development criteria and the role of DNAs have been raised in some of the stakeholder consultations conducted by the CDM Policy Dialogue.25 The key observations that emerged from stakeholder consultations conducted by the CDM Policy Dialogue are as follows:
There is a dearth of literature specifically targeting the sustainability criteria employed by DNAs. Olsen and Fenhann (2008), in their study on sustainable development benefits, conducted a review of the approval processes of the largest DNAs (India, China, Brazil, Morocco, Mexico, South Africa and Armenia) and concluded that most DNAs use a checklist approach for the establishment of sustainable development. Pointing to the weaknesses in the approval processes of these DNAs, the authors state that none of the countries require any monitoring of the sustainable development benefits to verify that the benefits are real and measurable. They criticize the current process of approval, stating that sustainable development is not included in the assessment of DOEs during verification and it is not a requirement at the international or national level that sustainable development benefits are actually realized. Boyd et al. (2009) raise questions as to whether the DNAs address the issue of accountability of project proponents in ensuring sustainable development benefits. Sterk et al. (2009) do a comparative analysis of conventional CDM projects with Gold Standard (GS) projects from six countries (i.e. India, Panama, Bolivia, El Salvador, Nicaragua and Brazil). The authors conclude that the procedures and criteria of Panama and Nicaragua are well developed with detailed stakeholder consultations and stress a safeguarding approach. India exemplifies both good and bad projects in terms of sustainable development benefits to communities. It was suggested that a stringent stakeholder consultation requirement by the DNA would improve this situation. Brazilian procedures are satisfactory but there is room for flexible interpretation. Bolivian indicators are “theoretically well-developed”, while El Salvadoran indicators lack specific parameters. Overall, the study concludes that there is a need for further clarity in relation to the sustainable development criteria of DNAs and more detailed stakeholder consultation procedures. Arens et al. (2011) studied the potential of the CDM in 11 selected least developed countries (LDCs) in sub-Saharan Africa: Burkina Faso, Democratic Republic of the Congo, Ethiopia, Malawi, Mali, Mozambique, Rwanda, Senegal, Tanzania, Uganda and Zambia. They found that only three of the 11 countries studied have a DNA website, which can be a barrier to investors and a sign that these DNAs do not actively promote the CDM within their host countries.
▶▶ The current system, in which countries set their own sustainable development definitions and criteria for project approval, should remain, to ensure that country-specific indicators are aligned with local socio-economic conditions and respect national sovereignty. The EB or secretariat could, however, assist in developing some voluntary guidelines for countries needing assistance, especially in quantifying sustainable development impacts. ▶▶ DNAs need to have a more continuous role in the CDM process, with additional powers within the CDM project cycle to ensure sustainable development. Many participants thought that the role of the DNA should be expanded to include monitoring the activities of projects after approval and implementation. ▶▶ There is a need to further strengthen the capacity of DNAs (especially in Africa). Some solutions were also suggested during various consultations (e.g. Tokyo Consultation, Africa Carbon Forum, Asia Consultation, Joint Coordination Workshop and meetings with negotiators during Bonn negotiation sessions). These are listed below: ▶▶ Providing DNAs with the power to withdraw the LoA. ▶▶ Embedding sustainable development criteria in the project verification stage. ▶▶ Enhancing the dialogue among DNAs to share ideas on best practices, sustainable development criteria and other key issues. ▶▶ The monitoring of sustainable development benefits by the host countries.
25 �The consultation reports that include discussions on sustainable development criteria and the role of DNAs include those of the Tokyo Consultation (May 10– 11, 2012), the Africa Carbon Forum (April 18–20, 2012) and consultations with African stakeholders (July 4, 2012), the Asia Consultation (June 7–8, 2012) ,the Joint Coordination Workshop (May 15–18, 2012), the meetings with negotiating blocks during Bonn negotiation sessions (May 2012) and the meeting with DNAs and NGOs during the DNA Forum (March 22–23, 2012).
3 Impact on sustainable development
▶▶ Improved communication between the secretariat and the DNAs. ▶▶ More stringent LoA issuance processes. The need for the monitoring of sustainable development benefits was raised in most consultations. Many stakeholders felt that DNAs should become more involved in the CDM process to ensure greater accountability. Some stakeholders suggested that if the DNA is not satisfied that a project is meeting its sustainable development goals, the DNA should be able to exercise its authority, based on its own monitoring systems, or request the EB to designate a DOE
35
to verify the sustainable development impacts. The DNA should then have the right to revoke the registration of the project on the basis of that evidence. However, while stakeholders mention that a monitoring system is important to measure the sustainable development benefits of a project, some stakeholders questioned the usefulness of such a system. They argued that while greater scrutiny of sustainable development is important, a more rigorous system might be counterproductive and have a negative impact on the market. Others feared that incorporating sustainable development criteria into the verification process would increase transaction costs, which are already one of the most important barriers to the CDM.
3.3 �Literature review on sustainable development benefits This section summarizes the review of scientific studies assessing the sustainable development performance of CDM projects. The last few years have seen a growing body of literature on the CDM and its contribution to sustainable development. Most of it is published by researchers and academics as peer-reviewed papers. In addition, the research papers and monographs from policy and think tank organizations are also significant. The studies acknowledged the difficulty of defining sustainable development, but generally accepted that sustainable development means the convergence of the three pillars of economic development, social equity and environmental protection. Each of these three dimensions of sustainable development has been further defined in terms of criteria and indicators by the researchers. According to Olsen and Fenhann (2008), “defining sustainable development once and for all is an impossible task”.
3.3.1 �Methodologies used in key studies In order to capture the multi-dimensionality of the concept of sustainable development, the majority of the studies on the subject assess the sustainability impacts of CDM projects using criteria and indicators (see table 3). However, the selection of specific criteria varies in different studies. Most of the studies have used the PDDs as the primary source of data/information. However, in order to validate the claims made in the PDDs, a few studies (UNFCCC, 2011a; Subbarao & Lloyd, 2011) have followed the textual analysis of PDDs with a survey of project owners or other relevant
stakeholders, and site visits for selected projects, as part of their methodology.26 Most of the research studies have divided the criteria used for the analysis under three broad headings – environmental impacts, social impacts and economic impacts. A few, however, have focused on just the environmental dimension of sustainable development, in terms of GHG emission reductions, on the grounds that the primary objective of the CDM is to combat global warming (Huang & Barker, in press). Some studies have included quality of stakeholder consultation/participation and stakeholder comments as one of the indicators to assess CDM projects (Nussbaumer, 2009; Alexeew et al., 2010; Castro & Michaelowa, 2008; Sutter 2003; Subbarao & Lloyd, 2011). A few studies have also assessed projects with respect to distribution of CER revenues (Sutter & Parreño 2007; Nussbaumer 2009). More uncommon criteria/indicators used by studies include sustainability tax and corporate social responsibility (Olsen & Fenhann, 2008), training (Watson & Fankhauser, 2009) and migration (Subbarao & Lloyd, 2011). One study focused on assessing the suitability of the GS for the CDM as a whole (Sterk et al., 2009) to enhance its sustainable development impacts, while another (Nussbaumer, 2009) attempted a comparison of GS-labelled projects with non-labelled projects of a similar type with respect to their impacts on socio-economic development and environmental conservation. 26 �Two studies have used software for the textual analysis of PDDs: Olsen and Fenhann (2008) conducted an evaluation of 296 PDDs using a software program called Nvivo7 and Lee and Lazarus (2011) employed Atlas.ti Version 6.2 software for the same purpose.
36
Assessing the impact of the clean development mechanism
Table 3. �Summary of methodologies employed to assess the sustainability impacts of CDM projects and conclusions from reviewed studies Title of the study; author(s) and year
Methodology
Case studies, sample number, countries, etc.
Conclusions
Sustainability checkup for CDM projects; Christoph Sutter, 2003
Multi-Attributive Assessment of CDM (MATA-CDM) of information received from stakeholder consultations/ surveys
Six case studies in South Africa, India and Uruguay
▶▶ Clear trade-off between the two objectives of the CDM
Does the current Clean Development Mechanism (CDM) deliver its sustainable development claim? An analysis of officially registered CDM projects; Christoph Sutter and Juan Carlos Parreño, 2007
MATA-CDM of information given in PDDs
16 projects registered as of August 30, 2005
▶▶ Trade-off between the two objectives of CDM
The promotion of sustainable development in China through the optimization of a tax/ subsidy plan among HFC and power generation CDM projects; Martin Resnier, Can Wang, Pengfei Du and Jining Chen, 2007
The data extracted from PDDs were subjected to the CDM Tax/Subsidy Optimization Model (CDMTSO Model)1
All registered projects up to August 2006
▶▶ Internal rate of return of sustainable CDM projects would be close to 10%
Empirical Analysis of Performance of CDM Projects, Climate Strategies; Paula Castro and Axel Michaelowa, 2008
Empirical analysis of PDDs of CDM projects (including registered, in the pipeline, rejected and withdrawn projects) followed by interviews with international experts and project developers and literature review
275 registered CDM projects, 18 projects in validation, 20 rejected projects and 4 withdrawn ones (as of June 2007, United Nations Environment Programme Risoe Centre). For the case study assessments, four projects from China, India and Brazil were selected
▶▶ The performance of CDM projects in terms of their contribution towards sustainable development does not have any evident impact on their success in terms of CER issuance, lead times, validation or registration success
▶▶ Project developers can deliver sustainable development benefits with projects that go beyond the minimal requirements given by the host country. This only works if there is a market for premium CERs with a higher price ▶▶ Contributions to sustainable development are not well reflected in CER prices
▶▶ Buyers do prefer good projects, with sustainability benefits, but they do not have a strong position since the demand for CERs is larger than the offer ▶▶ More detailed monitoring guidelines or measurable sustainability indicators may contribute to improving the sustainability performance of CDM projects
3 Impact on sustainable development
Title of the study; author(s) and year
Methodology
Case studies, sample number, countries, etc.
37
Conclusions
Sustainable development benefits of clean development mechanism projects: A new methodology for sustainability assessment based on text analysis of the project design documents submitted for validation; Karen Holm Olsen and Jørgen Fenhann, 2008
Text analysis of the Sampled 296 PDDs PDDs using software (out of 744 total as of program Nvivo7 May 2006) (QSR International, 2006), developed for qualitative text analysis
▶▶ The trade-off between the two objectives of the CDM exists in favour of cost-efficient emission reductions and, left to the market forces, the CDM does not significantly contribute to sustainable development
On the contribution of labelled Certified Emission Reductions to sustainable development: A multicriteria evaluation of CDM projects; Patrick Nussbaumer, 2008
Using information in PDDs, a MATA-CDM. GS and Community Development Carbon Fund (CDCF) CDM projects were compared with non- labelled projects of a similar type
39 registered CDM projects (as of April 1, 2008). All GS and CDCF CDM projects were selected
▶▶ The CDM’s role in assisting host countries in their effort to promote sustainable development is minimal
Further Development of the Project-Based Mechanisms in a Post-2012 Regime; Wolfgang Sterk et al., November 2009
Based on information given in PDDs, analysis of the GS to assess its robustness and its applicability to the CDM as a whole
Five registered GS projects (as of March 2009); 10 conventional CDM projects, two each from India and China and one each from Bolivia, Brazil, El Salvador, Nicaragua, Columbia and Panama
▶▶ Project types such as transport or sustainable waste management which have a high sustainable development rating should also be included in GS, besides renewable energy and end-use energy-efficiency projects
▶▶ Employment generation is the most likely impact of an average CDM project ▶▶ The distribution of sustainable development benefits among the three dimensions is fairly even, with most benefits in the social dimension, followed by the economic and the environmental dimensions
▶▶ Labelled (GS and CDCF) projects do not drastically outperform non-labelled ones in terms of sustainable development benefits
▶▶ The existence of host-country sustainable development criteria does motivate project developers to think about sustainable development aspects ▶▶ Most DNAs’ sustainable development criteria lack transparency and clarity ▶▶ Stakeholder consultation is often only rudimentary, completely unregulated and poorly documented
Reforming the CDM for sustainable development: lessons learned and policy futures; Emily Boyd et al., 2009
Evaluation of direct and indirect benefits on the basis of sustainable development criteria through PDD analysis
A random sample ▶▶ The CDM in its current form has negligible of 10 projects that sustainable development benefits capture specifically: ▶▶ Sustainable development benefits should be (a) the diversity of reflected in CER prices CDM project types, including biomass, waste heat recovery, hydroelectricity, fuel switch, land fill, construction and biogas and (b) regions. The case studies were from India, Brazil, South Africa, and China
38
Assessing the impact of the clean development mechanism
Title of the study; author(s) and year
Methodology
The Clean Development Textual/keyword Mechanism: too flexible analysis of information to produce sustainable given in PDDs development benefits?; Charlene Watson and Samuel Fankhauser, June 2009
Case studies, sample number, countries, etc.
The study samples 10% of the 4,064 projects (as of October 2008). All projects at all stages of validation except those rejected or withdrawn were considered
Conclusions
▶▶ Employment generation and training are the leading benefits of the CDM ▶▶ Indian projects contribute more to infrastructural development than either Chinese or Brazilian projects, but with less technology transfer ▶▶ Chinese projects contribute more to the conservation of natural capital in the form of reduced pollution ▶▶ Industrial gas projects have meagre co-benefits and renewable and forestry projects have a greater capacity to contribute to sustainable development
The Clean Development Environmental Kuznets Mechanism and Curve framework2 Sustainable Development: A Panel Data Analysis; Yongfu Huang and Terry Barker, 2009
34 CDM host countries over the period 1990–2007; however, CDM host countries which had their first CDM projects in the pipeline after 2006 were excluded
▶▶ CDM projects are correlated with a decline in CO2 emissions in host countries
Analysis of the relationship between the additionality of CDM projects and their contribution to sustainable development; Johannes Alexeew, 2010
Literature review and multi-criteria (economic, social and environmental) assessment of PDDs
A sample of 40 (31 small- and nine large-scale projects –15 biomass, 12 wind, seven hydro, four energy efficiency and two HFC-23) registered projects, chosen from the pool of 379 CDM projects in India (as of January 2009). Only projects which applied the investment analysis method for proving additionality were considered
▶▶ Significant trade-off between the two goals of the CDM – projects with an above-average sustainability performance lack a high probability of being additional, and vice versa
Benefits of the Clean Development Mechanism 2011; UNFCCC, 2011
Multi-criteria assessment of PDD content and followup survey of project participants
All of the 2,250 projects registered as of July 2011
▶▶ All registered projects report multiple sustainable development benefits
▶▶ Wind, hydro and biomass projects are consistently observed to make a high relative contribution to sustainability, but are not as likely to be additional; whereas industrial energyefficiency and HFC-23 projects are more likely to be additional, but do not contribute as much to sustainable development
▶▶ Sustainable development benefits are confirmed for almost all projects where survey was conducted, but the specific benefits reported in the PDD and in the survey are often not the same ▶▶ Employment creation and reduction in noise, odours, dust or pollution are the leading benefits of CDM projects
3 Impact on sustainable development
Title of the study; author(s) and year
Can the Clean Development Mechanism deliver?; Srikanth Subbarao and Bob Lloyd, 2011
Methodology
Case studies, sample number, countries, etc.
Desktop analysis of 500 PDDs. In addition, five case studies were investigated through site visits to verify the PDD documents
500 registered smallscale CDM projects (as of May 2008) were selected for desktop analysis, covering a wide range of sectors
39
Conclusions
▶▶ Renewable energy projects can be particularly appropriate for developing countries in terms of sustainable development benefits ▶▶ Small-scale, community-based rural renewable energy CDM projects can offer good prospects for poverty and livelihood benefits in developing countries ▶▶ Ground-truthing is critical to ensure that sustainable development claims in the PDD are actually delivered to the local communities
Bioenergy Projects and Sustainable Development: Which Project Types Offer the Greatest Benefits?; Carrie Lee and Michael Lazarus, 20111
Development dividend3 framework and textual analysis of PDDs using the Atlas.ti Version 6.2 software (Atlas.ti GmbH 2010)
71 registered and five validation-stage biomass energy projects using plantderived biomass (from a total of 291 registered biomass energy projects and 381 projects at the validation stage as of January 2010)
▶▶ The most common sustainable development benefits claimed in project documents were renewable energy production, stakeholder identification, waste reduction, employment generation and indirect income generation
Is the Clean Development Mechanism Promoting Sustainable Development?; Yongfu Huang, Jingjing He and Finn Tarp, May 2012
Long-differencing estimator models with Human Development Index as the dependent variable and CDM project development as the independent variable
All registered projects in ▶▶ Higher CDM credits per capita, higher ratios 58 CDM host countries of CDM credits per unit of gross domestic over the period product and per unit of emissions, and higher 2005–2010 investment ratios are correlated with sustainable development ▶▶ The CDM plays a very positive role in encouraging developing countries to participate in the world’s GHG abatement efforts
Source: Authors’ analysis.
1 �The CDM Tax/Subsidy Optimization Model (CDMTSO Model): a sustainable development assessment method evaluates the CDM projects’ economic and environmental benefits and an optimization program returns tax/subsidy rates at which the greatest number of CDM technologies becomes viable and where ‘better’ CDM projects can be the most profitable. 2 �A Kuznets curve is the graphical representation of Simon Kuznet’s hypothesis that as a country develops there is a natural cycle of economic inequality driven by market forces, which at first increases inequality and then decreases it after a certain average income is attained. The environmental Kuznets curve is a hypothesized relationship between environmental quality and economic development: various indicators of environmental degradation tend to get worse as modern economic growth occurs until average income reaches a certain point over the course of development. 3 �Development dividend can be defined as “benefits to developing countries beyond those strictly related to climate change, in the areas of economic growth through investment; technological evolution; poverty alleviation; environmental and human health improvements”. In other words, the development dividend consists of those benefits that might arise from CDM projects other than the reduction of GHG emissions (source: Development Dividend, Phase II Report, IISD, 2006).
40
Assessing the impact of the clean development mechanism
3.3.2 �Conclusions from key studies on the CDM and sustainable development The literature review shows the clear consensus on the three main dimensions of sustainable development: the social, the economic and the environmental (Nussbaumer, 2009; Boyd et al., 2009; Alexeew et al., 2010; UNFCCC, 2011a; Sutter, 2003; Subbarao & Lloyd, 2011; Sterk et al., 2009; Lee & Lazarus, 2011). Some of the common sustainable development criteria for each of the ‘three pillars’ used by different research studies include: ▶▶ Social criteria: health, welfare, learning, employment, poverty alleviation, equity, improved quality of life, and stakeholder participation. ▶▶ Economic criteria: financial returns to local entities, a positive balance of payments, and technology transfer. ▶▶ Environmental criteria: reduction of GHGs and the use of fossil fuels, conservation of local resources, improved local air and water quality, better waste management, etc. The following paragraphs summarize the findings of the literature survey, predominantly covering themes such as the CDM and sustainable development, the potential tradeoff between the two objectives of the CDM, the correlation between the sustainable development impacts and additionality of projects, the sustainable development benefits of small-scale and GS projects, and the ongoing debate on international guidelines for assessing the sustainability of CDM projects. The majority of the studies agree that the CDM does have a positive impact on the various facets of sustainable development in the host countries (UNFCCC, 2011a; Huang et al., 2012b). According to Huang et al. (2012), despite its inadequacies and limitations, the CDM is the only climate change mechanism that offers an innovative solution to the challenge of how to incorporate sustainable development considerations into emission mitigation activities. Nussbaumer (2009) does question the CDM’s role in promoting sustainable development in host countries. Nevertheless, the author finds the CDM to be very successful in contributing to the development of a global carbon market, allowing for temporal and spatial flexibility in achieving emission reduction targets. Several studies have attempted to understand the impact of the CDM on sustainable development in the host countries. According to Olsen and Fenhann (2008), the
distribution of sustainable development benefits among the three dimensions is fairly even, with most benefits in the social dimension, followed by the economic and the environmental dimensions. Of the various aspects of sustainable development, employment generation is the most predominant impact of CDM projects, followed by economic growth, improved air quality, and capacity-building of the local population (Olsen & Fenhann, 2008; Watson & Fankhauser, 2009; UNFCCC, 2011a). A study by Lee and Lazarus (2011) concludes that the most common sustainable development benefits claimed in project documents are renewable energy production, stakeholder identification, waste reduction, employment generation and indirect income generation through local sourcing of feedstock. However, it should be noted that differences in the dominant sustainable development impacts of projects as suggested by various studies could also be influenced by differences in the selection and definition of specific criteria and indicators for measurement, which tend to vary with the type of project assessed and depending on whether the assessment of impacts applies to the project/local, regional or national level. In terms of project type, industrial gas projects have been found to have minimal co-benefits when compared with renewable and forestry projects (Watson & Fankhauser, 2009). According to Subbarao and Lloyd (2011), renewable energy projects can be particularly beneficial to developing countries. In rural areas and remote locations, the generation of renewable energy using local resources can address the issue of energy access. Under such conditions, renewable energy solutions for village power applications can be economical, practical and functional. The study further concludes that enhanced energy access and other related services can benefit the delivery of health and educational services in the rural communities by providing modern energy services such as lighting and refrigeration, information technology and communication. Renewable energy projects can, in addition, lead to the economic development of microenterprises, local economic growth and poverty alleviation. All this helps the local communities to reduce their reliance on government services, which in turn builds up the local capacity to manage community-based rural energy initiatives. Awareness in the community about ‘environmentally benign development’ is also enhanced in the process. In terms of project scale, Olsen and Fenhann (2008) challenge the general perception that small-scale projects make a greater contribution to sustainable development than large-scale industry projects, as well as the view that HFC, N2O, energy efficiency in industry, biomass and biogas projects have minimal sustainable development benefits. Subbarao and Lloyd (2011) find that small-scale CDM projects have often failed to deliver significant or substantial
3 Impact on sustainable development
long-term sustainable development benefits to the community or region. According to Watson and Fankhauser (2009), a comparison of projects from different countries shows that Indian projects have a far greater focus on infrastructural development than either Chinese or Brazilian projects, but with the involvement of less technology transfer. On the other hand, Chinese projects largely promote the protection of the local environment and natural resources, but it is not clear whether this can be attributed to China’s preference for energy efficiency and renewable energy projects to achieve self-sufficiency and surplus generation of energy resources. Further, in relative terms, the levying of high taxes on CER revenues (2% for afforestation/reforestation (A/R) and electricity generation, 30% for N20 and 65% for other industrial gas projects) has had no significant influence on sustainable development benefits delivered by project activities in other countries. Numerous research studies have undertaken a comparative assessment of the performance of labelled projects (GS and CDCF) vis-à-vis non-labelled ones. Based on the findings of a comparative assessment of small-scale renewable energy and energy efficiency projects, Nussbaumer (2009) concludes that labelled projects do not significantly surpass the non-labelled ones in terms of sustainable development benefits. The author further states that the impact of labelled projects on social sustainable development tends to exceed that of comparable non-labelled projects, but the opposite holds true for the economic criteria of sustainable development. A number of studies have focused on the potential trade-off between the two objectives of the CDM, namely emission reduction and the promotion of sustainable development (Sutter, 2003; Alexeew et al., 2010). According to Subbarao and Lloyd (2011), the CDM in its current state and design is facing several challenges that are hindering the mechanism in delivering and adhering to its dual objectives.
3.3.3 �Recommendations from key studies for enhancing sustainable development impacts Boyd et al. (2009) argue that the current make-up of the CDM is not allowing the mechanism to attain its full potential in terms of the promotion of sustainable development. The paper recommends favouring CERs from projects with high sustainable development ratings, rather than interfering with the market forces to incorporate the value of
41
sustainable development into CER prices. Sutter and Parreño (2007) suggest, however, that market forces should recognize CDM projects not only for emission reductions but also for sustainable development benefits and, consequently, the latter should be reflected in the CER prices as well. Sutter (2003) also recommends the creation of a market for premium CERs (with a high sustainable development quota) at a higher price. Buyers of premium CERs not only evade reputational risks associated with CERs generated by unsustainable projects but also have the opportunity to use these CERs for image-building and public relations activities. The Annex I countries could promote high-quality projects by enhancing eligibility requirements with respect to the sustainable development benefits of projects to be considered under domestic trading schemes. In order to address the trade-off between the two objectives, Alexeew (2010) suggests the introduction of a sectoral crediting mechanism and a CER discounting scheme. Alexeew et al. (2010) highlight the need for: clear rules for DOEs on how they should validate CDM projects, including sanctions in the case of poor performance; more objective criteria to assess additionality, such as ambitious emission benchmarks and quantitative thresholds for common practice; a strict exclusion of projects on which the CDM has little impact (i.e. small change in the internal rate of return (IRR)); and the creation of a verification protocol. Currently, for most projects, the assessment of expected sustainable development benefits is done before the actual implementation of the activity, unlike emission reductions which are regularly monitored by the DOEs. Therefore, “efficient and robust guidelines” for the assessment of the sustainable development impacts of CDM projects are critical (Subbarao & Lloyd, 2011). In addition, Olsen and Fenhann (2008) argue for the need for an international standard for sustainability assessment, additional to national definitions. In the context of the monitoring and verification of sustainable development benefits pledged in the PDDs, Subbarao and Lloyd (2011) feel that “on-the-ground examination” of the actual state of affairs with regard to benefits generated by CDM projects is indispensable. Defining criteria and indicators helps in the documentation of CDM projects but cannot ensure the delivery of those benefits to the local stakeholders. Sterk et al. (2009) are of the view that discarding other project types except renewable energy and end-use energy efficiency in the CDM GS is “an arbitrary definition of sustainable development”. Project types like transport or waste management have immense sustainable development
42
Assessing the impact of the clean development mechanism
Figure 4. Composition of the study sample in terms of project types
Sample: Sector Coverage Afforestation 1%
Biomass energy 6%
Transport 1%
Cement 1% CO2 usage 1% Coal bed/mine methane 1% Energy distribution 1%
Tidal 0%
EE households 2%
Wind 18%
EE industry 2%
Solar 1%
EE own generation 5%
Reforestation 3%
EE service 1% PFCs and SF6 2%
EE supply side 2%
N2O 2%
Methane avoidance 8%
Fossil fuel switch 3% Fugitive 2% Hydro 23%
Landfill gas 3%
Geothermal 1%
HFCs 2%
Source: Authors’ analysis.
benefits. According to the authors, the definition of sustainable development criteria at the host-country level does encourage project proponents to consider sustainable development elements while conceptualizing CDM projects. However, there is no ex-post verification of the benefits pledged in the PDD. Furthermore, most DNAs’ sustainable development criteria lack transparency and clarity, which makes it easy for project developers to comply with the requirements. The process of stakeholder consultation is often “only rudimentary, completely unregulated and badly documented” (Sterk et al., 2009). The study recommends the introduction of an additional set of guidelines and procedures
to ensure that sustainable development benefits result from CDM projects. The new guidelines could include criteria and indicators for assessing impacts, procedures for stakeholder engagement, the monitoring of sustainable development claims and the independent assessment of the process. The implementation of the new approaches could be pursued with different levels of ambition: an ‘ambitious approach’ (mandatory adoption), a ‘do-no-harm approach’ (mandatory evaluation of negative impacts) and a ‘voluntary approach’ (voluntary approach in line with the current negotiating text on promoting co-benefits).
3 Impact on sustainable development
43
Figure 5. Composition of the study sample in terms of regions Europe 2%
Latin America and the Caribbean 13%
China 40%
Asia except China and India 15%
Africa 3%
Brazil 9%
India 18% Source: Authors’ analysis.
3.4 �Analysis of sustainable development impacts reported in registered PDDs This section describes the original PDD analysis conducted for this study, in which the sustainable development claims of a sample of registered PDDs were analysed.
3.4.1 �Methodology for PDD analysis and sample selection A random stratified sample of 202 projects was considered for this study, out of 2,963 projects registered as of May 1, 2012. 175 strata were identified representative of each region (i.e. the UN regions + India + China + Brazil) and particular project type (i.e. from 25 United Nations Environment Programme (UNEP) Risø Centre sectors). At least
one project was selected from each stratum. Where the number of projects was more than one, a random selection was done. For every 25 projects, an additional project was chosen, such that a representative sample was obtained. A statistical analysis was conducted, which concluded that for a 95% confidence level the sample size should include at least 159 projects. Therefore, a sample of 202 was statistically significant. Figure 4 and figure 5 show the composition of the sample. Each project in the sample was coded for sustainable development and technology transfer indicators, on the basis of which further analysis was conducted. The analysis of technology transfer impacts is presented in chapter 6.
44
Assessing the impact of the clean development mechanism
3.4.2 �Definition of sustainable development used in analysis Based on the literature review discussed earlier, sustainable development criteria used for this study comprised social, economic and environmental co-benefits, which were further categorized into subcriteria and indicators. These are ‘yes/no’ criteria rather than quantitative indicators. A “yes” denotes the presence of the co-benefit and a “no” denotes the absence of the co-benefit (and no negative impacts). Table 4 presents a summary of the criteria and subcriteria adopted by the study to evaluate the sustainable development impacts of CDM projects. The identification of criteria and indicators for the evaluation was an iterative process, alternating between reading, the conduct of textual analysis of the PDDs and developing and revising the taxonomy. Efforts were made to avoid overlaps between the criteria owing to the double counting of the same benefits (e.g. counting indoor smoke reduction both as a health benefit and an air-quality benefit).
3.4.3 �Limitations of the study There are several important limitations to this analysis: ▶▶ The source material for the analysis is the PDDs and therefore only positive contributions to sustainable development can be measured, since project developers are unlikely to write anything negative about their project. ▶▶ Furthermore, the descriptions of sustainable development contributions in the PDDs are only potential benefits and not the sustainable development benefits actually delivered. ▶▶ The absence of negative impacts of the project activity, such as no impact on water, air quality or land, is not counted as a benefit unless it describes an improvement to the status quo/baseline. ▶▶ General statements about the sustainability of a project activity such as “economic growth, social benefits and environmental improvement will be achieved” are only counted as benefits if they are documented with concrete examples. ▶▶ All sustainable development benefits claimed are considered to be caused by the project, even though it is possible that some of those benefits could have been realized without the CDM project activity.
▶▶ Some subjective judgement as to how to attribute the sustainable development criteria during the textual analysis of the PDDs cannot be ruled out. To address this issue to some extent, testing by a second analyst coding the same PDDs to check for inconsistent analytical results was undertaken on a portion of the sample.
3.4.4 Results of the PDD analysis While all projects lead to benefits such as income generation through CERs27 and GHG emission reductions,28 201 of 202 total PDDs in the stratified random sample mentioned other sustainable development benefits. 96% of the PDDs mentioned economic benefits through employment generation, contribution to national energy security, income generation, infrastructure creation, and transfer and promotion of cleaner, cost-effective technologies. 86% of PDDs mentioned social benefits such as improved access to clean energy, sustainable mobility, better shelter, food security, access to drinking water, improved sanitation, targeted support to local women and the strengthening of local capacity or institutions. 74% of PDDs mentioned environmental benefits such as improved local air quality, improved water quality, conservation of water, conservation of local natural resources, sustainable land-use, conservation of fossil fuel resources and better management of waste. Most of the PDDs mentioned more than one sustainable development benefit. Amongst the indicators, PDDs mentioned benefits in the context of improved local quality of life (82%), employment generation (80%) and contribution to national energy security (76%) – all social and economic indicators. Amongst the indicators under the environmental dimension, PDDs mentioned benefits in terms of improved air quality (66%), followed by conservation of local natural resources (52%). Figure 6 shows the percentages of PDDs that mention various indicators of sustainable development, while Figure 7 shows the indicators by project technology type. Technology transfer was also considered as an important sustainable development indicator. 37% of the sample of PDDs mentioned technology transfer in varied ways. Further analysis of this indicator suggested that 43% of the PDDs mentioned “no tech transfer” and it was unclear from 18% of the PDDs whether there was technology transfer.
27 �The contribution of CER generation to sustainable development is implicit in all cases, since a 2% levy contributes to the Adaptation Fund. A few DNAs, such as those of China and India, make an explicit mention of utilizing a certain percentage of CER revenues from all or from large-scale projects to contribute to the national or local sustainable development cause. 28 �GHG emission reduction is a global sustainable development benefit of all mitigation activities.
3 Impact on sustainable development
45
Table 4. Criteria to assess the sustainable development impacts of CDM projects Criteria
Keywords used when searching PDD text
Social
Improved local quality of life ▶▶ access to clean energy ▶▶ sustainable mobility
Off-grid renewable electricity, biogas, micro-hydro , public transport, housing, clean drinking water, sanitation, women, gender, potable water, etc.
▶▶ better shelter ▶▶ food security ▶▶ access to drinking water ▶▶ improved sanitation ▶▶ targeted support to women folk of the region Strengthening of local capacity and institutions
Training centre, local capacity, local bodies, women’s group, skilled labour, technical education, schools, roads, primary health centre
Economic
Employment generation
Jobs, employment, man months, man days,
Contribution to national energy security
Energy conservation, energy efficiency improvement, renewable energy generation, grid supply, replacing energy sourced from grid
CER (income) generation Infrastructure creation
Road, lighting, power transmission lines, gas pipes/lines, communication networks, water treatment plants
Transfer/introduction/promotion of cleaner and cost-effective technologies
Transfer of equipment, technology, know-how, soft skills
Environmental
Improved local air quality
CO2, CO, SOx, NOx, suspended particulates
Improved water quality, conservation of water
Clean water, water conservation, drinking water, potable water
Conservation of local natural resources
Soil erosion, soil fertility, forest, sustainable biomass use, mines, minerals, biodiversity, conservation of fossil fuel resources
▶▶ sustainable land-use ▶▶ conservation of fossil fuel resources Waste management
The sample included 79 small-scale projects and 123 large-scale projects across regions and project types. There were more sustainable development benefits stated for small-scale projects than for large-scale projects. For around 5% of the large-scale projects no other sustainable development benefit other than transfer of technology was mentioned. Most of these large-scale projects were N2O abatement (50%) or HFC projects (33%). Interestingly, two of the PDDs mentioned a “no harm” indicator and that “no jobs will be lost” by the project activity. For all the different regions, except China, the claims of benefits are more or less equally balanced across the social, economic and environmental dimensions (see figure 8). In contrast, for Chinese projects economic benefits are the
Minimization of waste generation, recycling of waste, energy from waste
most frequently claimed, followed by social and environmental benefits. Out of 81 Chinese PDDs analysed in the selected sample, 67 indicate social benefits, 80 indicate economic benefits and 49 claim environmental benefits. Whereas, out of the total 37 Indian PDDs in the sample, 36, 36 and 31 assure social, economic and environmental benefits, respectively. Similar trends were observed for the PDDs from Brazil. An analysis of trends of various indicators of sustainable development benefits across regions (figure 8) suggests that, amongst the key countries, there is the most frequent mention of improved local quality of life (includes sub-indicators such as access to clean energy, sustainable mobility, better shelter, food security, access to drinking water,
46
Assessing the impact of the clean development mechanism
Environmental
Figure 6. Percentages of PDDs mentioning various sustainable development indicators Waste management Conservation of local natural resources Improved water quality/conservation of water Improved local air quality
Economic
Tech transfer/promotion of clean tech Infrastructure creation Income generation (over and above CERs) Contribution to national energy security
Social
Employment generation Strengthening of local capacity & institutions Improved local quality of life 0
10
20
30
40
50
60
70
80
90
Source: Authors’ analysis.
Figure 7. Sustainable development benefits cited by project type Wind Tidal Reforestation N2O Landfill gas HFCs Fugitive EE supply side EE own generation EE households Coal bed/mine methane Cement Afforestation 0%
10%
20%
30%
Improved local quality of life Employment generation CER (income) generation Infrastructure creation Improved local air quality Source: Authors’ analysis.
40%
50%
60%
70%
80%
Strengthening of local capacity & institutions Contribution to national energy security Income generation (over and above CERs) Tech transfer/promotion of clean tech Improved water quality/conservation of water
90%
100%
3 Impact on sustainable development
improved sanitation and targeted support to the women folk of the region) in the PDDs from India and Brazil. PDDs from China mention contribution to national energy security the most. The rest of Asia (except for China and India) indicates employment generation as the key benefit. The rest of Latin America (except Brazil) indicates improved
47
local quality of life as the key benefit. PDDs from Africa cite a variety of indicators, such as improved local quality of life, contribution to national energy security, technology transfer, improved local air quality and conservation of local natural resources.
Figure 8. Sustainable development benefits cited by region1 Brazil India China Latin America and the Caribbean except Brazil Europe Asia except China and India Africa 0%
10%
20%
30%
40%
Improved local quality of life CER (income) generation Improved local air quality Strengthening of local capacity & institutions Income generation (over and above CERs) Improved water quality/conservation of water
50%
60%
70%
80%
90%
100%
Employment generation Infrastructure creation Conservation of local natural resources Contribution to national energy security Tech transfer/promotion of clean tech Waste management
Source: Authors’ analysis.
1 �Europe refers to Eastern Europe.
3.5 �Assessing claims of negative impacts of CDM projects This section focuses on assessing the claims of negative impacts on sustainable development. The approach included a literature review and case study analysis, based on an e-mail survey and follow-up interviews. The relevant literature was identified through a keyword search. The objective was to identify literature focusing on the negative impacts of CDM projects on sustainable development. Reviewing the claims, and the nature of such claims, in turn led to the identification of specific registered CDM projects where
concerns had been raised. Each identified project was studied in greater detail on the basis of both its PDD and associated stakeholder comments (local and global). The authors of the negative claims were contacted, as were the project owners. The responses received were then screened and further reviewed as part of the assessment. In order to ensure the objectivity of the assessment, a uniform yardstick was used, which is illustrated in figure 9.
48
Assessing the impact of the clean development mechanism
Figure 9. Approach to the assessment of claims of negative impacts of CDM projects The assessment focuses on the review of literature on the negative impacts of CDM project activities on the three dimensions of sustainable development (social, economic and environmental) Literature on flaws in mechanism design and governance
Beyond the scope of the assessment
Case study analysis
1 2 3 4 5 6
Literature on negative impacts of the CDM on the three sustainable development dimensions at the local level
Literature highlighting a sector or type of projects or a region (generic)
Reviewed
Literature highlighting particular projects (specific)
Reviewed
Does the claim refer to the CDM project activity or a pre-existing situation? Wether the study was evidence based? Wether the findings were shared with the project proponent and respective national authority? Wether a third party review was conducted? Wether legal recourse available in the country was sought? Wether the project activity has worsened an existing situation?
3.5.1 �Findings regarding claims of negative impacts While there is a significant amount of literature on the benefits of the CDM, which focuses on empirically evaluating the impact of the CDM on sustainable development and technology transfer, there is limited empirical work on the negative impacts of CDM projects. Such studies have primarily focused on the overall mechanism, identifying flaws in the design of the mechanism. Studies that examine the governance and design of the mechanism are addressed in the governance of the CDM report (Classens, 2012) commissioned by the CDM Policy Dialogue. The scope of this work is on the literature that examines the local negative impacts of specific projects. The literature available on this issue is predominantly ‘grey literature’ (i.e. not peer-reviewed scientific literature). Amongst the grey literature, some papers highlight issues across an entire sector or category of projects. Examples include, for large hydropower projects, negative environmental impacts on aquatic life, negative social
impacts through displacement of communities from the vicinity, and environmental impacts from leakage from the reservoir (Haya & Parekh, 2011). Similarly, for landfill projects, concerns are raised about the loss of livelihood for garbage pickers and the lack of consideration of alternatives to the project (GAIA, 2011). Furthermore, there is literature that has a strong regional focus (e.g. African Biodiversity Network et al., 2011, focusing on the projects that exist in Africa). The authors of that paper argue that the CDM presents serious challenges and negative impacts. They also criticize proposals to further broaden the range of projects that are eligible for the CDM, such as genetically modified crops and the addition of biochar to soils. A study by the University of KwaZulu Natal Centre for Civil Society (2012) discusses six case studies from African countries, including South Africa’s Bisasar Road landfill methane to electricity project and the Niger Delta gas flaring projects, amongst others, in the context of negative impacts. Some reports focus on specific problems, such as human rights abuse in Honduras. There are also policy papers (e.g. Zagema, 2011) highlighting the CDM as an international mechanism providing perverse
3 Impact on sustainable development
49
Table 5. Case studies of potential negative impacts of CDM projects Case
Country
Issues under examination
Mtoni Landfill Gas Project
Tanzania
Livelihood of waste-pickers, environmental impacts (leachate), alternative project activities
The Pan Ocean Gas Utilisation Project
Nigeria
Promoting an activity which is illegal according to the domestic law of the host country
Bisasar Road landfill
South Africa
Environmental issues due to the landfill
Aguan biogas recovery from Palm Oil Mill Effluent (POME) ponds and biogas utilization
Honduras
Human rights issues
Barro Blanco Hydroelectric Power Plant Project
Panama
Human rights issues
Okhla-Timarpur project
India
Livelihood of waste-pickers
Improving Rural Livelihoods through Carbon Sequestration
India
Stakeholder process, livelihoods and natural resource management
Xiaoxi CDM Hydropower Projects (135 MW) from China
China
Displacement and inadequate compensation, environmental impacts
Source: Authors’ analysis.
incentives to exacerbate already existing social, environmental and economic problems. Eight cases were selected from the literature review for further analysis. Availability of information was critical in the choice of the cases. The cases, however, had a reasonable sectoral and regional coverage. In terms of the issues being examined, these projects have been discussed in literature in relation to various issues, including human rights violation, environmental impacts, loss of livelihoods and displacement of communities. The identified cases are shown in table 5. Out of the above cases, for the Okhla-Timarpur project in India the reply to enquiries was insufficient to make an evaluation. Key findings from the other seven cases indicate that, in four of the seven cases, the issue raised regarding the CDM project related to a problem that existed before the CDM project was developed. For example, in the case of the Bisasar Road landfill in South Africa and Aguan biogas recovery from POME ponds and biogas utilization in Honduras, the problems cited by stakeholders existed prior to the CDM project activity. This means that the CDM projects themselves were not the causes of the problems, nor was there evidence presented that the CDM projects worsened these pre-existing situations. In most of the cases, reports or responses do not provide evidence to support the claims of negative impacts of the
CDM project activity. Only two cases indicated field visits and filed testimonies as the evidence for their claims (Xiaoxi CDM Hydropower Projects in China and Improving Rural Livelihoods through Carbon Sequestration in India). It is not clear (as most of the claimants did not respond to this question) whether the claims were presented to the project proponents. In one case (Xiaoxi CDM Hydropower Projects in China) the claims were presented to the funding partner, who in turn asked for a third-party verification of the claim. In another case, that of the Mtoni Landfill Gas Project in Tanzania, the project proponent responded to a newsletter article on negative impacts of the project. In the case of Aguan biogas recovery from POME ponds and biogas utilization, a third-party review was conducted by the Inter-American Human Rights Commission on the human rights issue and the situation in Honduras. This review did not focus on the CDM project activity or implicate it as a cause of the problems. In the case of the Xiaoxi CDM Hydropower Projects, the funding partner sent a monitoring mission to the project site to verify the claims. None of the respondents indicated that national legal recourse was availed for the problem. Only one respondent suggested that the report on the Improving Rural Livelihoods through Carbon Sequestration project in India was shared with the national authority on the CDM in the host country, but that there was no response from the DNA.
50
Assessing the impact of the clean development mechanism
3.6 �Options for enhancing the sustainable development contribution of the CDM For most stakeholders sustainable development is one of the most important impacts of the CDM and there is a desire to enhance this impact. In addition, almost all stakeholders would agree that any interventions should not infringe upon the host country’s right to determine whether a given CDM project meets its sustainable development priorities. There is broad commonality across countries as to how they define sustainable development criteria at a high level, even if the detail of this application varies widely. Depending on individual stakeholder priorities, there are three possible objectives of interventions related to sustainable development impacts: (a) increasing the overall sustainable development benefits originating from the CDM project pipeline; (b) measuring and reporting those benefits to the DNAs and other stakeholders; and (c) systematically preventing negative impacts. However, there may be differences amongst stakeholder groups in prioritizing interventions. For example, stakeholders that feel that CDM projects are generally delivering many positive benefits may want to focus on preventing negative impacts rather than increasing the monitoring of benefits. On the other hand, stakeholders that feel that negative impacts are best addressed at a national level may instead focus more on the measurement of impacts and enhancing benefits. The caveat to these choices is that it will be difficult to measure progress towards either greater positive impacts or fewer negative impacts without some form of monitoring and reporting system. The review of the literature, stakeholder inputs to the CDM Policy Dialogue process, interviews with experts in the field and the analysis conducted by the research team have highlighted a number of options for enhancing the sustainable development impact of the CDM. These are summarized below and explained in more detail in table 6. Providing a ‘menu’ of sustainable development indicators could enhance the documentation of the sustainable development benefits of the CDM. This menu could be compiled from current criteria or other international sources. Given that most DNAs already have criteria, they could also make these more accessible by reporting their own sustainable development criteria on the UNFCCC website, just as the national definitions of forest are currently reported. Revising the PDD format to provide more guidelines on how project participants should declare their sustainable
development contributions could assist DNAs in their decision-making process, whether or not the guidelines were linked to a list of specific indicators. Improved voluntary reporting of sustainable development benefits could go a step further, providing for both initial and ongoing declarations. These declarations could rely on either DNA-specific guidelines or draw on international reporting options. Any monitoring would have to be designed in such a way as to minimize the transaction costs. Mandatory monitoring of sustainable development benefits would provide a much more robust information base for the DNAs and other stakeholders than simple declarations in the PDD. There are many variations to monitoring, but none of these should infringe on the host country’s sovereign right to determine whether a project meets its own sustainable development criteria. The DNA and project participants could choose which indicators were appropriate for the specific project, in the light of the host country’s priorities. The monitoring could be supervised by the DNA, according to national criteria and procedures, or could be part of the UNFCCC project cycle. Verification could be conducted at validation and/or during verification (i.e. after project implementation). While this would add transaction costs, without some verification it is unclear how reliable any reporting would be. Safeguards against negative impacts, such as human rights violations, corruption and labour exploitation, could also be strengthened in several ways. As a first step, the DNA could ensure that claims of negative impacts were taken up within the legal structure and processes of the host country. In addition, the PDD could be expanded to include a checklist of key safeguard issues. As with the reporting of benefits, the reporting of safeguards could happen at the start of the project only or they could be reported periodically after implementation. The verification of compliance with safeguards could be undertaken by the DNA along with the verification of sustainable development benefits. The consequences of inadequate performance could range from project developers being provided with information to assist them with compliance through to suspending the further issuance of CERs for a project. This could be based on the project not following through on sustainable
3 Impact on sustainable development
development benefits and/or the project violating one of the safeguards. The DNA could decide on this, however, according to national criteria and procedures. Preferences for specific project types or technologies could be established to differentiate eligibility and procedures across project types, scales or regions. This would require broad political agreements as well as a sound empirical evidence base upon which to prioritize. Capacity-building for DNAs could strengthen the ability of DNAs, particularly those with the least resources, to apply their national criteria for sustainable development in the project approval process. This could include the sharing of experiences at a regional and subregional level and providing information on ‘best practice’ in project evaluation.
51
Although not discussed in detail in this report, an enhanced stakeholder consultation and appeals process could also strengthen positive sustainable development impacts. The options for this are discussed in the report on the governance of the CDM. DNAs could work towards strengthening the process of local stakeholder consultation. The relevant local authorities could be made more aware about sustainability issues and their role in the effective implementation of sustainable development benefits. Negative sustainable development impacts could be one of the possible grounds for a grievance. The governance reforms proposed under an enhanced stakeholder consultation and appeals process are also relevant to sustainable development impacts, particularly negative ones.
Table 6. Summary of options for enhancing sustainable development impacts Broad concept
Option
Advantages
Disadvantages
Sustainable development criteria and/or indicators
Providing ‘menu’ of indicators drawn from DNA lists
Increased consistency and transparency of reporting on sustainable development
Political sensitivity around any definitions at the international level
Providing ‘menu’ of indicators drawn from other international sources
Increased consistency and transparency of reporting on sustainable development
Criteria may not fit specific DNA priorities and judgements with regard to sustainable development
Aligns the CDM with other relevant international conventions and standards related to sustainable development
Sovereign concerns could reduce political willingness to implement changes
Providing criteria and indicators Increased consistency and specific to project types transparency of reporting on sustainable development Simpler, by focusing only on issues relevant to a technology
Political sensitivity around any definitions at the international level Multiple standards could add complexity to the overall CDM rule system Political sensitivity around any definitions at the international level
Could focus attention on project types with a high level of sustainable development impacts Revision of PDD format to enhance reporting
Providing guidelines for what impacts should be reported and how (e.g. qualitative versus quantitative)
Increased consistency and transparency of reporting on sustainable development
Requires time and effort of project participants and consultants to learn new format
Provides better quality information to DNAs without multiple forms
Potential increase in upfront transaction costs
52
Assessing the impact of the clean development mechanism
Broad concept
Option
Advantages
Disadvantages
Declaration, monitoring and verification of sustainable development impacts
Voluntary declaration only
No change from current situation
No enhancement of positive impacts or reduction in negative impacts
Voluntary declaration and monitoring
Could rely on DNA guidance rather than on a global standard, which could reduce the costs of monitoring
Does not provide consistency and transparency of reporting on sustainable development, since only projects with the highest level of positive benefits will report and monitor them
Enhanced DNA ownership and engagement
Some increase in transaction costs Mandatory declaration and monitoring
Increased consistency and transparency of reporting on sustainable development, including capturing the overall benefits of the CDM Provides unbiased basis for tracking effects of interventions to enhance sustainable development benefits
Safeguards against negative impacts
Project eligibility
Consequence of non-performance in relation to sustainable development
Source: Authors’ analysis.
Increase in transaction costs for validation and verification Added burden on DOE capacity Political sensitivity around any definitions at the international level
‘Do no harm’ safeguards at the No change from current situation national level
Not transparent and may not address some current concerns
‘Do no harm’ safeguards at the May reduce potential incidence of international level negative impacts Increased consistency of reporting of negative impacts
Difficult to attribute specific negative impacts to the CDM project activity, particularly if issues pre-date the CDM project
Negative list based on sustainable development impacts, excluding projects with high chance of negative impacts
Could directly reduce negative impacts without any transaction costs or monitoring procedures
Choice of sectors to exclude would be highly politically sensitive and could also be subjective
Suspension of CER issuance upon DNA request
Could directly address negative impacts and ensure projects comply with safeguards and other reporting
Ignores large differences in impacts across countries, even for the same project type
Gives DNAs the authority to enforce the sustainable development commitments made by project participants Capacity-building of DNAs
Could add complexity to the validation and verification process
Capacity-building of DNAs by EB or Nairobi Framework agencies – sharing best practices on sustainable development
Enables countries with limited capacity to establish an effective sustainable development evaluation process Could increase project flow for some underrepresented countries and project types
Uncertainty for CER buyers could have a negative impact on CER prices and project flow Adds complexity as well as uncertainty to the CDM process Mistakes could lead to the penalization of projects that are actually performing Previous experience shows that DNA capacity is necessary but not sufficient in itself for CDM project development
4 �Impact on net GHG emission reductions
4 Impact on net GHG emission reductions
The CDM has allowed industrialized countries to buy credits from developing countries for the purpose of meeting targets under the Kyoto Protocol. In principle, the CDM is designed to allow for flexibility in the location of emission reductions and thus decrease the overall cost of meeting emission targets, while providing sustainable development benefits in host countries. In principle, the overall level of global emissions (and emission reductions) should be unaffected by the use of the CDM. While CDM projects lead to emission reductions in host countries, the use of issued CERs from these projects allows buying countries to increase their own emissions (above target levels) by a corresponding amount. In theory, the CDM should function as a zero-sum instrument, with no net mitigation impact.29 In an explicit departure from the simple zero-sum calculus of the CDM, the Cancun Agreements reached at the sixteenth session of the Conference of the Parties (COP) in 2010 called for “one or more market-based mechanisms” capable of “ensuring a net decrease and/or avoidance of global greenhouse gas emissions”,30 an intention that was
55
reiterated at COP 17 in Durban in 2011.31 This, in turn, has raised questions regarding the CDM and its future direction: what is the expected net emissions impact of the current CDM (i.e. with its current methodologies, procedures and project pipeline)? In other words, are the actual emission reductions that occur as a result of CDM projects more or less than the number of CERs issued and used to meet emission reduction obligations? And, secondly, what are the options for improving the net emissions impact of the CDM, were this to be an explicit aim of the CDM in the future? This chapter addresses these questions in order. The first section of this chapter starts with a review of the CERs issued to date, expected in the future and already used by buyers in industrialized countries. It then explores research on the extent to which CERs represent additional GHG emission reductions and whether, in aggregate, issued CERs are matched by a corresponding level of actual GHG emission reductions. The second section considers options for improving the net emissions impact of the CDM.
4.1 Framework for analysis To be registered under the CDM, projects are required to be additional: that is, they would not have occurred except for the incentive provided by the CDM (Gillenwater & Seres, 2011).32 Projects are then issued credits relative to a baseline level of emissions, or the emissions that would have been expected had the CDM project activity not been implemented. The CDM has instituted procedures to test for additionality and to develop a baseline scenario for GHG emissions. If it functions as intended, then the CDM has no net impact on global emissions, it merely shifts the location of emission reductions and, in principle, lowers the overall costs of mitigation. However, to the extent that CDM projects are not additional, or are awarded more credits than the actual emission reductions achieved (that is, they are ‘overcredited’), 29 �The CDM’s influence on the ambition of past and future targets could also create a net mitigation impact, but this is not directly addressed in this chapter. 30 �See document FCCC/CP/2010/7/Add.1. 31 � The report of the COP “emphasizes that various approaches, including opportunities for using markets, to enhance the cost-effectiveness of, and to promote, mitigation actions […] must meet standards that […] achieve a net decrease and/or avoidance of greenhouse gas emissions“ (decision 2/CP.17, paragraph 79). 32 �See the report on the governance of the CDM (Classens, 2012) for a further discussion of definitions of additionality.
the CDM could lead to a net increase in global GHG emissions. By contrast, to the extent that CDM projects lead to more emission reductions than the number of credits issued (that is, they are ‘undercredited’), then the CDM could lead to a net decrease in global GHG emissions, a net benefit to the atmosphere. This section summarizes and assesses the evidence regarding these and other potential outcomes of the CDM, including their prospective impact on the CDM’s net global emissions impact. Table 7 summarizes the potential outcomes of the CDM and where they are addressed in this section. All of the research presented is intended to help address the first key research question: what is the expected net emissions impact of the CDM in its current form? The methodology for this assessment is largely a review of the literature, supplemented by an analysis of data compiled by the UNFCCC and the Institute for Global Environmental Strategies (IGES) on issued CERs, forecast CERs and the share of projects using investment analysis and barrier analysis in the course of demonstrating additionality.
56
Assessing the impact of the clean development mechanism
Table 7. Potential outcomes of the CDM and their implication for its net emissions impact Outcome
Conditions that could lead to outcome
Net emissions impact resulting from use of CERs (direct)
CERs issued from registered CDM projects that are additional
▶▶ CDM additionality procedures No direct impact on global are effective; CDM functions emissions as intended
CERs issued from registered CDM projects that are non-additional
▶▶ CDM additionality procedures Increase in global emissions are ineffective
More CERs issued than emission reductions occurred (or than business-as-usual emissions)
▶▶ Overly high crediting baselines
Increase in global emissions
Where addressed in this report
Analysis of claims of nonadditionality (section 4.3)
Analysis of over- and undercrediting (section 4.4)
▶▶ Leakage ▶▶ (Perverse incentive to increase emitting activity)
Fewer CERs issued than emission reductions occurred
▶▶ Overly conservative (low) crediting baselines
Decrease in global emissions
▶▶ Positive spillover effects ▶▶ Projects continue after crediting period ends Additional projects not validated, rejected or do not seek CDM registration
▶▶ Erroneous review and rejection ▶▶ Barriers to CDM registration
No direct impact on global emissions (because CERs are not issued)
Noted where relevant
▶▶ Stringent additionality test or baselines
Source: Authors’ analysis.
4.2 CER flows: historical and projected 4.2.1 �Project registration and CER issuance to date As of June 1, 2012, over 4,000 CDM projects had been registered. Credits have been issued for approximately 1,500 of these projects, totalling 943 million CERs. Table 8 provides further detail. Projects that reduce or avoid emissions of the so-called industrial gases HFC-23 and N2O have, so far, been the dominant sources of CERs. Renewable energy projects (especially wind and hydropower) represent the greatest number of projects registered and receiving credits, and these project types are expected to be the source of a growing share of the CERs in future years. Because of the large number of credits issued, industrial gas and renewable energy projects have faced the greatest scrutiny from researchers investigating additionality and over- or undercrediting.
4.2.2 �Use of CERs to date To date, the vast majority of CERs have been used by buyers in the EU. As of the end of 2011, 456 million CERs had been retired by entities included in the EU ETS and 265 million CERs had been retired by EU 27 governments. Use of CERs has been increasing over time (table 9). In 2011 the EU ETS retired 179 million CERs, or 10% of the scheme’s emissions, up from 6% in 2010 and 4% in prior years (European Commission, 2012). Most of the CERs retired by EU ETS buyers – over 80% – have been from industrial gas projects that reduce or avoid HFC and N2O emissions (Point Carbon, 2012b). The extensive use of CERs from industrial gas projects has important implications for the impact of the CDM. As discussed in the following sections, the additionality of these projects is relatively assured – one can say with relative
4 Impact on net GHG emission reductions
57
Table 8. Project registration and CER issuance as of June 1, 2012 Projects registered
Projects issuing credits
Credits issued (million CERs)
115
67
620
21
19
414
N2O – adipic acid
5
4
167
N2O – nitric acid
66
39
37
Other
23
5
2
Methane recovery
745
245
47
Landfill gas
198
87
24
Industrial gases
HFC-23
Coal mine/bed
58
25
12
399
121
10
90
12
1
Renewable energy
2,380
889
159
Hydropower
1,226
489
88
Wind power
1,057
380
67
97
20
4
Other power supply
608
379
90
Iron and steel waste gas
101
53
34
Fuel switch (natural gas)
70
41
32
385
162
21
Manure/wastewater Other
Other renewable energies
Biomass Higher efficiency fossil
6
-
-
Supply-side efficiency (other)
23
8
2
Other
23
5
1
Other
328
110
26
TOTAL
4,176
1,580
943
Source: Authors’ analysis based on IGES data (IGES, 2012c).
Table 9. Use of CERs by EU ETS and government buyers, 2008–2011 (million CERs) 2008
2009
2010
2011
Annual CERs retired
82
134
226
319
EU ETS
82
78
117
179 European Commission (2012)
-
20
109
137
IGES (2012d)
36
0
3
IGES (2012d)
EU 27 governments Other governments Annual CERs cancelled
1
1
1
0
Voluntary market
1
1
1
0
Annual CERs used (retired plus cancelled)
83
135
227
319
Cumulative CERs used
83
218
445
764
240
364
496
816
Cumulative CER supply (CERs issued to date)
Data source
IGES (2012d)
IGES (2012b)
58
Assessing the impact of the clean development mechanism
Table 10. Forecast cumulative issuance of CERs from projects in the CDM pipeline (million CERs) (after accounting for validation and issuance risks) 20111
2012
2020
Bloomberg New Energy Finance (2012)
816
1,162
4,349
CDC Climat (Bellassen et al., 2012)
816
1,270
6,070
IGES (2012b)
816
1,170
5,885
Point Carbon (2012a)
816
1,110
3,900
816
1,094
8,173
2
UNEP Risoe Centre (2012)
3
Source: Authors’ analysis. 1 �Issuance up to 2011 according to IGES (IGES, 2012b). 2 �2020 figure excludes 214 Mt HFC/adipic CERs issued after the first quarter of 2013 due to limited demand. Furthermore, Bloomberg New Energy Finance estimates that 231 Mt CERs will be issued from projects that enter the pipeline post 2012. It is not clear whether these CERs are included in the total cited here or not. 3 �Does not include 2,087 million CERs that the UNEP Risoe Centre forecasts will be issued from projects that enter the pipeline post 2012.
confidence that HFC and N2O destruction facilities would not have been installed in the absence of the CDM. However, other concerns – notably, perverse incentives to increase HFC output and shifts in adipic acid production leakage to CDM project locations (and hence increased N2O emissions at these facilities) – have impaired the net mitigation impact and, as a consequence, the reputation of these projects. In turn, the EU has excluded these project types from eligibility in the third phase of the EU ETS. The recent increase in the use of CERs from these project types may be partly explained by that pending exclusion (Point Carbon, 2012b).
4.2.3 Forecasts of future CER flows Project developers have continued to submit projects to the CDM at a high rate, despite uncertain demand arising from the lack of clarity on the future of the Kyoto Protocol and future international climate agreements. Drivers of continued (if uncertain) project inflow include: ▶▶ Continued perceived demand: At COP 17/CMP 7 in Durban, Parties extended the Kyoto Protocol to a second commitment period, which allows the CDM to continue operation for at least another five to eight years and to continue to meet demands from the EU ETS, EU governments and other Parties that intend to sign up for a second commitment period. Furthermore, new domestic emissions trading systems in South Korea, China and Australia, among others, may provide additional sources of demand for CERs or otherwise reduce supply if they were to withdraw CERs from the global market in order to meet their own targets (Lütken, 2010).
▶▶ The rush to beat EU ETS import restrictions: To be used in the EU ETS, CERs from countries other than the LDCs must be registered before January 1, 2013. Recent improvements in the time required to process CDM registrations have given project developers greater confidence that they can meet this deadline. ▶▶ Favourable economics: For many projects most revenue comes from sources other than CER sales, meaning that CDM registration can be attractive simply if expected CER revenue exceeds transaction costs, which are generally less than $1 per tonne of credits (Buen, 2012; Antinori & Sathaye, 2007). The World Bank estimates cumulative future demand up to 2020 for international credits (including both CDM and JI credits) at less than 2.7 billion tonnes (Kossoy & Guignon, 2012). By contrast, analysts expect the supply of CERs alone to be in the order of 4 to 8 billion tonnes up to 2020 (see table 10). All of the estimates presented in table 10 and in the remainder of this section are risk-adjusted in order to account for the possibility that projects entering the pipeline may not end up being registered or being issued as many CERs as expected. These risks include delays or failures related to prolonged or halted validation, delays in registration, project underperformance and other factors (Koakutsu et al., 2011). Different treatment of these risks helps to explain the differences in these forecasts. While industrial gas projects have accounted for the majority of the CERs issued to date, other project types – notably renewable energy projects – have represented a rapidly increasing share of project inflow and, by extension,
4 Impact on net GHG emission reductions
59
Figure 10. Forecast of cumulative issuance of CERs for projects in the CDM pipeline, by project type (million CERs) 6,000 Other
5,000
Other
Supply side efficiency (other) Other Power
HIgher efficiency fossil Biomass Fuel switch (natural gas)
4,000
Iron & steel waste gas
Cumulative CERs issued (million CERs)
Other renewable energies
3,000
Renewables
Wind power Hydro Power Other
2,000
Manure / wastewater Methane
Coal mine / bed Landfill gas
1,000
Other N2O - Nitric Acid Industrial Gas
As of June 1 2012 Source: Authors’ analysis based on IGES data (IGES, 2012b; IGES, 2012c).
expectations of future CERs issued (figure 10).33 By contrast, the rate of issuance of CERs for industrial gas projects is expected to decline up to 2020 (Point Carbon, 2012a). These trends in expected CER issuance suggest that hydropower, wind power, HFC, N2O adipic acid and natural gas fuel switching projects will dominate the future pipeline. Together, these five largest project types represent over 70% of forecast cumulative CER issuance up to 2020 and therefore deserve extra scrutiny when assessing additionality and the potential for over- or undercrediting.
33 � Figure 8 does not include forecasts of CDM programmes of activities (PoAs). CDM PoAs currently in the pipeline could yield up to 133 million CERs by 2020, with the majority (70%) from methane and energy efficiency projects (IGES, 2012). Because these projects represent less than 3% of the forecast cumulative CER supply up to 2020, they would not be expected to significantly affect the relative balance of project types in figure 8.
2020
N2O - Adipic Acid HFC
60
Assessing the impact of the clean development mechanism
4.3 Additionality – assessing the evidence Additionality is the cornerstone of project-based offsets. Broadly speaking, additionality occurs when a policy intervention (in this case, the CDM) causes an activity that would not have occurred in the absence of the intervention (Gillenwater & Seres, 2011). Assessing additionality, however, is inherently difficult and controversial. It requires establishing a causal connection between the policy intervention and the project activity, by assessing whether the project activity would have occurred in the absence of the policy intervention. Since a hypothetical future ‘without a CDM world’ cannot be directly observed, additionality can never be demonstrated with absolute certainty (L. Schneider, 2009b; Gillenwater & Seres, 2011). Furthermore, any given project activity may be ‘caused’ by a number of factors, including the prospect of CDM benefits, such as the financial value of the CERs it hopes to generate and/or the reputational or learning value of registering and operating a CDM project, and the non-CDM strategic, market or financial benefits of the project itself, as well as any policies and regulations that might encourage project implementation. Recognizing and balancing these inherent uncertainties and challenges, the CDM, like other offset programmes, has established procedures that enable an assessment of additionality. To date, the CDM has relied largely on the application of the CDM ‘additionality tool’ on a project-by-project basis, which requires a project’s proponents to demonstrate that: ▶▶ The project is either financially unattractive without the CDM (using an investment analysis) or has at least one barrier that is preventing the proposed project without the CDM (using barrier analysis). ▶▶ The project is not “common practice”, such that “no similar activities are observed” or there are “essential distinctions” between the proposed project and other similar activities (UNFCCC, 2011h). The common practice analysis must include an assessment of “the extent to which the proposed project type (e.g. technology or practice) has already diffused in the relevant sector and region”. (Special consideration is given to an activity that is ‘first of its kind’.) ▶▶ The CDM was a factor in deciding to proceed with the project activity. This ‘prior consideration’ test requires the CDM to have been “seriously considered in the decision to proceed with the project activity” and was especially important in the early years of the CDM to prevent the crediting of projects that were decided upon or even
commissioned many months or years before submitting the project for CDM registration (Michaelowa, 2009). Until 2007, the ‘prior consideration’ test was part of the additionality tool as an initial ‘step 0’. Now, for projects with a start date on or after August 2, 2008, the requirement is met by the publication of the PDD for global stakeholder consultation or the notification of the UNFCCC and host party DNA in writing of the intention to seek CDM status using the ‘prior consideration’ form (UNFCCC, 2011f).34 While the vast majority of registered, large-scale CDM projects35 to date have used the standard ‘additionality tool’, there are some alternatives and variations in current use. A few project types can use a related ‘Combined tool to identify the baseline scenario and demonstrate additionality’, though its applicability is quite limited.36 Some CDM project methodologies require the investment analysis to be used (i.e. barrier analysis on its own is not an option), often with guidance specific to the project type, including for the use of sensitivity analysis. As noted elsewhere in this report, the EB is actively exploring alternatives to project-by-project assessment, such as the use of standardized performance standards and positive lists for determining additionality (Fussler, 2012; UNFCCC, 2010b; UNFCCC, 2011d). Experience with using alternative methods for determining the additionality of CDM projects, however, remains limited at this time. Therefore, the impact of the CDM to date has been evaluated largely with respect to the performance and implementation of the CDM additionality tool.
4.3.1 �Evaluations of CDM project additionality For well over a decade researchers have been raising concerns about the ability of project-by-project assessment 34 �For projects with a start date before August 2, 2008 (but no earlier than January 1, 2000), project applications must include evidence that the CDM was a ‘decisive factor’ in proceeding with the project. At this point in time, few, if any, new project submissions are expected to have such an early start date. 35 � Small-scale and micro-scale CDM projects follow simpler additionality guidelines. 36 �Both tools are available at: http://cdm.unfccc.int/Reference/tools/index.html. The ‘tool for the demonstration of additionality’ is the most broadly applicable and most commonly used (Michaelowa, 2009).
61
4 Impact on net GHG emission reductions
Table 11. Share of registered CDM projects using investment and barrier analyses to demonstrate additionality Share using investment analysis
Share using barrier analysis
Share using both investment and barrier analysis
Total using investment analysis1
Benchmark analysis
Investment comparison analysis
Simple cost analysis
70% 0% 80% 97% 57% 64% 88% 100% 47% 66% 91% 88% 95% 63% 54% 68% 79% 46% 100% 48% 43%
5% 0% 60% 0% 13% 44% 57% 90% 27% 57% 89% 87% 94% 55% 41% 55% 63% 36% 50% 26% 13%
6% 0% 20% 2% 22% 9% 4% 9% 12% 3% 1% 1% 1% 4% 11% 13% 14% 7% 83% 26% 30%
59% 0% 0% 95% 22% 13% 31% 3% 8% 6% 0%