November 3, 2004 16:27 WSPC/115-IJPRAI
00375
International Journal of Pattern Recognition and Artificial Intelligence Vol. 18, No. 7 (2004) 1253–1266 c World Scientific Publishing Company
ASSESSING VISUO-SPATIAL NEGLECT THROUGH FEATURE SELECTION FROM SHAPE DRAWING PERFORMANCE AND SEQUENCE ANALYSIS
SAMUEL CHINDARO, RICHARD GUEST∗ and MICHAEL FAIRHURST Department of Electronics, University of Kent, Canterbury, UK ∗
[email protected] JONATHAN POTTER Kent and Canterbury Hospital, Canterbury, UK
The reported work aims to objectively and accurately assess the post-stroke clinical condition of visuo-spatial neglect using a series of standardized geometric shape drawing tasks. We present a method implementing existing pencil-and-paper diagnostic methods and define a set of static and dynamic features that can be extracted from drawing responses captured online using a graphics tablet. We also present a method for automatically assessing the constructional sequence of the drawing using Hidden Markov Models. The method enables the automated extraction, position identification and drawing order of individual sides of a shape within a drawing. Discrimination between two populations (a neglect population and stroke subjects without neglect as determined by existing standard assessment methods) using a combination of performance features and constructional sequence is examined across three separate drawing tasks. Results from experimentation show how a combination of sequence and performance features is able to generalize across a wide variety of input samples and obtain a diagnostic classification which can be used alongside other forms of conventional assessment. Furthermore, the application of a multi-classifier combination strategy leads to a significant increase in recognition ability. Keywords: Computer-based drawing analysis; visuo-spatial neglect; feature selection; sequence analysis.
1. Introduction Figure drawing tasks are used widely for the diagnosis and monitoring of a variety of neuropsychological conditions such as dyspraxia, Parkinson’s disease and stroke. Analysis of these drawing tests typically relies on the assessment of the presence and relative positioning of components (e.g. sides/corners within a shape) within the test subject’s completed drawing. Despite widespread use, human inspection ∗ Author
for correspondence. 1253
November 3, 2004 16:27 WSPC/115-IJPRAI
1254
00375
S. Chindaro et al.
of these drawings is sometimes subjective, even for trained assessors, caused by a varying interpretation of marking criteria. Alongside the conventional visual inspection analysis of a completed diagnostic drawing task, it has been shown that, for many conditions, important diagnostic information can also be obtained by observing the process and sequence in which the test subject responded. The analyzis of procedural/sequencing data has been used in a previous study by the authors to analyze completion strategy within a target cancellation task.4 This work showed that the starting position and completion path of cancelled targets was more sensitive to the condition of visuo-spatial neglect than the conventional “number of targets cancelled” assessment in that responses that appeared to be normal did, in fact contain anomalies that were significant within a neglect population. Other studies12 have assessed constructional aspects of children’s learning disorders, again finding an enhanced sensitivity to detecting the condition through the analysis of constructional performance measures. The aim of this paper is to demonstrate that the combination of timing and drawing features, including the execution strategy (in forms of the sequence in which drawing strokes are executed), can be effectively used as a diagnostic indictor. We report a series of experiments to assess the constructional properties of drawings made by tests subjects with the post-stroke condition of visuo-spatial neglect (VSN). VSN is a dysfunction caused by brain damage, the main effect of which is to cause subjects to fail to respond to stimuli in the visual field on the opposite side to the location of the lesion. Assessment of VSN has conventionally included a variety of drawing tests alongside clinical and functional evaluation. Simply assessing figure drawing tasks on a static level (that is only considering the outcome of the drawing) fails to encapsulate any information concerning the underlying strategy of drawing execution which has been shown as an important diagnostic indicator for other tasks of VSN.6 Static assessments are quantitative in nature and provide comparison of a patient’s performance at a single point in time to a normative measure. Dynamic methods (pertaining to the constructional/timing aspects of task performance) attempt to provide a greater insight into the underlying process. In order to establish the effectiveness of these dynamic properties drawing data is captured using a pen-based computer system. In particular, we describe a method for automatically extracting the sequence of drawn shape sides/edges and predicting a diagnosis from this sequence using Hidden Markov Modelling (HMM).11 As our base-line for classification we use the Conventional Battery of the Rivermead Behavioural Inattention Test (BIT).18 This battery consists of a series of pencil and paper-based tasks which were designed and verified to contribute towards a practical assessment of VSN. The performance of our devised system in terms of test subject diagnosis was assessed directly against this existing and trusted medical standard. Alongside assessing individual features, this paper also investigates if a diagnosis can be enhanced through the combination of multiple features or classification experts. The last decade has witnessed the emergence of novel classification schemes in
November 3, 2004 16:27 WSPC/115-IJPRAI
00375
Assessing Visuo-Spatial Neglect Through Feature Selection
1255
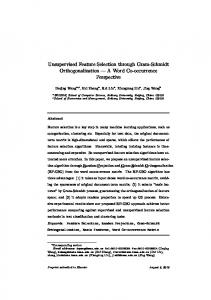
which the decisions obtained by simple classifiers are combined in order to improve generalization and hence the overall performance of the system.7 The advantages of using multiple classifiers in such unified structures have been demonstrated in addressing, among others, the problems of handwritten character recognition14 and speaker recognition. We present results obtained using individual and combinations of features in majority classification schemes. The novelty of this work is therefore in the introduction of execution strategy analysis and feature combination, based on the conventional and proven methods, to the classification and detection of VSN. 2. Experimental Protocol The data for this research were collected as part of a wider study of the assessment of VSN in stroke patients.10 A series of brain damaged patients were initially assessed using the Rivermead Behavioural Inattention Test (BIT) which provided the baseline standard for assessment of VSN. Patients were categorized as VSN/non-VSN using the standard BIT score threshold; the extent of VSN/non-VSN being reflected in the total BIT scores. 22 22 Test subjects were required to complete two drawing tasks, which were printed on sheets of paper overlaid on a standard graphics tablet (a Wacom UD1212). As Figure 1 1 completed the task using a cordless pen, status data such as pen the testFigure subject position, tablet pressure and pen tilt were stored in a time stamped file for feature extraction.
Fig. 1.
Drawing models.
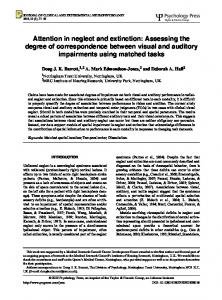
The drawing tasks involved copying a square and a cross figure, which were printed in the top horizontal centre of individual overlays. The model images are shown in Fig. 1. The cross shape was chosen because of its use in a copying trial16 where it was found to give the best separation between VSN and non-VSN subjects based on observed performance characteristics such as simplification of drawings and difficulty in producing angles between sides. Figure 2 shows examples of drawings by (a) a stroke control subject and (b) and (c) VSN subjects. Omissions and disorganization in (c) is evident and would be penalized under the conventional marking method, assessing the “completeness” of the shape. The evaluation of dynamic and constructional features becomes
November 3, 2004 16:27 WSPC/115-IJPRAI
00375
23 23
23
Figure Figure 2 2
Figure 2 (a)
(a)
1256
(a)
S. Chindaro et al.
(b)
(b)
(a)
(b)
(c)
(b)
(c)
(c) (c) Fig. 2. Examples of drawings from test subjects: (a) stroke control, (b) and (c) stroke patients with visuo-spatial neglect (VSN); sequence analysis would be able to distinguish between (a) and (b), but not (a) and (c). (c) would be penalized when assessing completeness.
interesting when a “correct” drawing is constructed by a VSN patient, as in (b). To establish if our extracted features are sensitive to VSN, only those VSN patients producing “correct” drawings are included in the study. A total of 20 VSN (10M/10F, mean age = 76) right hemisphere stroke subjects who scored below the BIT VSN threshold were included in the experiments (VSN group). The BIT scores of the VSM subjects covered a wide range which indicated cases of mild to severe VSN. A group of 39 right hemisphere stroke patients scoring above the threshold (stroke controls) (22M/17F, mean age = 75.1) were used as the Stroke Control (SC) group. No significant effects were found due to age, gender or handedness. 3. Feature Extraction As an initial experiment, a series of features were extracted from the drawing data to investigate their ability to distinguish between VSN and SC subjects. These features, described below, included a number of generic static and dynamic features alongside a automated analysis of drawing construction sequence.
November 3, 2004 16:27 WSPC/115-IJPRAI
00375
Assessing Visuo-Spatial Neglect Through Feature Selection Table 1.
1257
Static and dynamic features.
Feature Type
Diagnostic Rank
Starting Point
Dynamic
11
Drawing is divided into quadrants. The starting point signifies in which quadrant the drawing was started.
Number of Strokes
Dynamic
5
The number of individual line strokes drawn during drawing execution.
Task Execution Time
Dynamic
1
Time taken to complete each drawing task.
Maximum and Mean Pressure
Dynamic
7(Mean), 8(Max)
Average Pen Acceleration
Dynamic
10
Average pen speed
Average Pen Velocity
Dynamic
12
Average change in pen speed
Pen Contact Ratio
Dynamic
6
Ratio of the time when pen is off the tablet to the time when pen is on the tablet,
Overall Distance Travelled
Static
9
Distance travelled by the pen in executing the drawing.
Image Height, Width and Area
Static
Feature Name
2(H), 3(W), 4(A)
Comments
Pen pressure was recorded by the tablet at 256 discrete levels
Measure of Image Height, Width and Area
3.1. Static and dynamic features Twelve generic performance features were extracted from each shape attempt and used for classification. Four static features, which describe the spatial organization of the drawing, such as image height, width and area were extracted in addition to eight novel dynamic features, which describe the construction of the drawing with measurements such as pen velocity, acceleration and contact ratio. Features pertaining to the drawing strategy, such as the starting position within the shape and number of strokes, were also extracted. Table 1 details the twelve generic features that were extracted from each of the drawings. The table includes the “diagnostic rank” whose derivation is explained later in Sec. 4.2.
3.2. Drawing strokes sequence extraction Figure 3(a) shows a flowchart of the method used to automatically extract side sequences from shape drawing response files. The algorithm extracts a conventional 8-point chain code [Fig. 3(b)] from pairs of pen coordinates within the test response file. Once a chain code is generated for the entire file it is then smoothed to eliminate any spurious pen movements. This is achieved by sliding a 5-code width window across the sequence and finding the modal directional code within the
a
November 3, 2004 16:27 WSPC/115-IJPRAI
Figure 3
Open capture file
Figure 3 aFigure 3
a
1258
a
Read in coordinate pair
00375
24 Smooth chain code to remove movement noise.
Obtain 8 point chain code
24 24 Identify sections
S. Chindaro et al.
Repeat until EOF Open capture file
Read in coordinate pair
Obtain 8 point chain code
Read in coordinate Read inpair
Obtain 8 point chain code Obtain 8 point
Open capture file Open capture file
coordinateRepeat pair until EOF chain code Repeatsides until EOF Order Repeat until according toEOF position
Obtain sequence Obtain sequence
Obtain sequence
Obtain sequence
Order sides according to Order sides position
Smooth chain code to remove Identify sections movement Smooth chainSquare: noise. code to remove Smooth chain Identify sections Identify largest 2 movement code to remove Identify sections noise. horizontal and movement noise. vertical sections Square: Identify largest 2 Square: horizontal and Identify largest 2 vertical sections Square: horizontal and Cross: Identify largest 2 vertical sections
horizontal andlargest 4 Identify vertical sections Cross: horizontal and Identify largest sections 4 Cross: vertical horizontal Identify largest 4and vertical sections horizontal and Cross:
according to Order sides position
according to position
vertical sections Identify largest 4
b.
b.
b.
(a)
horizontal and vertical sections
b.
(b)
c. c. d. c.
c. d.
d.
d.
1121111121221
1121111121221
1 111122112 22 21 1 1 11 12 11 1111(c)
1111111121221
1121111121221 1111111121221
1 1 1 1 1 1(d)1 1 2 1 2 2 1 Fig. 3. Sequence extraction: (a) sequence extraction flowchart, (b) definition of the chain code in the 8-connected grid, (c) example with extracted chain code with a window around the first five codes, (d) example of window [Fig. 3(c)] modal smoothing (Modal Code 1).
current position. All directional codes within the window are set to this modal value. Figures 3(c) and 3(d) show this process with the extracted chain code in Fig. 3(c) with a window around the first 5 codes. This window is then smoothed as shown in Fig. 3(d) by setting all values to the modal code of 1. The window then moves on to the next block of 5 codes.
November 3, 2004 16:27 WSPC/115-IJPRAI
00375
25 25
Figure 4 Figure 4 Assessing Visuo-Spatial Neglect Through Feature Selection
1259
4 4
2 2
3 3 5
3
3
4
1
6
5
6 7
8
7
8
4
1
Fig. 4.
2
2
1
1
Drawing sequence model.
The sequence of drawn sides is obtained by assessing the two longest vertical and horizontal sections within the square chain code (the four longest when assessing the cross) and calculating the location identification mapping relative to a model with assigned side identifiers (Fig. 4). By establishing the order in which the sides were drawn a drawing sequence string can be obtained. The sequence extraction algorithm was specifically configured to the two trial shapes. Using an 8-point chain code [Fig. 3(b)] does mean however the diagonals can be detected (for example, code segments which include, 1-5, and 3-7 transitions), and work continues to apply the method to other geometrics shapes. Once the pen strokes and their sequencing have been identified, each stroke acts as a state in the physical model of the events sequence which can be presented to an HMM. 3.3. Drawing sequence analysis using HMMs Hidden Markov Models (HMM) are statistical models of sequential data that have been used successfully in image processing and computer vision,1,9 speech recognition5 and modeling of biological sequences3 among other applications. The HMM is a natural way of recognizing a pattern which can be represented as a sequence of discrete observation symbols.8 For the application described in this paper, the symbols were the identification number of an individual shape side extracted from the drawing. 3.4. Model selection A number of different models have been proposed and implemented using HMMs. The left-to-right or Bakis model2 was adopted for this investigation. In this model the underlying state sequence associated with the model increases or stays the same as the time increases. The sample sequences extracted from the tasks are representatives of successive strokes, which have a sequential relationship captured by the left-to-right model. Using this model, the number of unknown variables is reduced significantly and a representative model has higher chances of being realized with a limited number of training samples. For the full characteristics of the model the reader is referred to Ref. 11.
November 3, 2004 16:27 WSPC/115-IJPRAI
1260
00375
S. Chindaro et al.
The Bakis model also supports multiple observation sequences11 which is a requirement of our system as we have multiple training samples for each of the groups. It is assumed that each of the observations is independent of each other. The observation sequence O, therefore consists of several independent sequences, O(k) , k = 1, 2, . . . , K, where O (k) is a training sequence, for a given class and K is the total number of samples used for that class. The goal is to maximize P (O/λ) which is obtained by: P (O|λ) =
K Y
P (O(k) |λ) =
k=1
K Y
Pk .
(1)
k=1
Since the re-estimation formulas are based on frequencies of occurrence of various sequences, the formulas for multiple observation sequences are computed by adding together the individual frequencies of occurrence for each sequence. 3.5. Sequence recognition The transition behavior of the sequences obtained from the feature extraction routine can be modeled in terms of the probability of each transition using an HMM. We can therefore compute a model for each of the two groups of patients (VSN and Stroke Control). The maximum number of states is governed by the maximum number of transitions for each model: 4 for the square and 8 for the cross. The HMM sequence recognition system is based on finding the probability associated with the single best sequence corresponding to that of the test pattern. The Viterbi algorithm is widely used in solving the most likely sequence of states for a given sequence of observation in HMM problems.15 For a single HMM, Viterbi algorithm can be expressed as11 : δ1 (i) = πi bi (O1 ) ,
1≤i≤N
(2)
where N is the number of states and δ1 (i) is the probability that symbol O1 is observed at time t = 1 and state i, which describes the initialization of the algorithm. π is the n-length initialization probability distribution vector. After initialization, a recursive method is applied as follows: δi (j) = max bδT −1 (i)aij cbj (Ot ) , 1≤i≤N
2≤t≤T,
1≤j≤N
(3)
where δ(j) is the maximum probability that the symbols O2 , O3 , . . . , OT are observed in state j at time t. The terminating criterion is: p∗ = max [δT (i)] . 1≤i≤N
(4)
The maximum probability of δT (i) for each state i and at the final time is the scored probability of the observed sequence against the model and the corresponding state is the final state of the optimal path.
November 3, 2004 16:27 WSPC/115-IJPRAI
00375
Assessing Visuo-Spatial Neglect Through Feature Selection
1261
4. Experimental Results Two experiments were conducted on the captured data: the first to establish the classification performance of individual features including the HMM-based drawing sequence analysis, the second experiment investigated the use of multiple decision “experts” within the classification process. 4.1. Feature classification Table 2 details the results from training five commonly used classifiers, the Fisher linear discriminant, the nearest mean classifier (nmc), the k-nearest neighbor classifier (knnc), a linear classifier using Karhunen–Loeve expansion on the joint data (kljlc), and a decision tree classifier (treec) with the test data. To obtain these results, each dataset (VSN and SC) was randomly partitioned into equally sized training and testing sets. The classifiers were trained using the training sets and their performance (in correctly identifying VSN and SC cases) assessed using the testing set. This process was repeated ten times (a ten-fold cross-validation exercise) and the results averaged across the trials. Table 2 includes the results from (i) using all dynamic and static features as a single feature vector and (ii) using HMM on the sequential data. Table 2. Feature classification results; shape and classifier based non-sequence included.
Method
Classifier
Dynamic and Static Features
Fisherc nmc knnc kljlc treec
Square Classification Rate (%)
Cross Classification Rate (%)
61.0 57.6 66.1 55.9 54.2
64.4 55.9 62.7 69.5 52.5
55.9
69.5
HMM
The best performing single feature for both tasks was the task execution time with a recognition rate of 64.4% for the cross (kljlc) and 62.7% for the square (knnc). When all features were included the best results for the square and cross improved to 66.1% (Fisherc) and 69.5% (kljlc) respectively. These selected results and the rest of the individual classifier results provide benchmarks to assess the benefit of incorporating sequential information together with the standard dynamic and static features in a combination strategy. 4.2. Multiple “expert” classification The second experiment was conducted to assess if a diagnostic improvement could be obtained from using more than one feature and decision “expert”. In order to
November 3, 2004 16:27 WSPC/115-IJPRAI
1262
00375
S. Chindaro et al.
increase the number of decision makers in a multiple classifier strategy, feature results obtained from each shape were divided into two sets, based on a performanceranking. The method used for feature ranking was 1-nearest neighbour classification performance.13 Since we are using a classifier for feature evaluation, the ranking order will be linked to the classifier.17 However this is not of importance as the primary aim is not to choose the best features, but to be able to have some criterion for grouping the features for multiple classifier purpose. Any other classification/ranking method could be used for this purpose. In order to get balanced none-dominating groups, two groups were formed by extracting alternate features in the ranking order, i.e. Group 1 (1,3,5,7,11) and Group 2 (2,4,6,8,10,12) where the numbers represent the performance based ordering. Table 2 identifies the diagnostic rank of each of the features. Initially each group is used separately to reach a classification decision. The decisions from these two groups and that obtained using the sequential data are then used in a majority combination scheme to make the overall final decision more accurate and robust. This combination scheme is illustrated in Fig. 5. Figure 5 Feature Group 1
Feature Classifier
Feature Group 2
Feature Classifier
Sequencing Data
H M M Classifier
Fig. 5.
M ajority Voting
D ecision
Combination strategy.
Table 3 show classification results and improvements over individual assessment strategy when a multiple “expert” combinational approach which included sequential information was applied. The highlighted case is the odd case when there was a decrease in performance. For instance, by including sequential information to the information provided by standard static and dynamic features and combining, an improvement of 11.9% over the square strategy is obtained in the case of the nmc. An improvement of 19.6% was obtained in the case of the treec using the cross results (see Table 3). In the absence of comparative data, but considering the difficulties in automatically distinguishing between VSN and non-VSN stroke subjects, obtaining such an increment by introduction of sequential information is quite significant.
26
November 3, 2004 16:27 WSPC/115-IJPRAI
00375
Assessing Visuo-Spatial Neglect Through Feature Selection
1263
Table 3. Multiple “expert” classification results; shape and classifier based sequence results showing individual classifier improvements over non-sequence included.
Method
Classifier
Combination Strategy (Majority Voting)
Fisherc nmc knnc kljlc treec
Square Classification Rate (%)
Improvement Over Square Non-Sequence Included Method
Cross Classification Rate (%)
Improvement Over Cross Non-Sequence Included Method
69.5 69.5 64.4 66.1 60.3
8.5 11.9 −1.7 10.2 6.1
74.1 64.4 66.1 78.1 72.1
9.7 8.5 3.4 8.6 19.6
5. Conclusion An experimental study of feature processing with the aim of distinguishing between VSN and non-VSN populations as determined by existing clinical standards has been presented. It is based on application of a combinational approach which takes into account the static and dynamic aspects of the drawing strategy. Besides standardizing the analysis of responses removing the subjectivity that was prevalent in conventional assessment of drawings, we have introduced an analysis of the constructional strategy. A major contribution of this paper is in experimentally proving that important diagnostic information can also be obtained by observing the process and sequence in which the test subject responded. This information, combined with information obtained from analysis of the completed task can enhance the diagnostic ability of standard drawing tasks. We can conclude from the results obtained from the combinations that a solution to diagnosis improvement may lie on a multiple-classifier approach that takes into account the strengths and weaknesses of the various diagnostic features and exploit the complimentary information in them. In this case we have incorporated sequential information gathered through analysis of the execution strategy, with that obtained from standard dynamic and static methods. The diagnostic accuracy has been shown to improve when multiple decisions are reached and the overall decision is obtained by combining the individual outputs. References 1. K. Aas, L. Eikvil and R. B. Huseby, Applications of hidden Markov chains in image analysis, Patt. Recogn. 32(4) (1999) 703–713. 2. R. Bakis, Continuous speech word recognition via centi-second acoustic states, in Proc. ASA Meeting, 1976. 3. R. J. Boys, D. A. Henderson and D. J. Wilkinson, Detecting homogeneous segments in DNA sequences by using hidden Markov models, Appl. Stat. 49(2) (2000) 269–285. 4. N. Donnelly, R. Guest, M. Fairhurst, J. Potter, A. Deighton and M. Patel, Developing algorithms to enhance the sensitivity of cancellation test of visuo-spatial neglect, Behav. Res. Meth. Instrum. Comput. 31(4) (1999) 668–673.
November 3, 2004 16:27 WSPC/115-IJPRAI
1264
00375
S. Chindaro et al.
5. R. E. Donovan and P. C. Woodland, A hidden Markov-model-based trainable speech synthesizer, Comput. Speech Lang. 13(3) (1999) 223–241. 6. P. W. Halligan, J. C. Marshall and D. T. Wade, Visuospatial neglect — underlying factors and test sensitivity, Lancet II (1989) 908–911. 7. J. Kittler, M. Hatef, R. P. W. Duin and J. Matas, On combining classifiers, IEEE Trans. PAMI 20(3) (1998) 226–239. 8. H. Kunsch, S. Geman and A. Kehagias, Hidden Markov random fields, Ann. Appl. Probab. 5(3) (1995) 577–602. 9. J. Li, A. Najmi and R. M. Gray, Image classification by a two-dimensional hidden Markov model, IEEE Trans. Sign. Process. 48(2) (2000) 517–533. 10. J. M. Potter, A. Deighton, M. Patel, M. C. Fairhurst, R. M. Guest and N. Donnelly, Computer recording of standard test of visual neglect in stroke patients, Clin. Rehab. 14 (2000) 441–446. 11. L. R. Rabiner and B. H. Juang, An introduction to hidden Markov models, IEEE ASSP Mag. (1986) 4–16. 12. C. Remi, C. Frelicot and P. Courtellemont, Automatic analysis of the structuring of children’s drawing and writing, Patt. Recogn. 35 (2002) 1059–1069. 13. B. D. Ripley, Pattern Recognition and Neural Networks (Cambridge, 1996). 14. K. Sirlantzis, S. Hoque and M. C. Fairhurst, Trainable Multiple Classifier Schemes for Handwritten Character Recognition, Lecture Notes in Computer Science, Vol. 2364 (2002), pp. 169–178. 15. A. J. Viterbi, Error bounds for convolutional codes and an asymptotically optimal decoding algorithm, IEEE Trans. Inform. Th. IT-13 (1967) 260–269. 16. E. K. Warrington, M. James and M. Kinsbourne, Drawing disability in relation to laterality of cerebral lesion, Brain 89 (1966) 53–82. 17. A. R. Webb, Statistical Pattern Recognition, 2nd edn. (John Wiley, 2002). 18. B. Wilson, J. Cockburn and P. Halligan, The Behavioural Inattention Test Manual (Thames Valley Test Company, Fareham, Hants, UK, 1987).
November 3, 2004 16:27 WSPC/115-IJPRAI
00375
Assessing Visuo-Spatial Neglect Through Feature Selection
Samuel Chindaro received a B.Eng. Hons degree in electronics from the National University of Science and Technology in Zimbabwe in 1996. He worked briefly as a projects engineer in the field of instrumentation and automatic control systems before obtaining an M.Sc. in electronics and IT from the University of Birmingham in 1998. He received a Ph.D. in electronic engineering from the University of Kent in 2003. Between 2002 and 2003, he worked as a research assistant at the University of Kent in the field of diagnosis of visuo-spatial neglect using computerbased analysis of drawing tasks. Dr Chindaro is currently employed as a research associate at the University of Kent, working on investigation of novel strategies for improved design of multiple classifier structures. His interests include multiple-classifier systems, pattern recognition, color and texture processing, biometrics and image analysis techniques for drawing-based medical diagnosis.
1265
Richard Guest obtained a B.Eng. in computer science from the University of York in 1995 and a Ph.D. in electronic engineering from the University of Kent in 2000. He was employed from 1995 to summer 2000 as a research assistant at the University of Kent in the field of image analysis and processing, specifically the analysis of drawing dynamics for the clinical evaluation of patients. He is currently a member of the academic staff of the Department of Electronics at Kent. He has published widely within these fields and has served on numerous conference program and organizing committees. He is currently the project co-editor for the emerging ISO/IEC Biometric Data Interchange Format for signature devices. He is a member of the British Machine Vision Association, International Graphonomics Society and the IEE. His research interests include handwritten data analysis for medical diagnosis and biometric purposes, dynamic signature verification and pattern recognition.
November 3, 2004 16:27 WSPC/115-IJPRAI
1266
00375
S. Chindaro et al.
Michael Fairhurst is Professor of Computer Vision and Head of the Department of Electronics at the University of Kent. He has been actively engaged in research in image analysis and computer vision for many years, with a particular interest in computational architectures for image analysis and the implementation of high performance classification algorithms. Applications of principal interest include handwritten text reading and document processing, medical image analysis and, especially, security and biometrics. Professor Fairhurst is a past Chairman of the IEE Professional Group E4 on Image Processing and Vision and, more recently, has been a member of the Executive Committee of the IEE Visual Information Engineering Professional Network. He has been the Chairman of many conferences in the IEE International Series on Image Processing and Applications, and many other conferences and specialist workshops (including Co-Chairing the most recent International Conference on Document Analysis and Recognition). He has been a member of numerous Conference Organising and Programme Committees, including those of the two principal events in the field of handwriting analysis and document processing (IWFHR and ICDAR). He is a member of the British Machine Vision Association, the Association for Biometrics (Chairing its subcommittee on Education and Awareness), and the European Biometrics Forum. He is a member of the Editorial Board of several international journals in the image analysis field, including IJDAR and PAA. Over the years he has been a Guest Editor for several journal special issues, most recently for a Special Issue of IJDAR on Multiple Expert Classifiers. He has recently been elected as a Fellow of the International Association for Pattern Recognition. He has published more than 300 papers in the scientific literature and has authored an undergraduate textbook on computer vision.
Jonathan Potter is a Consultant Geriatrician at the Kent & Canterbury Hospital, Canterbury. His clinical responsibilities include the running of a 16bedded stroke unit in Canterbury. The unit has a long running commitment to research and has undertaken work evaluating methods of rehabilitation, and the comparison of outcomes between units, the study of cognitive and perceptual impairments in stroke and the effect of stroke from the perspective of the patient and carer. Dr Potter’s academic commitments include: Honorary Senior Lecturer, the Centre for Health Services Studies (CHSS) at the University of Kent at Canterbury. His work with the CHSS focuses on evaluation of standardized assessment for older people. As a Honorary Senior Lecturer at Kent Institute of Health and Medicine (KIHMS), University of Kent, Canterbury, he developed research and training within East Kent. He has been an Associate Director at the Royal College of Physicians of London Clinical Effectiveness and Evaluation Unit (CEEU), responsible for the Health Care of Older People programme. The unit works to develop guidelines, audit tools and indicators of high quality care.