Assessment of Multi-Sensor Neural Image Fusion and Fused Data Mining for Land Cover Classification M. Pugh Air Force Research Laboratory Information Directorate Rome, NY, U.S.A.
[email protected]
Abstract - Recent studies suggest that the combination of imagery from earth observation satellites with complementary spectral, spatial, and temporal information may provide improved land cover classification performance. This paper assesses the benefits of new biologically-based image fusion and fused data mining methods for improving discrimination between spectrally-similar land cover classes using multi-spectral, multi-sensor, and multitemporal imagery. For this investigation multi-season Landsat and Radarsat imagery of a forest region in central New York State was processed using opponentband image fusion, multi-scale visual texture and contour enhancement, and the Fuzzy ARTMAP neural classifier. These methods are shown to enable identification of sub-categories of land cover and provide improved classification accuracy compared to traditional statistical methods.
Keywords: Image fusion, pattern recognition, pattern learning, land cover classification, neural network
1 Introduction During the past decade significant advances in satellite sensor technology, data processing techniques, and computational power have made it possible to obtain new information about earth features and their relationships from a more global perspective. Recent advances in multi-sensor fusion are making it possible to combine complementary information from multiple regions of the electromagnetic spectrum. Several studies suggest that the combination of remotely-sensed electro-optical and microwave data may improve overall land cover classification accuracy [1]. Fusion of visible and infrared electro-optical data and synthetic aperture radar data, from different regions of the electromagnetic spectrum, may provide increased interpretation capabilities for forest classification [2][3][4]. Temporal data which includes seasonal changes can be used to add another dimension of useful information for classification [5].
A. Waxman and D. Fay BAE Systems Advanced Information Technologies Burlington, MA, U.S.A.
[email protected] [email protected] Neural network classification approaches are increasingly being used to incorporate multi-sensor and multi-source data into the classification process. A significant advantage of neural network classification methods over traditional statistical methods is that they do not require prior knowledge of the statistical distribution of the classes in the data sources in order to perform classification. While the predominant neural network architecture has been the feed-forward multiple layer perceptron with back-propagation learning, adaptive resonance theory map (ARTMAP) neural networks offer several advantages for classification of remotely sensed imagery for land cover mapping [6]. Perhaps the most significant advantage is that ARTMAP neural networks utilize match-based learning as compared to the errorbased learning of back-propagation networks. As a result, ARTMAP neural networks have the unique capability of learning new categories without corrupting previously learned categories. Another advantage of ARTMAP neural networks is that they are self-organizing and therefore do not require prior specification of the neural network structure. This paper discusses the application of a new image fusion and fused data mining approach for combining and exploiting complementary multi-spectral, multi-sensor, and terrain-contextual data to enhance discrimination between spectrally-similar land cover classes and improve land cover classification performance [7][8]. The described methods utilize a biologically-based implementation of opponent-band image fusion, in conjunction with visual texture and contour enhancement on multiple scales, the Fuzzy ARTMAP neural classifier, and a salient-feature discovery algorithm. Advantages of this neural fusion approach include adaptive contrast enhancement, the ability to identify subtle and non-linear patterns, as well as the ability to utilize spectral, textural, and temporal patterns in the classification process. The difficult problem of forest classification was selected for this investigation to enable a rigorous evaluation of these methods. Classification performance was evaluated in three ways using multi-spectral datasets, multi-sensor datasets, and multi-temporal datasets to enable addedvalue assessment of different sensor and data modalities.
Form Approved OMB No. 0704-0188
Report Documentation Page
Public reporting burden for the collection of information is estimated to average 1 hour per response, including the time for reviewing instructions, searching existing data sources, gathering and maintaining the data needed, and completing and reviewing the collection of information. Send comments regarding this burden estimate or any other aspect of this collection of information, including suggestions for reducing this burden, to Washington Headquarters Services, Directorate for Information Operations and Reports, 1215 Jefferson Davis Highway, Suite 1204, Arlington VA 22202-4302. Respondents should be aware that notwithstanding any other provision of law, no person shall be subject to a penalty for failing to comply with a collection of information if it does not display a currently valid OMB control number.
1. REPORT DATE
3. DATES COVERED 2. REPORT TYPE
JUL 2006
00-00-2006 to 00-00-2006
4. TITLE AND SUBTITLE
5a. CONTRACT NUMBER
Assessment of Multi-Sensor Neural Image Fusion and Fused Data Mining for Land Cover Classification
5b. GRANT NUMBER 5c. PROGRAM ELEMENT NUMBER
6. AUTHOR(S)
5d. PROJECT NUMBER 5e. TASK NUMBER 5f. WORK UNIT NUMBER
7. PERFORMING ORGANIZATION NAME(S) AND ADDRESS(ES)
Air Force Research Laboratory,Information Directorate,Rome,NY,13441 9. SPONSORING/MONITORING AGENCY NAME(S) AND ADDRESS(ES)
8. PERFORMING ORGANIZATION REPORT NUMBER 10. SPONSOR/MONITOR’S ACRONYM(S) 11. SPONSOR/MONITOR’S REPORT NUMBER(S)
12. DISTRIBUTION/AVAILABILITY STATEMENT
Approved for public release; distribution unlimited 13. SUPPLEMENTARY NOTES
9th International Conference on Information Fusion, 10-13 July 2006, Florence, Italy. Sponsored by the International Society of Information Fusion (ISIF), Aerospace & Electronic Systems Society (AES), IEEE, ONR, ONR Global, Selex - Sistemi Integrati, Finmeccanica, BAE Systems, TNO, AFOSR’s European Office of Aerospace Research and Development, and the NATO Undersea Research Centre. 14. ABSTRACT
see report 15. SUBJECT TERMS 16. SECURITY CLASSIFICATION OF: a. REPORT
b. ABSTRACT
c. THIS PAGE
unclassified
unclassified
unclassified
17. LIMITATION OF ABSTRACT
18. NUMBER OF PAGES
Same as Report (SAR)
8
19a. NAME OF RESPONSIBLE PERSON
Standard Form 298 (Rev. 8-98) Prescribed by ANSI Std Z39-18
2 Study Site The site selected for this research was a forested region located in central New York State (42.75º N, 76.08º W), representative of the Appalachian plateau. This region of rolling hills and valleys, originally formed by glaciers, contains more than 4,000 ha of conifer tree plantations and natural deciduous hardwood trees. In addition, this region includes several open areas, agricultural fields, brush/shrub land, ponds, streams, roads, trails, and a downhill ski area. Elevations in this region vary between 382 and 625 meters above mean sea level. As can be seen more clearly in Figure 1, the naturally diverse terrain and land cover at this site provides a rich and challenging environment for land cover classification studies. Figure 2: April 2001 Landsat image of the study site
3.2 Radarsat Imagery
Figure 1: View of New York State Forest study site
Three Radarsat synthetic aperture radar (SAR) images of the study site were obtained for the dates of 7 May 2001, 11 August 2001, and 5 October 2001. These images were selected to correspond to the spring, summer, and fall Landsat multi-spectral images. These fine-beam mode SAR path images have a ground resolution distance of about 8 meters and incidence angles that range between 42.79 º and 46.74º. Figure 3 shows a Radarsat image of the study site collected on 7 May 2001. Note that although fields, ponds, roads, and man-made features can be readily identified in this image, differences between forest classes are much more difficult to discern.
3 Dataset A multi-season dataset was developed for this analysis which consisted of three pairs of Landsat and Radarsat images collected during “leaf-off” spring, “leaf-on” summer, and “leaf-senescent” fall seasons of the same year. Additionally, a 10 meter resolution Digital Elevation Model (DEM) mosaic image was developed for the site using USGS 7.5-minute quadrangle DEM files and a high resolution mosaic reference image was developed using 1 meter resolution color infrared Digital Ortho Quarter Quad (DOQQ) images.
3.1 Landsat 7 ETM+ Seasonal Imagery Three seasonal Landsat-7 ETM+ images of the study site were obtained for the dates of 28 April 2001, 15 June 2001, and 5 October 2001 which approximately correspond to the spring, summer, and fall growing seasons. An April 2001 visible band image of the study site is shown in Figure 2 with the leaves of the deciduous hardwood trees just beginning to emerge in some areas. In this image, the dark green coniferous forest plantations can be can readily be distinguished from the deciduous forest areas which appear brownish in their leaf-off state. However, discrimination between different species of coniferous or deciduous forest in this color image can be seen to be more difficult.
Figure 3: May 2001 Radarsat image of the study site
3.3 Digital Elevation Model A 10 meter spatial resolution digital elevation model (DEM) was developed for the study site by combining six 7.5-minute by 7.5-minute quadrangle digital elevation data files into a single mosaic terrain elevation model. This data was used to create a model of the terrain surface to enable analysis of the fused multi-sensor image data in a three-dimensional geo-spatial context.
4 Ground Truth Ground truth data for study site was established using a combination of forest compartment maps, continuous forest inventory plots, high resolution aerial orthographic images, and numerous field surveys with a Global Positioning System (GPS) receiver.
4.1 Continuous Forest Inventory Plots An extensive ground reference database of more than 350 continuous forest inventory (CFI) plots on an approximate 300 meter grid has been developed for much of the study region by the State University of New York College of Environmental Science and Forestry. The position of each CFI plot was determined using survey grade GPS equipment and marked with a permanent ground stake to provide a consistent baseline for continuous forest characterization over time. Data collected for each CFI plot includes a detailed description of all trees within a 15 meter radius of each point, as well as plot-wide information on the slope and aspect of the terrain.
homogeneous. The compartment labeled Red Pine, for example, appears to be fairly homogeneous in the region on the left, but hardwood trees can be seen to have grown up through the Red Pine in many portions of the middle and lower right regions. At the much lower resolutions of the Landsat and Radarsat imagery, these nonhomogeneous areas are much more difficult to discern and often appear as mixed pixels.
4.3 Ground Truth Map Based on information gathered during field surveys, several regions of the study site were identified which contain groupings of homogeneous tree species that could be used to train the neural search agents and evaluate their performance for forest land cover characterization. The selected ground truth regions are illustrated in Figure 5 with an April 2001 Landsat panchromatic image shown in the background for reference. Open Water Deciduous Nor Spruce Red Pine White Pine Hemlock White Cedar Larch
4.2 Arial Photographs and Field Surveys Although forest compartment maps provided valuable information on the dominant tree species in many regions of this New York State forest region and the CFI plots provided valuable tree-level data at many point locations, this data alone was not sufficient for identifying homogeneous groupings of individual tree species needed for training the neural search agents and for evaluating forest land cover classification results. Information pertaining to the distribution of individual forest species across the test site was obtained using 1 meter resolution color infrared aerial photographs in conjunction with field surveys using a hand-held GPS receiver.
Figure 5: Homogeneous land cover ground truth areas
5 Data Pre-Processing Image fusion is generally performed by combining information at the pixel level from multiple images. Fusion of images from multiple sensors and multiple viewing geometries requires that all of the images be registered to a common geographical reference and that the images also be registered to each other. This is a critical step in the image fusion process since misregistration errors can cause signature feature information from different ground resolution cells to be incorrectly combined.
Figure 4: Color IR aerial photo of forest compartments A detailed view of some of the forest compartments located at the study site can be seen in Figure 4. At the high resolution of this aerial photograph, many regions of the labeled forest compartments can be seen to be non-
For this investigation all images in the dataset were reprojected to a common UTM Zone 18, WGS84 coordinate system, orthorectified, and co-registered. In addition, the Landsat imagery was corrected for both atmospheric and topographic effects to enable more accurate comparison of the spectral and thermal signatures in the multi-temporal data. A ground reflectance image was calculated for each of the Landsat spectral bands and a ground brightness temperature image
was calculated for the thermal infrared bands. The Radarsat data was processed using a Gamma - Maximum A Priori speckle reduction filter to reduce unwanted system noise in the image and enhance the ability to distinguish scene textures. The Radarsat images were then processed to convert the data from slant-range to ground-range and terrain height corrections were performed to remove terrain lay-over effects produced by the side-looking SAR geometry. A sigma naught correction was applied to the SAR images to reduce terrain incidence angle effects on the return signal. Finally all Landsat and Radarsat images were then resampled to a common 15 m resolution to enable pixellevel image fusion.
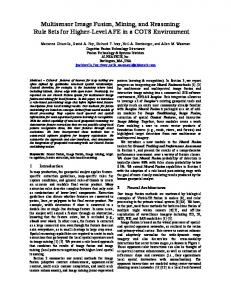
surround shunting networks which serve to decorrelate information in image layer pairs. This process acts to contrast enhance spectral differences between images and map these differences to the human opponent color channels, red vs. green and blue vs. yellow. Singleopponent and double-opponent color contrast image products are then combined with an intensity image and converted to red, green, and blue for display. The fused results can be used for both visualization or as additional image layers for classification.
6 Neural Image Fusion Fusion and image mining of the multi-spectral and multisensor data was performed using new Neural Fusion tools recently developed by BAE Systems Advanced Information Technologies as an add-on module to ERDAS Imagine®. This software consists of a set of modules that can be configured by an analyst to normalize and condition registered images, fuse multispectral and multi-sensor images, and process terrain spatial characteristics [9][10]. Using a guided-learning process the dataset can then be interactively mined to detect objects at the pixel level from their combined multi-spectral and multi-sensor signatures in conjunction with their local spatial characteristics.
6.1 Image Conditioning Based on models of spatial-opponent processing in the bipolar and horizontal cells of the human retina, modified center-surround shunting neural networks [11] were used to adaptively normalize and contrast enhance each of the co-registered panchromatic, visible, infrared, thermal, and SAR images prior to multi-band and multi-sensor fusion. This process provides a high frequency boost in combination with ratio processing on three scales for each pixel in the image. The high frequency boost enhances detail, while the ratio processing suppresses some effects of locally varying illumination across the scene and acts as a local gain control for adaptive normalization. This processing converts the original image brightness to a controlled mixture of brightness and spatial contrast. This initial stage of normalization and conditioning is particularly useful when combining images of large dynamic range with images of limited dynamic range or when combining data from different sensors.
6.2 Image Fusion A neural image fusion process based on human visual opponent-color processing was applied to combinations of registered visible, near infrared, short-wave infrared, thermal infrared, panchromatic, and radar images to produce color fused images by means of opponent-color visual processing, as shown in Figure 6. This fusion process is also implemented using feed-forward center-
Figure 6: Multi-sensor neural image fusion architecture
6.3 Spatial Features Additional image layers were created to exploit spatial and contextual patterns data in the vicinity of any pixel. This additional spatial content can contribute useful signature information for roads, rivers, forests, orchards, and urban areas. Multi-scale contour images, periodic texture images, and grayscale variance images were produced for the Landsat panchromatic images and Radarsat SAR images to provide additional information useful for discriminating between spectrally-similar land cover classes. Digital elevation data was also used to create three-dimensional terrain contextual feature information layers including terrain height, slope, mean curvature, and Gaussian curvature images.
6.4 Contour Features Each of the seasonal Landsat panchromatic and Radarsat SAR images was processed to create a set of boundary contour images which characterize perceptual edges, extended contours, and feature groupings in the imagery to support land cover characterization. Contour images were developed at multiple scales using elongated Gabor filters of both even and odd polarity. Each of the images was processed using twelve oriented Gabor filters that compete across orientation and local image space, but cooperate across scales in a manner that approximates the Boundary Contour System (BCS) in the visual cortex [12][13][14]. The use of multi-scale Gabor filters enables the processing of spatial frequency contrast information in addition to edge contrast enhancement.
6.5 Grayscale Variance
7 Image Deepfile Creation
Each of the Landsat panchromatic and Radarsat SAR images was also processed to produce grayscale variance images on multiple scales over a local neighborhood. Grayscale variance images provide a measure of tonal variation in the remotely sensed images which can often be related to the texture of the terrain surface. For example, forested regions with rougher tree crown textures appear with considerable variations in the graylevel brightness, while smoother surface textures such as agricultural fields or water are displayed with very little variation. These textural variations can add another useful element of information for discriminating between spectrally-similar terrain surfaces.
After the pre-processing, image conditioning, image fusion, and spatial feature exploitation stages were completed, the co-registered images were combined into multi-layer image stacks or “deepfiles”, as illustrated in Figure 7. These spectrally and spatially enhanced image layers provide an expanded library of information that can be used by the neural network pattern learning and recognition algorithm to discriminate between different forest land cover classes.
6.6 Periodic Textures Each of the seasonal Landsat panchromatic and Radarsat SAR images was also processed using broad Gabor filters at multiple scales to create a set of periodic spatial texture images which can be used to characterize terrain features with repetitive spatial patterns, such as rows of trees, orchards, or evenly spaced houses. This measure of textural energy is often useful for identifying regions of high spatial frequency in the images. It should be noted that the absence of any periodic texture can sometimes also be a useful discrimination feature.
6.7 Three Dimensional Terrain Features The orthorectified DEM developed for the study site was used to generate additional images representing threedimensional spatial context information. Elevation, slope, mean curvature, and Gaussian curvature images were generated for this analysis, although other measures of spatial context could also have been easily incorporated for use in the data mining process. Terrain elevation and slope data can sometimes provide useful spatial context information for land cover classification, such as for mountainous regions where forest composition varies systematically with terrain elevation. Mean and Gaussian surface curvatures calculated from the digital elevation data for each pixel based on classical equations of differential geometry can be used to identify terrain features such as ridges, valleys, saddles, peaks, pits, and flat planes. These measures of local terrain surface curvatures can provide useful information for the study of many environmental and ecological processes including the estimation of rainwater run-off for watershed analysis, characterization of soil properties, and evaluation of forest ecosystem productivity. In this forest classification study for example, this spatial context data was found to provide additional discrimination information useful for identification of some forest species such as Hemlock which tend to grow naturally in the wetter valley regions.
Figure 7: Multi-layer image deepfile A total of eight different deepfiles were created to support added-value assessment analysis of the spectral, spatial, and temporal data for forest characterization. First, three deepfiles were created using the seasonal Landsat image layers, the digital elevation data, the opponent contrast image layers, the color fused multi-band image layers, and the terrain contextual image layers to enable comparison of forest characterization results using neural image fusion methods with results obtained using the traditional maximum likelihood classifier. Next, three additional deepfiles were created using the data from the seasonal Landsat deepfiles plus the corresponding Radarsat images, multi-sensor opponent contrast images, color fused Landsat and Radarsat images, and the terrain contextual images to support added-value assessment of multi-sensor fusion for forest characterization. Finally, the three seasonal Landsat deepfiles were combined into a single multi-temporal Landsat deepfile and the three seasonal Landsat-Radarsat deepfiles were combined into a single multi-temporal Landsat-Radarsat deepfile to support added-value assessment of temporal pattern recognition for forest characterization.
8 Image Mining Using a guided-learning process, the deepfile dataset was then interactively mined to detect objects at the pixel level from their combined multi-spectral and multi-sensor signatures in conjunction with their local spatial characteristics. Image mining was accomplished for each of the seasonal and temporal deepfiles using a modified Fuzzy ARTMAP neural network followed by a salientfeature discovery algorithm. A functional diagram of the modified Fuzzy ARTMAP neural network used for image mining is shown in Figure 8.
Forest Class Example
Supervised Training
Forest Class Counter-Example
Match Tracking
F3
Category-to-Class Mapping
Unsupervised Clustering
Reset
F2
Bottom-Up/Top-Down Adaptive Filters
Complement Coding
F1
ρΤ
f1 …. f3
….
fi
….
ρΝΤ
Deepfile Feature Vectors
Spruce, Red Pine, White Pine, Hemlock, White Cedar, and Larch. Five different salient feature subspaces were discovered and used to provide classification evidence. For this analysis, pixels for which there was agreement between 4 of the 5 salient subspace classifications were selected as detections. Higher or lower confidence levels could be selected depending on the application. Typically, only a few of the deepfile image layers were needed to achieve the desired classification performance for a specific land cover class. For performance evaluation, detections were declared if the identified search pixel was within a single pixel of the specified ground truth pixels. A detection neighborhood of plus or minus one pixel was used to compensate for resampling and rasterization errors. Declaration of misclassifications or “false alarms” was performed in a similar manner. No morphological filtering was applied to the detection results, such as filling in holes or removing of single pixels. In this analysis, the probability of detection is defined as the number of correctly identified ground truth pixels divided by the total number of ground truth pixels in the specified class. Pixels which do not satisfy the 4 out of 5 detection criteria are not classified, and reduce the probability of detection. Missed pixels are not considered as false alarms. The probability of false alarm is defined as the number of target class pixels detected in other ground truth categories divided by the total number of pixels in those other categories.
Figure 8: Simplified Fuzzy ARTMAP neural network
This network consists of a lower ART module which performs unsupervised clustering of deepfile feature vectors into categories, and an upper layer in which the learned categories form associations with either the desired class or the background terrain through supervised training [15]. This approach enables the network to learn a compressed representation of the desired class in the context of the background terrain. The Fuzzy ARTMAP network combines unsupervised category learning with supervised class association. A salient-feature discovery algorithm exploits the signatures of both the desired land cover class and the background context to discover reduced feature subspaces that are sufficient for learning to recognize forest classes from the provided training data. The salient-feature discovery algorithm attempts to find those features in the input data that enable adequate separation between the desired class example and counter-example training pixels [16]. Search agents were trained using both examples and counter-examples for each desired forest land cover class. Supervised training was primarily performed in the forest region, on the southwest side of the test site, while search results were evaluated across the entire test site. Typically, about 100 pixels were provided as examples and 200-300 pixels were provided as counter-examples for the training of each forest and land cover class. Training was performed for the broad land cover classes of deciduous, coniferous, open/agricultural, and water, as well as for specific forest species including Norway
9 Results Classification was initially performed for each of the three seasonal Landsat images using the traditional maximum likelihood statistical classifier to provide a baseline against which the performance of the neural image fusion and feature extraction methods could be compared. This classification was first performed for the broad land cover classes of open/agricultural, water, deciduous forest, and coniferous forest and then repeated with the single broad coniferous forest class being replaced the individual coniferous forest species of Norway Spruce, Red Pine, White Pine, Hemlock, White Cedar, and Larch. The classification results from each of seasonal Landsat datasets are shown in Table I. This summary table provides a convenient means for quickly comparing the detection performance of the broad forest land cover classes and individual forest species classes for each of the datasets. As can be seen in this table, the maximum likelihood classifier performed well for the broad land cover classes with probabilities of detection better than 85% in any season. However, classification performance for the spectrally-similar coniferous forest classes can be seen to be much lower with probabilities of detection ranging from 36% to 73%. The overall probability of detection for maximum likelihood classification of the coniferous forest species was found to be 59.63% for the April 2001 imagery, 53.20% for the June 2001 imagery,
and 54.69% for the October 2001 imagery. Analysis of these results and corresponding classification maps revealed significant spectral confusion between the different classes of coniferous forest species which varied from season to season.
Finally, data mining and classification was performed using the modified Fuzzy ARTMAP neural classifier for fused seasonal Landsat-Radarsat image deepfiles and the multi-season fused Landsat-Radarsat image deepfile. Neural classification results for each of these fused Landsat-Radarsat datasets are shown in Table III.
Table I. Maximum Likelihood classification: multi-season Landsat Table III. Neural Fusion classification: multi-season Landsat&Radarsat Open Water Deciduous Coniferous
Apr 2001 Pd Pfa 96.1 0.2 89.9 0.0 99.0 8.4 88.2 1.1
Jun 2001 Pd Pfa 97.9 1.3 87.1 0.0 96.8 6.7 87.7 2.7
Oct 2001 Pd Pfa 97.1 0.6 85.8 0.0 91.7 7.1 88.6 5.1
Nor. Spruce Red Pine White Pine Hemlock White Cedar Larch
69.6 56.2 39.3 53.6 66.1 73.2
71.8 51.7 36.3 49.3 51.0 59.1
72.0 50.8 44.5 40.3 59.0 61.6
2.5 5.7 2.5 1.7 2.9 0.4
3.5 3.0 0.4 0.7 3.3 2.4
2.3 3.3 0.7 2.2 3.9 1.0
Data mining and classification was then performed using the modified Fuzzy ARTMAP neural classifier for each of the three seasonal Landsat deepfiles and also for the multi-season temporal Landsat deepfile. As previously discussed, each of the Landsat deepfiles contains the conditioned multi-band Landsat images, opponent-band contrast images, fused multi-band images, and spatial terrain context images. Neural classification results for each of these Landsat datasets are shown in Table II.
Table II. Neural Fusion classification: multi-season Landsat
Open Water Deciduous Coniferous
Apr 2001 Pd Pfa 99.7 0.1 100 0.0 99.8 0.9 98.8 0.1
Jun 2001 Pd Pfa 99.8 0.3 99.8 0.3 99.4 2.0 93.7 0.3
Oct 2001 Pd Pfa 99.1 0.1 99.2 0.0 97.5 2.1 91.3 0.8
Temporal Pd Pfa 99.6 0.1 100 0.0 99.6 0.1 99.6 0.2
Nor. Spruce Red Pine White Pine Hemlock White Cedar Larch
97.9 90.2 85.3 92.2 91.9 83.6
88.4 92.2 90.4 84.1 87.9 87.6
93.9 86.0 87.0 71.0 87.3 94.1
97.3 91.4 91.9 95.2 92.8 95.3
0.2 0.6 0.2 0.4 0.1 0.1
0.4 0.4 0.4 0.2 0.1 0.1
0.2 0.3 0.2 0.4 0.1 0.3
0.1 0.1 0.1 0.1 0.1 0.1
As can be seen in this table, the neural fusion methods performed very well for the broad land cover classes with probabilities of detection better than 91% in any single season and better than 99% using the multi-season temporal Landsat dataset. The neural fusion methods can also be seen to provide good classification performance for each of the individual species of coniferous forest with probabilities of detection better than 70% for any season and better than 91% for the multi-season temporal dataset. The overall probability of detection using the neural image fusion and data mining methods for classification of the coniferous forest species was found to be 90.18% for the April 2001 Landsat image deepfile, 88.42% for the June 2001 Landsat image deepfile, and 86.55% for the October 2001 Landsat image deepfile. The overall probability of detection for the multi-season temporal Landsat image deepfile was 93.99%. The probabilities for false detections were found to be less than 1% for all coniferous forest classes in any season.
Open Water Deciduous Coniferous
Apr 2001 Pd Pfa 99.6 0.0 100 0.0 99.3 0.6 97.3 0.2
Jun 2001 Pd Pfa 98.7 0.0 100 0.1 99.2 1.6 93.9 0.4
Oct 2001 Pd Pfa 97.8 0.1 99.9 0.0 96.2 3.4 91.1 0.8
Temporal Pd Pfa 99.5 0.0 100 0.0 99.5 0.1 99.7 0.1
Nor. Spruce Red Pine White Pine Hemlock White Cedar Larch
97.2 90.8 87.5 92.5 91.0 84.8
91.2 91.4 90.7 82.9 88.5 89.9
92.1 87.5 87.9 73.2 86.1 93.2
98.6 91.4 92.6 95.4 94.4 95.9
0.2 0.5 0.1 0.4 0.1 0.1
0.2 0.1 0.1 0.3 0.1 0.3
0.1 0.4 0.1 0.7 0.1 0.3
0.1 0.1 0.1 0.1 0.1 0.1
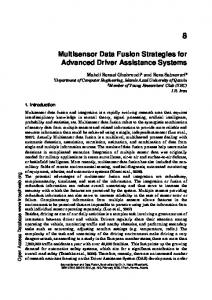
As can be seen in this table, classification results using the fused Landsat-Radarsat image deepfiles are comparable to those obtained with the Landsat image deepfiles. Probabilities of detection were determined to be better than 91% in any single season and better than 99% using the multi-season temporal Landsat dataset. The neural fusion methods can also be seen to provide good classification performance for each of the individual species of coniferous forest with probabilities of detection better than 73% for any season and better than 91% for the multi-season temporal dataset. The overall probability of detection using the neural image fusion and data mining methods for classification of the coniferous forest species was found to be 90.63% for the April 2001 fused Landsat-Radarsat image deepfile, 89.18% for the June 2001 fused Landsat-Radarsat image deepfile, and 86.66% for the October 2001 fused Landsat-Radarsat image deepfile. The overall probability of detection for the multi-season temporal Landsat-Radarsat image deepfile was 94.71%. The probabilities for false detections were found to be less than 1% for all coniferous forest classes in any season. Figure 9 shows an example of a coniferous forest classification map generated using the neural methods for the April 2001 Landsat dataset. In this classification map, individual coniferous forest species detections are shown as an overlay on a grayscale Landsat panchromatic image for reference. For clarity the broad classes of open/agricultural fields, water, and deciduous forest have not been shown. As can be seen in this classification map, the application of neural methods resulted in high level of classification accuracy with few false detections. Closer inspection of these classification results using the high resolution aerial photographs revealed high levels of correlation across the entire scene for all regions of coniferous forest large enough to be represented by a few Landsat pixels. The speckled appearance in some of the detected regions can generally be correlated with open areas or locations where hardwood trees have grown within the conifer tree plantations.
Figure 9: Coniferous forest species classification, Neural Fusion methods, Landsat, April 2001
10 Conclusions An approach for improving classification performance for spectrally-similar land cover classes using biologicallybased visual processing and pattern recognition methods was successfully demonstrated using widely available remotely sensed imagery and digital elevation data. The added information derived from fusion of multiple bands of Landsat imagery in combination with terrain spatial context data enabled a significant improvement in the ability to classify individual forest species, compared to spectral-only maximum likelihood classification. The additional incorporation of SAR imagery provided classification accuracies comparable to those obtained from the Landsat-only datasets. Processing of the temporal pattern information across the seasonal datasets resulted in the most accurate classification of each forest species with the fewest misclassifications. Examination of the salient feature layers utilized for each of the individual forest species classifications revealed that the color fused multi-band images and pair-wise spectral opponent images generally provided more useful information for discrimination than the single band images. Spatial data such as grayscale variance, BCS contours, and surface curvatures also provided information useful for separating some spectrally-similar classes. While the results of this research were shown in the context of forest classification using multi-spectral and synthetic aperture radar imagery, the described methods could be readily applied to other remote sensing applications or other sources of remote sensing data.
References [1] C. Pohl and J.L. van Genderen, Multisensor image fusion in remote sensing: concepts, methods, and applications, International Journal of Remote Sensing, 19 (5): 823-854, 1998 [2] D.G. Leckie, Synergism of synthetic aperture radar and visible/infrared data for forest type discrimination,
Photogrammetric Engineering and Remote Sensing, 56 (9): 1237-1246, 1990 [3] Kasischke, E. S., The use of imaging radars for ecological applications – a review, Remote Sensing of Environment, 59 (2): 141-156, 1997 [4] F.M. Henderson, R. Chasan, J. Portolese, and T. Hart, Jr., Evaluation of SAR-optical imagery synthesis techniques in a complex coastal ecosystem, Photogrammetric Engineering and Remote Sensing, 68 (9): 839-846, 2002 [5] A.H. Schistad Solberg, A.K. Jain, and T. Taxt, Multisource classification of remotely sensed data: fusion of Landsat TM and SAR images, IEEE Transactions on Geoscience and Remote Sensing, 19 (4): 768-778, 1994 [6] G.A. Carpenter, M.N. Gjaja, S. Gopal, and C.E. Woodcock, ART neural networks for remote sensing: vegetation classification from Landsat TM and terrain data, IEEE Transactions on Geoscience and Remote Sensing, 35 (2): 308-325, 1997 [7] A.M. Waxman, D.A. Fay, B.J. Rhodes, T.S. McKenna, R.T. Ivey, N.A. Bomberger, and V.K. Bykoski, Information fusion for image analysis: geospatial foundations for higher level fusion, in Proceedings of the 5th International Conference on Information Fusion, Annapolis, MD, 2002 [8] M.L. Pugh, Forest Terrain Feature Characterization Using Multi-Sensor Neural Image Fusion Methods, PhD Dissertation, State University of New York, April 2005 [9] BAE Systems, Neural Fusion user’s guide: multisensor image fusion and mining module for ERDAS Imagine, BAE Systems, Inc., Burlington, MA, 2004 [10] D.A. Fay, R.T. Ivey, N. Bomberger, and A.M. Waxman, Multisensor image fusion in a COTS exploitation environment, Proceedings of SPIE: Infrared Technology and Applications XXIX, 5074: 298-311 [11] A.M. Waxman, A.N. Gove, D.A. Fay, J.P. Racamato, J.E. Carrick, M.C. Seibert, and E.D. Savoye, 1997, Color night vision: opponent processing in the fusion of visible and IR imagery, Neural Network Letters, 10 (1):1-6, 1997 [12] J.G. Daugman, Uncertainty relation for resolution in space, spatial frequency, and orientation optimized by two-dimensional visual cortical filters, Journal of the Optical Society of America, 2 (7): 1160-1169, 1985 [13] S. Grossberg, and E. Mingolla, 1985, Neural dynamics of perceptual grouping: textures, boundaries, and emergent segmentations, Perception and Psychophysics, 38: 141-171, 1985 [14] A.M. Waxman, M.C. Seibert, A. Gove, D.A. Fay, A.M. Bernardon, C. Lazott, W.R. Steele, and R.K. Cunningham, Neural processing of targets in visible, multispectral IR and SAR Imagery, Neural Networks, 8: 1029-1051, 1995 [15] A.M. Waxman, J.G. Verly, D.A. Fay, F. Liu, M. Braun, B. Pugliese, W. Ross, W. Streilein, A prototype system for 3D color fusion and mining of multisensor/spectral imagery, Proc. of 4th International Conference on Information Fusion, Montreal, 2001 [16] W. Streilein, A. Waxman, W. Ross, F. Liu, M. Braun, D. Fay, P. Harmon, and C. Read, Fused multisensor image mining for feature foundation data, Proc. of 3rd International Conf. on Information Fusion, Paris, 2000