Vol. 37 Vol. No. 237(2011) - 75 71 - 75 Triyono,Atom et alIndonesia / Atom Indonesia No. 2 71 (2011)
Assessment of Nugget Size of Spot Weld using Neutron Radiography Triyono1*, Jamasri1, M.N. Ilman1, R. Soekrisno1 and Sutiarso2 1
Department of Mechanical and Industrial Engineering, Gadjah Mada University Jl. Grafika No. 2 Yogyakarta 55281, Indonesia 2 Center for Technology of Nuclear Industry Materials, National Nuclear Energy Agency Puspiptek Serpong, Tangerang 15314, Indonesia
ARTICLE INFO
ABSTRACT
Article history: Received 13 October 2010 Received in Revised form 25 August 2011 Accepted 26 August 2011
Resistance spot welding (RSW) has been widely used for many years in the fabrication of car body structures, mainly due to the cost and time considerations. The weld quality as well as the nugget size is an issue in various manufacturing and processes due to the strong link between the weld quality and safety. It has led to the development of various destructive and non-destructive tests for spot welding such as peel testing, ultrasonic inspections, digital shearography, and infrared thermography. However, such methods cannot show spot weld nugget visually and the results are very operator’s skill dependent. The present work proposes a method to visualize the nugget size of spot welds using neutron radiography. Water, oil and various concentrations of gadolinium oxide-alcohol mixture were evaluated as a contrast media to obtain the best quality of radiography. Results show that mixture of 5 g gadolinium oxide (Gd2O3) in 25 ml alcohol produces the best contrast. It provides the possibility to visualize the shape and size of the nugget spot weld. Furthermore, it can discriminate between nugget and corona bond. The result of neutron radiography evaluation shows reasonable agreement with that of destructive test.
Keywords: Corona bond Gadolinium oxide Neutron radiography Nugget size Spot weld
© 2011 Atom Indonesia. All rights reserved
INTRODUCTION∗ The resistance spot welding (RSW) is the most important joining method for joining stiffened thin plate structures, especially in automotive, railroad, and airplane structures, which contain hundreds, even thousands of spot welds. According to studies, most of the welds used in a car body assembly are RSWs. The advantages of using spot welding are that it is a quick joining technique, no filler material is required, and that the low heat input implies less risk for altered dimensions during welding. However, a spot weld provides a localized connection that it is a source of stress concentration. The strength of a thin plate heavily depends on the extent of this stress concentration around the nugget and thus fatigue crack initiates under fluctuating loading at the interior surface of welded sheets in the heat affected zone (HAZ). For this reason, the nugget size must be evaluated [1]. Several methods are available for estimating spot weld nugget size both destructive and ∗
Corresponding author. E-mail address:
[email protected]
non-destructive methods. In destructive testing, the joint is torn apart and the diameters of the spots are inspected and measured with a caliper. This is a time and labor consuming and the tested part is destroyed, which cannot be applied for inline testing. In non-destructive methods, the diameters are estimated by using additional sensors and equipments. There are various non-destructive methods. Among them, the ultrasonic evaluation is widely used for the detection of defects and for the measurement of weld size. Standard ultrasonic testing is performed with a single probe ultrasonic tester. The determination of the spot weld quality is made by the operator by analyzing an oscilloscope type screen [2]. So far, many improvements in ultrasonic inspection of spot weld nugget size due to production rate and reliability have been studied, for example, the fully automated ultrasonic [3], the real-time ultrasonic system [4], ultrasonic with a line-focused probe [5] and 2D ultrasonic arrays [6]. Other methods have been also studied such as infrared thermography [7], and digital shearography [8]. Although many different methods have been developed, these technologies still have problems with visibility and are very operator dependent. 71
Triyono, et al / Atom Indonesia Vol. 37 No. 2 (2011) 71 - 75
Neutron imaging is a powerful method for non-destructive investigations where the high penetration through metals and the high contrast for hydrogenous materials is exploited in particular. It represents an inspection method similar to X-ray imaging, but delivers different contrast and transmission features. Different contrast mechanisms are obtained for X-ray and neutron imaging, respectively, where neutrons are more sensitive for light elements while X-rays nearly ignore, for example, hydrogen. The difference in the contrast is caused by the interaction of the two kinds of radiation with the sample material. X-rays interact only with the electrons of the atomic shell, while neutrons make interactions with the atomic nuclei. Whereas the number of electrons increases the interaction probability for X-rays, there is no clear systematic rule in neutron interaction in dependency on the size of the atoms [9]. Based on the contrast mechanism, the neutron radiography is developed to analyze the spot weld to get the image of nugget. Basic method is to provide a contrast media in the gap of the spot welded materials. Water and oil are candidates because of their hydrogen content. The neutron has a high sensitivity to hydrogen, so it can detect even small amounts of water or oil in a porous structure [10,11]. Furthermore, water or oil can spread well into the gap of the spot welded structures. Another potential candidate is gadolinium oxide (Gd2O3) powder which is well known as a novel neutron imaging test device [12]. The objective of this work is to determine the best contrast media and examine the neutron nugget imaging by comparing with destructive test.
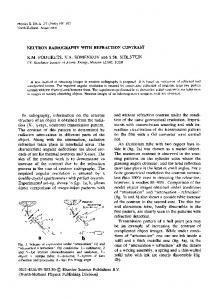
EXPERIMENTAL METHODS Carbon steel SS400 with the thickness of 3.0 mm and 1.0 mm thick austenitic stainless steel SUS304 were lap joined by resistance spot weld (RSW) as shown in Fig. 1. RSW’s electrode had diameter of 25 mm and curved surface with a radius of 400 mm. Welding current and electrode force were 4.25 kA and 6 kN respectively. Neutron radiography was performed at the Neutron Radiography Facility (RN1) installed at the S2 beam tube of the G.A. Siwabessy reactor which is operated by the National Nuclear Energy Agency of Indonesia (BATAN). The neutron beam characteristics at the S2 beam tube are shown in Table 1. Images were obtained using a gadolinium converter and a conventional X-ray film, Agfa D7 with exposure time of 200 second. 72
Fig. 1. Specimen of spot weld. Table 1. Characteristics of the BATAN’s Neutron Radiography Facility (RN1). Thermal neutron flux at sample position (n/cm2sec) Beam diameter at sample position (cm)
30
Collimator L/D ratio
83
Cadmium ratio
106 - 107
6.4 2
Neutron/Gamma ratio (n/cm /mR)
>105
Radiography techniques: Gd converter and X-ray film converter screen scintilator detector, CCD based electronic imaging system with number of pixel 1024 x 1024 and pixel size 13.5 x 13.5 µm.
The evaluated contrast media were water (no specification), oil (SAE20W50) and gadolinium oxide (Gd2O3) powder. They were inserted from the top to the joint gap using pipette and expected to spread under gravity force for filling the gap as illustrated in Fig. 2. Gadolinium oxide should be mixed with the fluid to make it spread into the joint gap easily. There is no reference to make a good gadolinium oxide solution. In previous studies, gadolinium oxide was used in powder form instead of the solution. In this work various concentrations of gadolinium oxide-alcohol mixtures were attempted to obtain the best spreading and neutron capturing rate. The various concentrations of gadolinium oxide-alcohol mixtures and pouring methods are summarized in Table 2.
Fig. 2. Pouring contrast media to the joint gap.
Triyono, et al / Atom Indonesia Vol. 37 No. 2 (2011) 71 - 75
Table 2. Various contrast media and pouring methods. Hold time for next pouring
Hold time for radiography process
No.
Types of contrast media
1.
water
-
1
-
30 minutes
2.
oil
SAE20W50
1
-
30 minutes
3.
Gadolini um oxidealcohol mixture
15 g Gd 2O 3 in 25ml alcohol
1
-
30 minutes
4.
Gadolini um oxide -alcohol mixture
10 g Gd 2O 3 in 25ml alcohol
1
-
30 minutes
5.
Gadolini um oxide -alcohol mixture
5 g Gd2O3 in 25ml alcohol
1
-
30 minutes
6.
Gadolini um oxide -alcohol mixture
1 g Gd2O3 in 25ml alcohol
1
-
30 minutes
7.
Gadolini um oxide -alcohol mixture
5 g Gd2O3 in 25ml alcohol
2
24 hours
10 minutes
Concentrations
Pouring number
mixtures do a better contrast. The concentration of gadolinium oxide-alcohol mixtures determine not only the rate of spreading, but also the level of neutron capture. Based on the neutron capturing and spreading rate, the mixture of 15 g and 10 g gadolinium oxide in 25 ml alcohol produce a perfect contrast but cannot spread well. In contrast, a mixture of 1 g can spread well but does not produce a good contrast. The best contrast media is achieved at the optimum mixture of 5 g gadolinium oxide in 25 ml alcohol. Gadolinium oxide actually is not soluble in alcohol, but they make the suspension system. If it is left in a few minutes, the gadolinium oxide particles will separate out. Alcohol is used to make this suspension system because it will soon evaporate after deliver gadolinium oxide into the joint gap. In this condition, gadolinium oxide does not immediately sediment at the bottom, but adheres to the joint gap walls.
After contrast media filling process was completed, the specimen was placed on the sample table to do the radiographs. The Experimental set up is shown in Fig. 3.
film
(a) water
(b) oil
Fig. 4. Quality of neutron radiographs with contrast media of water and oil.
camera
Fig. 3. Experimental set up.
RESULTS AND DISCUSSION The formed spot weld gaps in this work are in the range of 0.3 - 0.6 mm. Although a joint gap is very narrow, water and oil can spread well into the joint gap, fill it and form a very thin contrast media layer, while the gadolinium oxide-alcohol mixtures have a various spreading rate depending on the level of the mixture concentration. Fig. 4 shows the neutron image using water and oil as media contrast. Various results due to the level of the gadolinium oxide-alcohol mixture concentration are shown in Fig. 5. Water or oil contrast media produces almost no contrast images while gadolinium oxide-alcohol
(a) 15 gram
(b) 10 gram
(c) 5 gram
(d) 1 gram
Fig. 5. Various quality of neutron image depending on the number of gadolinium oxide in 25 ml alcohol.
73
Triyono, et al / Atom Indonesia Vol. 37 No. 2 (2011) 71 - 75
Water and oil are composed of hydrogen which is very strongly interacting with neutrons and therefore are very sensitive to detect [10,11], but in this work they cannot capture a neutron well. While gadolinium oxide suspension with a thick layer of 0.3 mm in the joint gap can capture neutron perfectly so neutron just passed nugget part. Consequently gadolinium oxide can make a good contrast. The difference in image contrast between water, oil and gadolinium oxide can be explained by the linear attenuation coefficient (µ) of hydrogen and gadolinium. Water and oil attenuate only by incoherent scattering of hydrogen which has incoherent cross section σinc ≤ 80 barn/atom which gives µΗ2Ο ≤ 2.7 cm-1. While gadolinium oxide attenuates by true absorption of neutron by gadolinium isotopes and σabs 2.5 x 10⁴ barn/atom which gives µGd2O3 165 cm-1. Using these coefficients for thickness of 0.03 cm the transmission (Ix) can be calculated by Ix/I0 = exp 92% and in (-µt), so the transmission in water Gd2O3 1%. Therefore it is evident that the high contrast is found in Gd2O3 while water gives lower contrast. Although a mixture of 5 g gadolinium oxide in 25 ml alcohol gives the best results, the obtained images still need improvement. To improve the image contrast, repeating pouring should be done. The first pouring has been left for 24 hours (one day) to ensure the contrast media can reach the narrowest part near the spot weld nugget and then performed the second pouring. The specimen was placed on the sample table immediately to do the radiographs after second pouring was completed. This improvement method obtained a better contrast image as shown in Fig. 6.
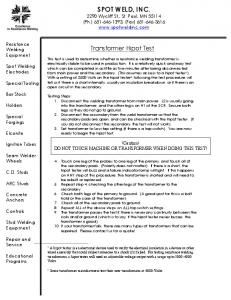
diameter measurement using neutron radiography and destructive shear-tensile test is 8.1 mm and 8.3 mm respectively. It indicates that the nugget diameter measurement using the neutron radiography has an error of 2.4%. This error relates to the difficulty in determining the nugget boundary. This is caused by the quality of the radiographic image produced which depends on the resolution of the instrument. The resolution of instrument is normally dictated by L/D ratio of the collimator and the detector resolution. The L/D ratio of 83 is not high enough to produce good collimated beam and consequently it gives ‘blurring’ on the image. Two levels of color, black and grey level, appear in the neutron radiograph image due to difference of gadolinium oxide layer thickness. Black area indicates there is no neutron attenuation because of absence of gadolinium oxide. This area is the nugget. Grey area indicates there is low neutron attenuation because of presence of very thin gadolinium oxide layer. This area is adjacent the nugget area called corona bond area. It is formed by direct pressure of surface electrode tip but generated temperature is not enough for making materials fusion. Although joined materials coincide very closely in this area but there are still enough gaps for penetration of gadolinium oxide solution. The corona gap is narrower than joint gap. It is an advantage in the neutron radiography method because it can form the different color levels to discriminate between nugget and corona bond that it is often not detected when using ultrasonic method. direction of gadolinium spreading
nugget Corona bond a) Neutron Radiography
b) shear-tensile test
Fig. 7. Comparison of nugget shape using neutron radiography and destructive shear-tensile test.
Fig. 6. Neutron image after twice pouring of media contrast.
To examine the result of neutron nugget imaging, the destructive shear-tensile test was performed. The result of neutron radiography evaluation is in good agreement with both shape and size with measurement using the destructive test as shown in Fig. 7. Nugget diameter can be determined by using the scale indicated on the Fig. 7. Nugget 74
CONCLUSION The nuggets of spot weld have been successfully imaged using neutron radiography method. The mixture of 5 g gadolinium oxide (Gd2O3) in 25 ml alcohol can spread well into the joint gap and make the best contrast image. It provides the possibility to visualize the shape and size of the nugget spot
Triyono, et al / Atom Indonesia Vol. 37 No. 2 (2011) 71 - 75
weld. Furthermore, it can clearly discriminate between nugget and corona bond. The result of neutron radiography evaluation shows reasonable agreement with that of destructive test.
ACKNOWLEDGMENT The authors would like to express their sincere gratitude for the financial support of the Ministry of National Education of Indonesia through a doctoral grant and Indonesian Railway Industry.
REFERENCES 1. M. Vural, A. Akkus and B. Eryürek, J. Mater. Proc. Tech. 176 (2006) 127. 2. M. Vural and A. Akkus, J. Achiev. Mater. Manufact. Eng. 18 (2006) 247. 3. J. Buckley and R. Servent, Improvements in ultrasonic inspection of resistance spot welds, Proc. The 2nd International Conference on Technical Inspection and NDT, Tehran, Iran (2008). 4. D. Stocco, R.G. Maev, A.M. Chertov and G.F. Batalha, Comparison between in-line ultrasonic monitoring of the spot weld quality and conventional ndt methods applied in a real production environment, Proc. 17th
World Conference on Nondestructive Testing, Shanghai, China (2008).
5. M. Fujita, M. Ueno, C. Iwamoto and S. Satonaka, Welding in The World 53 (2009). 6. Denisov, C.M. Shakarji, B.B. Lawford, R.G. Maev and J.M. Paille, J. Res. Natl. Inst. Stand. Tech. 109 (2004) 233. 7. J.H. Song, H.G. Noh, S.M. Akira, H.S. Yu, H.Y. Kang and S.M. Yang, Int. J. Autom. Tech. 5 (2004) 55. 8. L. Yang, P.R. Samala and S. Liu, Measurement of nugget size of spot weld by digital shearography, Proc. SPIE 5880, 588008, San Diego, USA (2005). 9. E. Lehmann, J. Phys. 71 (2008) 653. 10. J. Brunner, A. Hillenbach, E. Lehmann and B. Schillinger, Dynamic neutron radiography of a combustion engine, Proc. 16th WCNDT 2004 - World Conference on NDT, Montreal, Canada (2004). 11. R. Hassanein, H.O. Meyer, A. Carminati, M. Estermann, E. Lehmann and P. Vontobel, J. Phys. D 39 (2006) 4284. 12. C. Grünzweig, G. Frei, E. Lehmann, G. Kühne and C. David, Rev. Scient. Instr. 78 (2007).
75