INTERNATIONAL JOURNAL OF TECHNOLOGY ENHANCEMENTS AND EMERGING ENGINEERING RESEARCH, VOL 3, ISSUE 10 ISSN 2347-4289
43
Assessment Of Spatial And Temporal Distribution Of Some Physiochemical Parameters Of Ground water Quality Of Birnin Gwari, North West Of Nigeria Isa Zaharaddeen Kaduna State University, Department of Geography, Tafawa Balewa Way, Kaduna, Nigeria
[email protected] ABSTRACT: In four consecutive month along 8 stations, groundwater parameters such as turbidity, total hardness, temperature, TDS, nitrate, pH, E CON, chloride and BOD, were determined on the groundwater of Birnin Gwari North West of Nigeria. Aims to assess the spatial and temporal distribution of some physiochemical parameters of water quality. Inverse distance weighted method of the Geographical Information Systems is used to prepare the distribution map of physiochemical parameters of groundwater. The spatial distribution result was subjected to correlation and principal component analysis (PCA). The results of study show that the physiochemical parameters of groundwater quality varies both spatially and temporally in the study area despite that most of the parameter in temporal distribution area not conformity with WHO standard except for temperature and pH, while the spatial distribution of parameters such as turbidity, temperature, pH and chloride, clearly show that some area on the map have desirable limit value of WHO standard. The correlation result show that the parameter share a common origin source except for pH and chloride which uncorrelated with temperature and TDS with BOD. While the PCA result shows that does with strong loading are important parameter for spatial distribution of water quality. KEYWORD: Spatial Distribution, Temporal distribution, physiochemical parameters, GIS, IDW, PCA, WHO
INTRODUCTION In Nigeria as well as many other African countries, the provision of water for the teeming population is usually stated as one of the cardinal objectives of the Government. According to Federal Ministry of Water Resources, 2000, it has been estimated that only about 60 percent of the inhabitants of the urban and semi urban areas of Nigeria and about 40% of rural areas have access to portable water supply (Deloitte).Water is valuable natural resources that essential to human survive and the ecosystems health. Water are comprises of coastal water bodies and fresh water bodies (lakes, river and groundwater) (Norsaliza and Mohd). Ground water is the water beneath the surface where all the voids in the rocks and the soil are filled. It is a source of water from wells, boreholes and springs. A borehole water is a hydraulic structure which when property designed and constructed, the economic withdrawal of water for an aquifer. Borehole water is water that obtained from borehole drilled into the aquifer or ground water zone, which is usually a fully saturated subterranean zone, so distance below the water table (Abdulkarim and Umar). Ground water is already used extensively Nigeria through wells and boreholes. In realization of the need to provide portable water to the rural communities, the Federal Government in 1981 initiated the National Borehole Programme, making it a turning point in groundwater resources development in the country as a whole (Deloitte). In Kaduna, specifically, many water provision initiatives have been undertaken over the years and although achievements have been recorded in certain areas. It is estimated that there are currently about 1805 boreholes constructed by the Ministry of Water Resources, covering all Kaduna’s 23 LGAs (Deloitte). Unfortunately, boreholes water and water from other sources is never entirely pure. It varies in purities depending in geological condition of the soil through which ground flows and some anthropogenic
activities. Until very recently, ground water has been thought of as being a standard of water purity in itself and to a certain extent that is indeed true (Asante, Agbeko and Addae). The quality of borehole water is continuously changing in response to increasing population, seasonal and climatic rhythms. The quality of surface and ground water also depend on the equilibrium between the physical, chemical and biological physiognomies of the surrounding environment. Water which is essential to all forms of life and makes about 50-97% of the weight of all plants and animals, is poorly managed due to privation of information, therefore the need of this study to contribute distribution of water quality information.GIS and remote sensing has been used widely to assess the water quality all over the world (Priti and I.A. Khan)).The Advancement of Geographical Information System (GIS) and Spatial Analysis help to integrate the laboratory analysis data with the geographic data and to model the spatial distributions of water quality parameters, most robustly and accurately (Norsaliza and Mohd; Priti and I.A. Khan). The objective of the study is to assess and map the spatial and temporal distribution of some physiochemical parameters of selected borehole water.
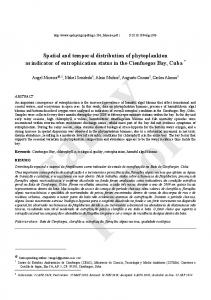
MATERIAL AND METHOD Study Area The study area is Birnin Gwari metropolis (comprises of Magajin Gari I and II ward) it is headquarter of the Birnin Gwari local Government and one of the 23 Local Government areas of Kaduna State. The town of Birnin Gwari It is located at latitude 9000.00 to 11°4.00 and longitude 6°30.05 to 9000.00, It lies in the western part of Kaduna State (Fig:1)
Copyright © 2015 IJTEEE.
INTERNATIONAL JOURNAL OF TECHNOLOGY ENHANCEMENTS AND EMERGING ENGINEERING RESEARCH, VOL 3, ISSUE 10 ISSN 2347-4289
44
Figure 1: Map of the study area Sample Collection A total of eight (8) boreholes water samples were chosen, 4 from each ward and Coordinates of sampling were listed in Table 1, were collected and analysed. The sampling process was carried out for four (4) consecutive month (i.e. January to April).Measuring and analysis was done upon nine (9) physical, chemical, parameters. These parameters were sampled monthly, Table 2 shows the Turbidity, total hardness (TH), Temperature, total dissolved solids (TDS), nitrate pH, Electrical conductivity (E_Con), chloride, and biological oxygendemand (BOD) with their unit. Table 1: Location of the Sample Point SAMPLE
LATITUDE
LONGITUDE
ADDRESS
B1
10.67713
6.54114
HAYIN DANYAYA,MAGAJIN GARI WARD II
B2
10.67119
6.54842
SCIENCE SCHOOL MAGAJIN GARI WARD I
B3
10.66221
6.54922
UNGUWAN SHIITU MAGAJIN GARI WARD I
B4
10.66266
6.54187
IMAM ROAD MAGAJIN GARI WARD I
B5
10.67273
6.53513
HAYIN BOZAYE MAGAJIN GARI WARD II
B6
10.67063
6.54043
MAKARA HUTA MAGAJIN GARI WARD II
B7
10.66545
6.53653
IZALA CENTER MAGAJIN GARI WARD II
B8
10.64837
6.53015
BAGOMA MAGAJIN GARI WARD I
Copyright © 2015 IJTEEE.
INTERNATIONAL JOURNAL OF TECHNOLOGY ENHANCEMENTS AND EMERGING ENGINEERING RESEARCH, VOL 3, ISSUE 10 ISSN 2347-4289
45
Table 2: WHO, values for parameters analysed PARAMETERS pH Temp. EC Turbidity Total dissolved solid Total hardness Chloride BOD Nitrate
Analytical Method The pH was determined using a pH meter by direct measurement, thermometer was used for temperature measurements, and a turbid meter was used for turbidity determination. According to (APHA), standard methods for the examination of water, the total hardness, nitrate (NO3), and chloride were also analysed. All the results were compared with the World Health Organization (WHO.) Values. The analyses were carried out at the hydraulics and water analysis laboratory at Kaduna polytechnic, Kaduna. GIS is a powerful tool to assess the water quality parameter, determining availability of water, preventing flooding, understanding the natural environment, and managing water resources on a local regional scale (Collet; Uluocha). GIS techniques enable integrate and conjunctive analysis of both Spatial and non – spatial within the same geo-reference (Priti and I.A. Khan). Both the spatial and temporal distribution were carried out using Arc GIS 10.2
UNIT (°C) µs/cm NTU Mg/l Mg/l Mg/l Mg/l Mg/l
WHO 6.5-8.5 25 1200 0-5 500 500 250 6-9 50
software. The software has been used for geo-referencing, vector layer and inverse distance weighted (IDW) analysis. The IDW generated mapping for each parameter which have then used for analysis. MS Excel has been used to encode the data (Mahalingam, Ramu and Magdum). PCA provides information on the most meaningful parameters which describe the whole data set interpretation, data reduction and summarize the statistical correlation among constituents in the water with minimal loss of original information (B. Helena, R. Pardo and M. Vega; D. A. Wunderlin, M. P. Diaz and M. V. Ame). Furthermore, principal component (PC) was carried out on the spatial distribution result using the same software.
Result and Discussion The results of the physicochemical analysis performed have been recorded in Tables 3, 4, 5, and 6.
Table 3: PHYSIOCHEMICAL PARAMETERS FOR JANUARY SAMPLE
LAT
LONG
PH
E CON
TURBIDITY
TEMP
B1
10.67713
6.54114
5.7
180
3.0
27.5
B2
10.67119
6.54842
6.8
190
2.3
B3
10.66221
6.54922
4.5
183
B4
10.66266
6.54187
6.5
220
B5
10.67273
6.53513
6.1
B6
10.67063
6.54043
B7
10.66545
B8
10.64837
TH
TDS
CHLRD
NTR
BOD
250
84
48
0.31
2.2
27.7
341
60
57
0.37
1.3
1.4
27.8
328
45
50
0.28
2.0
4.3
27.6
480
200
170
0.90
2.8
210
4.1
27.9
490
222
165
0.71
2.1
6.3
240
5.3
28.0
485
300
208
0.84
5.0
6.53653
5.9
243
5.0
28.0
487
120
97
0.57
3.5
6.53015
7.1
254
5.9
28.1
399
98
101
0.97
4.1
Table 4: PHYSIOCHEMICAL PARAMETERS FOR FEBRUARY SAMPLE
LAT
LONG
PH
E CON
TURBIDITY
TEMP
TH
TDS
CHLRD
NTR
BOD
B1
10.67713
6.54114
5.6
183
3.2
27.6
243
86
46
0.29
2.4
B2
10.67119
6.54842
6.6
189
2.3
27.7
350
59
54
0.36
1.6
B3
10.66221
6.54922
4.8
181
1.6
27.6
328
47
51
0.26
2.2
B4
10.66266
6.54187
6.8
221
4.4
27.6
480
200
172
0.89
3.0
B5
10.67273
6.53513
6.0
213
4.5
27.8
491
225
168
0.69
2.1
B6
10.67063
6.54043
6.2
239
5.4
27.9
489
298
206
0.86
4.9
B7
10.66545
6.53653
6.0
241
5.3
27.9
489
118
98
0.55
3.8
B8
10.64837
6.53015
6.8
252
6.1
27.9
401
100
103
0.97
4.3
Copyright © 2015 IJTEEE.
INTERNATIONAL JOURNAL OF TECHNOLOGY ENHANCEMENTS AND EMERGING ENGINEERING RESEARCH, VOL 3, ISSUE 10 ISSN 2347-4289
46
Table 5: PHYSIOCHEMICAL PARAMETERS FOR MARCH SAMPLE
LAT
LONG
PH
E CON
TURBIDITY
TEMP
B1
10.67713
6.54114
5.8
185
3.1
27.9
B2
10.67119
6.54842
6.5
190
2.0
27.5
B3
10.66221
6.54922
4.6
182
1.4
B4
10.66266
6.54187
6.7
219
B5
10.67273
6.53513
6.2
B6
10.67063
6.54043
5.9
B7
10.66545
6.53653
B8
10.64837
6.53015
TH
TDS
CHLRD
NTR
BOD
242
85
45
0.29
2.3
347
61
56
0.36
1.4
27.8
327
45
49
0.27
2.0
4.2
27.7
481
201
169
0.91
2.9
211
4.2
27.7
486
221
166
0.70
2.3
241
5.1
28.1
486
301
205
0.84
5.1
6.1
242
5.3
27.9
486
115
101
0.57
4.1
6.8
253
5.8
28.0
403
99
105
0.96
4.5
Table 6: PHYSIOCHEMICAL PARAMETERS FOR APRIL SAMPLE
LAT
LONG
PH
E CON
TURBIDITY
TEMP
B1
10.67713
6.54114
6.0
183
2.9
27.5
B2
10.67119
6.54842
6.4
200
1.8
B3
10.66221
6.54922
4.8
181
B4
10.66266
6.54187
6.6
220
B5
10.67273
6.53513
6.5
B6
10.67063
6.54043
B7
10.66545
B8
10.64837
TH
TDS
CHLRD
NTR
241
84
46
0.29
2.4
27.6
345
62
54
0.34
1.4
1.6
27.8
329
46
51
0.27
2.2
4.2
27.6
480
203
170
0.88
2.8
209
4.4
27.7
485
222
164
0.71
2.1
6.2
243
5.1
27.9
489
301
206
0.84
5.0
6.53653
6.1
242
5.5
27.9
484
111
105
0.59
4.2
6.53015
6.9
253
6.1
28.0
399
97
106
0.95
4.7
TEMPORAL DISTRIBUTION OF SOME PHYSIOCHEMICAL PARAMETERS
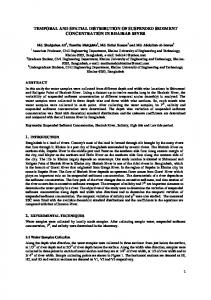
Figure 2: Temporal Distribution of Turbidity
Figure 3: Temporal Distribution of Total Hardness
Copyright © 2015 IJTEEE.
BOD
INTERNATIONAL JOURNAL OF TECHNOLOGY ENHANCEMENTS AND EMERGING ENGINEERING RESEARCH, VOL 3, ISSUE 10 ISSN 2347-4289
Figure 4: Temporal Distribution of Temperature
Figure 5: Temporal Distribution of Total Dissolve Solid
Figure 6: Temporal Distribution of Nitrate
Figure 7: Temporal Distribution of Total pH
Figure 8: Temporal Distribution of Electrical Conductivity Copyright © 2015 IJTEEE.
47
INTERNATIONAL JOURNAL OF TECHNOLOGY ENHANCEMENTS AND EMERGING ENGINEERING RESEARCH, VOL 3, ISSUE 10 ISSN 2347-4289
48
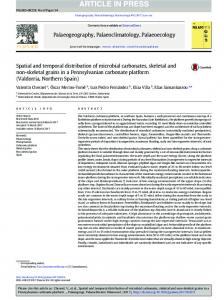
Figure 9: Temporal Distribution of chloride
Figure 10: Temporal Distribution of Biological oxygen Demand Turbidity: January has a range value of 1.40 to 5.95, February has a range value of 1.60 t0 6.10, March has a range value of 1.40 to 5.83, and April has a range value of 1.60 to 6.09 are shows in fig. 2. It clearly show an even distribution, this implies that there is insignificant variation between the period intervals. Nevertheless, in matter of quality nothing is insignificant. Most of the highest value in range are unconformity to WHO Standard. Total Hardness: The standard desirable limit of total hardness of potable water is 500 mg/l according to WHO standard. January has a range value of 250.12 to 489.94, February has a range value of 243.13 to 490.94, March has a range value of 242.12 to 485.97 and April has a range value of 241.12 to 488.97 shows in fig. 3. Consequentially, none of the month reach the desirable limit of the portable water quality. Although, there is insignificant variation between the month. Temperature: January has a range value of 27.10 to 28.12 which recorded the highest value among the period, February has a range value of 27.60 to 27.93, March has a range value of 27.50 to 28.10 and April has a range value of 27.50 to 27.95 (Fig 4). Although, none of the month is below the desirable limit value according to WHO standard (WHO.). Total Dissolve solid: In January it has a range value of 45.00 to 299.95, February has a range value of 47.01 to 297.95 while March has a range value of 45.01 to 300.95 and April has a range value of 46.01 to 300.55. The highest value recorded on March even though it is below WHO standard limit. While the lowest value recorded on February. Nitrate: The result shows that January has a range value of 0.28 to 0.95, February has a range value of 0.26 to 0.96,
March has a range value of 0.27 to 0.96 and April has a range value of 0.27 to 0.95. Therefor the concentration of nitrate is higher on February and March, despite it does not conform to WHO standard. pH: It is one of the most important operational water quality parameters (Patil, Sawant and Deshmukh). In January has a range value of 4.50 to 7.1which recorded the highest value, February has a range value of 4.8 to 6.8, March has a range value of 4.6 to 6.8 and April has a range value of 4.8 to 6.9. Nevertheless, their highest value of the range fall between the WHO standard. This implies that each of the month has an area with above limit of WHO standard (6.5). Electrical Conductivity: The result shows that January has a range value of 180.02 to 251.00, February has a range value of 181.00 to 252.00, March has a range value of 182 to 253.00 and April has a range value of 181.00 to 253.00, (fig. 8), despite the variation between the months none of them reach the limit of WHO standard. Chloride: Fig. 9 show that January has a range value of 48.06 to 208, February has a range value of 46.6 to 206, March has a range value of 45.1 to 205 and April has a range value of 46.1 to 206. These show that the February and April has the highest value of the range while the highest value recorded on January. Furthermore, none of them are conformity with WHO standard. Biological Oxygen Demand (BOD): The difference between March and April is 0.1 in their highest value of the range (March has a range value of 1.4 to 5.1and April has a range value of 1.4 to 5.0). While February has a range value of 1.6 to 4.9 and January has a range value of 1.3 to 5.0 (fig 10). Despite the variation they did not reach the desirable limit value of WHO standard.
Copyright © 2015 IJTEEE.
INTERNATIONAL JOURNAL OF TECHNOLOGY ENHANCEMENTS AND EMERGING ENGINEERING RESEARCH, VOL 3, ISSUE 10 ISSN 2347-4289
49
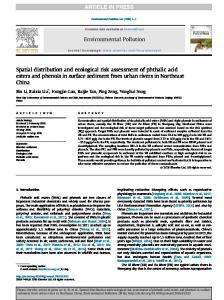
SPATIAL DISTRIBUTION OF SOME PHYSIOCHEMICAL PARAMETERS The spatial distribution of the parameters has been analysed, resulting in the maps shown below (figure 11).
Figure 11: spatial distribution of some physiochemical parameter of water quality Turbidity: The turbidity observed for the borehole range 1.500 to 5.989 NTU. Base on the 4 month analysis High concentration of turbidity was found in SW part of the study area i.e. B8 (Bagoma), followed by B7 (Izala Centre).While area around Unguwan Shiitu (B3) and Science School (B2) experience low concentration of turbidity. Total hardness: Figure 11 show the spatial distribution of the total hardness in the study area and it varies from 244.123 to 487.946. High concentration was observed around B4, B5, B6 and B7 this an area with high residential. This may be due to natural accumulation of salt, or surface runoff, water enter from direct pollution by human activities (Priti and I.A. Khan). Hardness of water causes greasy rings on the bathtubs, film on dishes or hair after washing and poor laundry results. The low concentration was found around B1, B2 and B3 of the study area. Temperature: The temperature observed for the water range 27.625 to 27.9960C.Therefore, spatial distribution of temperature shows that high concentration found around area of B8, B6 and B7 i.e. Bagoma, Izala Centre and Makara Huta. This may be hence indicating the presence of foreign bodies. Pollution from a nearby abattoir, especially B6, may also be responsible for the high values of temperature in the water samples analysed. The low concentration has been observe around B2, B3 and B4. Total dissolved solid (T.D.S.): Total Dissolved Solids (TDS) comprise inorganic salts and small amounts of organic matter that are dissolved in water. TDS in groundwater can also be due to natural sources such as sewage, urban runoff and industrial waste (Priti and I.A. Khan). The spatial distribution of TDS shows that North
West observed high concentration with 299.946 value while the low concentration has been observe in North East of the study area such as B2 and B3 i.e. Science School and Unguwan Shiitu with 45.755mg/l. Nitrate: Nitrate are often an indicator of contamination by human or livestock wastes, excessive may be as a result of fertilizer application to farms, manure, the flowing of domestic sewage or dumping of human animal waste into the main water body source. The values of nitrate in the study areas range from 0.270 to 0.963mg/L. the high concentration was observed around South West of the study area i.e. B8 (Bagoma), centre of the study area i.e. B4 (Imam Road). Low concentration has been found around North East of the study area such as B1, B2 and B3. pH: The pH observed of the study area varies from 4.675 to 6.900. The spatial distribution show that the high concentration was observed in South West of the study area i.e. B8 while the low concentration of the pH found in east part of the study area. Although pH has no direct impact on consumers, it is one of the most important operational water quality parameters (Patil, Sawant and Deshmukh). Electrical Conductivity (E.C): The electrical conductivity was varies from 181.751 to 252.998 in the study area show in figure 11. The high concentration of electrical conductivity has been observe in the south west of the study area i.e. Bagoma (B8). High E.C in water does not have significant effect in human health or risk.
Copyright © 2015 IJTEEE.
INTERNATIONAL JOURNAL OF TECHNOLOGY ENHANCEMENTS AND EMERGING ENGINEERING RESEARCH, VOL 3, ISSUE 10 ISSN 2347-4289
Chloride: High chloride content may harm metallic pipes and the structures as well as growing plants, cause hypertension and increased concentration of other metals in water (WHO.). Chloride ranged from 46.310 to 260.217 mg/l in the study area figure 11. The spatial distribution show that the high concentration was found around North of the study area i.e. B4, B5 and B6 while the low concentration was observed around B1, B2 and B3. Biological oxygen demand (B.O.D): Biological oxygen demand (BOD) is the amount of oxygen consumed by bacteria in the decomposition of organic material. Figure 11 show the spatial distribution of BOD in the study area and it varies from 1.425 to 4.999. The high BOD values recorded from B6 and B8 which could be as a result of discharge of organic waste such as refuse, human and animal excreta, soap etc., into the ground sources, especially b6 where it located around abattoir. While the low concentration was observed around North East of the study area. Principal component Analysis Base on the data analysed on spatial distribution in the Table 7 below show the correlation between the parameters at 0.01 and 0.05 level of significant. The correlation matrix of water quality parameters obtained from study area was examined. It show strong significant correlation between most of the parameters. This indicates that the parameters share a common origin source except pH did not show a significant correlation with temperature, TDS and BOD. Similarly, chloride did not show a significant correlation with Temperature. In order to evaluate the most significant parameters in water quality assessment, the analysis was
50
performed using PCA methodology. PCA was performed in this study to identify important water quality parameters for the 9 variables from 8 different sampling points. An eigenvalue gives a measure of the significance of the factor and factors with the highest eigenvalues are the most significant. Classification of principal components is thus “strong”, “moderate” and “weak”, corresponding to absolute loading values of >0.75, 0.75 - 0.50 and 0.50 - 0.30, respectively (Liu, Li and Shen). Table 8 below, shows nine PCs with their eigenvalue. The PC1 explained that total hardness and total dissolve solid had a moderate positive loading and chloride had weak positive loading with eigenvalue of 1991.6148. Likewise, PC 2 was dominated by total hardness with moderate positive loading and total dissolve solid with moderate negative loading while the electrical conductivity had weak positive loading. PC 3 explained that electrical conductivity had a strong positive loading and total hardness accounted with weak negative loading with an eigenvalue of 69.86074. PC 4 was loaded primarily by TDS with weak positive loading and chloride had strong negative loading. PC 5 was contributed by pH with strong positive loading and BOD with negative moderate loading. PC 6 was responsible for turbidity had strong negative loading. Temperature had weak positive loading, BOD had strong negative loading and pH with weak negative loading in PC7.similarly, PC8 was contributed by temperature with strong positive loading and BOD had weak negative loading. Lastly, PC9 which primarily contributed by nitrate with strong negative loading.
Table 7: CORRELATION MATRIX Layer
TURBIDI TY
TURBIDITY
1
TOTAL HARDNESS TEMPERATUR E
TOTAL HARDNESS
TEMPERATU RE
TDS
0.63303**
1
0.87102**
0.50301*
1
TDS
0.42339**
0.73363**
0.18106
1
NITRATE
0.93112**
0.65608**
0.8108**
0.40039 **
pH
0.75567**
0.35428*
0.52277
0.19989
E CON
0.965**
0.64912**
0.91647**
CHLORIDE
0.61212**
0.88373**
0.39636
BOD
0.92594**
0.54155**
0.92539**
0.3052* * 0.93825 ** 0.32158 **
NITRAT E
pH
E CON
BO D
1 0.76676 ** 0.94362 ** 0.65146 ** 0.87923 **
1 0.74655 ** 0.35909 * 0.59532
1 0.54857 ** 0.94634 **
**Correlation is significant at the 0.01 level (2-tailed), *Correlation is significant at the 0.05 level (2-tailed)
Copyright © 2015 IJTEEE.
CHLORI DE
1 0.52085* *
1
INTERNATIONAL JOURNAL OF TECHNOLOGY ENHANCEMENTS AND EMERGING ENGINEERING RESEARCH, VOL 3, ISSUE 10 ISSN 2347-4289
51
Table 8: Eigenvectors VARIABLE TURBIDITY
PC1
PC2
PC3
PC4
PC5
PC6
PC7
PC8
PC9
0.0101
0.0172
0.0562
0.03077
0.18413
-0.94932
-0.21521
0.09943
0.06475
TOTAL HARDNESS
0.68501
0.56624
-0.43893
0.13195
0.00093
-0.00225
-0.0065
0.00349
-0.00164
TEMPERATURE
0.00061
0.00211
0.00453
0.00327
-0.07771
-0.01257
0.44057
0.88351
0.13811
TDS
0.57325
-0.69659
0.12032
0.41406
-0.00013
0.01188
0.00631
-0.00301
-0.00553
NITRATE
0.00164
0.00302
0.0082
-0.01061
0.04957
-0.04579
0.0175
0.14915
-0.98626
pH
0.00207
0.00519
0.01975
0.00209
0.77552
0.29345
-0.46927
0.29658
0.06204
E CON
0.15887
0.41978
0.8586
0.23424
-0.00159
0.05219
0.05236
-0.03185
-0.00023
CHLORIDE
0.42043
-0.13203
0.22464
-0.86894
-0.00108
-0.01182
-0.00124
0.00056
0.01206
BOD
0.00562
0.01217
0.03969
0.01195
-0.59679
0.08615
-0.73228
0.31351
0.00067
1991.6148
284.20467
69.86074
6.64599
0.04371
0.01558
0.00151
0
0
EIGENVALUES
Systems in Hydrology, . Boston, USA: Kluwer Academic Publishers,, 1996.
Conclusion The temporal distribution show that none of the parameter jis conformity with WHO standard except for temperature and pH. While the spatial distribution of parameters such as turbidity, temperature, pH and chloride, clearly show that some area on the map have desirable limit value of WHO standard. Consequently, the other parameters had not conformity with WHO standard. Most of the parameters are significant correlated with other which show the share origin of the source between them except for pH and chloride with temperature, and TDS with BOD. PCA helped to identify the most significant parameters responsible for water quality distribution does with strong loading are the most important parameters in spatial distribution of water quality parameters followed by those with moderate loading then lastly the weak ones. This study clearly shown that the use of GIS is very useful tool for the assessment of the spatial and temporal distribution of ground water quality (Priti and I.A. Khan; Mahalingam, Ramu and Magdum), and to execute various multivariate analysis.
References [1] Abdulkarim, M. S. and S. Umar. "An Investigation of Natural Radioactivity around Gold Mining Sites in Birnin Gwari North Western Nigeria." Research Journal of Physical Sciences (2013): 20-23. [2] APHA. Standard Methods for the Examination of Water Association. Washington, DC: American Public Health, 2005. [3] Asante, F., et al. "Bioaccumulation of heavy metals in water, sediments and tissues of some selected fishes from the Red Volta of Ghana." British Journal of Applied Science and Technology (2013): 594-803. [4] B. Helena, et al. "Temporal Evaluation of Ground Water Composition in an Alluvial Acquifer (Pisuerga River, Spain) by Principal Component Analysis,." Water Research (2000): 807-816. [5] Collet, C. Geographic Information System Needs and Software in: Geographical Information
[6] D. A. Wunderlin, et al. "Pattern Recognition Techniques for the Evaluation of Spatial and Temporal Variations in Water Quality A Case Study: Suquia River Basin (Cordoba-Argentina)." Water Research (2001): 2881-2894. [7] Deloitte, Akintola Williams. Draft Report On IBP Rural Water Supply Study. Lagos: Deloitte West and Central Africa, Deloitte Touche Tohmatsu, 2006. [8] Liu, W. X., et al. "Multivariate Statistical Study of Heavy Metal Enrichment in Sediments of the Pearl River Estuary." Environmental Pollution (2003): 377-388. [9] Mahalingam, B., et al. "Assessment of Groundwater Quality Using GIS Techniques: A Case Study of Mysore City." International Journal of Engineering and Innovative Technology (IJEIT) (2014): 117-122. [10] Norsaliza, Usali and Hasmadi Ismail Mohd. "Use of Remote Sensing and GIS in Monitoring Water Quality." Journal of Sustainable Development (2010): 228-238. [11] Patil, P.N., D.V. Sawant and R.N. Deshmukh. "physico-chemical parameters for testing of water A review." International Journal of Environmental Sciences (2012): 1194-1207. [12] Priti, Singh and I.A. Khan. "Ground water quality assessment of Dhankawadi ward of Pune by using GIS." INTERNATIONAL JOURNAL OF GEOMATICS AND GEOSCIENCES (2011): 688703. [13] Shittu, O. B, J. O Olaitan and T. S Amusa. "Physico-chemical and Bacteriological Analyses Of Water Used For Drinking and Swimming Purposes
Copyright © 2015 IJTEEE.
INTERNATIONAL JOURNAL OF TECHNOLOGY ENHANCEMENTS AND EMERGING ENGINEERING RESEARCH, VOL 3, ISSUE 10 ISSN 2347-4289
in Abeokota, Nigeria." African Journal Biomedical Research (2008): 258-290.
of
[14] Uluocha, N. O. Elements of Geographic Information Systems. Lagos: Sam Iroanusi Publications, 2007. [15] WHO. Guidelines for Drinking Water Quality. 3. Vol. 1. Geneva: WHO, 2004.
Copyright © 2015 IJTEEE.
52