P D SI M am A 2 J gr 1 ro 20 E P M C
The Journal of Molecular Diagnostics, Vol. 14, No. 3, May 2012 Copyright © 2012 American Society for Investigative Pathology and the Association for Molecular Pathology. Published by Elsevier Inc. All rights reserved. DOI: 10.1016/j.jmoldx.2012.01.009
Assessment of Target Enrichment Platforms Using Massively Parallel Sequencing for the Mutation Detection for Congenital Muscular Dystrophy
C. Alexander Valencia,* Devin Rhodenizer,* Shruti Bhide,* Ephrem Chin,* Martin Robert Littlejohn,* Lisa Mari Keong,* Anne Rutkowski,† Carsten Bonnemann,‡ and Madhuri Hegde* From the Department of Human Genetics,* Emory University School of Medicine, Atlanta, Georgia; Cure CMD and Kaiser Southern California Permanente Medical Group,† Los Angeles, California; and the National Institute of Neurological Disorders and Stroke,‡ the National Institutes of Health, Bethesda, Maryland
Sequencing individual genes by Sanger sequencing is a time-consuming and costly approach to resolve clinically heterogeneous genetic disorders. Panel testing offers the ability to efficiently and cost-effectively screen all of the genes for a particular genetic disorder. We assessed the analytical sensitivity and specificity of two different enrichment technologies, solution-based hybridization and microdroplet-based PCR target enrichment, in conjunction with next-generation sequencing (NGS), to identify mutations in 321 exons representing 12 different genes involved with congenital muscular dystrophies. Congenital muscular dystrophies present diagnostic challenges due to phenotypic variability, lack of standard access to and inherent difficulties with muscle immunohistochemical stains, and a general lack of clinician awareness. NGS results were analyzed across several parameters, including sequencing metrics and genotype concordance with Sanger sequencing. Genotyping data showed that both enrichment technologies produced suitable calls for use in clinical laboratories. However, microdroplet-based PCR target enrichment is more appropriate for a clinical laboratory, due to excellent sequence specificity and uniformity, reproducibility, high coverage of the target exons, and the ability to distinguish the active gene versus known pseudogenes. Regardless of the method, exons with highly repetitive and high GC regions are not well enriched and require Sanger sequencing for completeness. Our study demonstrates the successful application of targeted sequencing in conjunction with NGS to screen for mutations in hundreds of exons in a genetically
heterogeneous human disorder.
( J Mol Diagn 2012, 14: 233-246; DOI: 10.1016/j.jmoldx.2012.01.009)
Next-generation sequencing (NGS) applications can have a tremendous impact on molecular medicine.1 Sequencing whole genomes for personalized medicine may soon become possible with next-generation sequencing applications, such as whole-genome de novo sequencing, transcriptome sequencing, microRNA profiling, and targeted sequencing.2–5 Technological advances have significantly increased the speed and throughput while decreasing the cost for these applications.6 –9 At present, targeted analysis of candidate genes is most suitable for diagnostic applications facilitating functional interpretation of sequence variations and overcoming limitations in computational power.10 DNA diagnostic sequencing of selected genes consists of two steps: an enrichment step and massive parallel sequencing using one of the commercially available NGS platforms. A variety of methods have been developed in the last few years to enrich a selected portion of the genome, including solid phase– based microarrays11–15 and solution phase– based methods, namely, SureSelect (SS).16 These strategies have the ability to enrich for megabase intervals or a full complement of protein-coding exons (exome). An alternative approach has been developed for enrichment of a desired genomic region by a microdroplet-based PCR approach, RainDance Technologies (RDT).17 This technology uses emulsion chemistry to generate millions of microdroplet-based PCR reactions, each representing a single amplification of desired target loci. Each droplet supports an independent PCR and is Supported by grants from NIHRC1NS 069541-01 and MDA G6396330. In addition, this research was supported in part by a Public Health Service grant (UL1 RR025008, KL2 R0025009, or TL1 RR025010) from the Clinical and Translational Science Award Program, NIH, National Center for Research Resources. Accepted for publication January 18, 2012. CME Disclosure: None of the authors disclosed any relevant financial relationships. Supplemental material for this article can be found at http://jmd. amjpathol.org or at doi:10.1016/j.jmoldx.2012.01.009. Address reprint requests to Madhuri Hegde, Ph.D., Whitehead Biomedical Research Building, 615 Michael St., Ste. 301, Atlanta, GA 30322. E-mail:
[email protected].
233
234 Valencia et al JMD May 2012, Vol. 14, No. 3
made to contain a single primer pair, along with the genomic DNA template and other reagents necessary for the PCR reaction. The entire population of droplets represents hundreds to thousands of distinct primer pairs and is subjected to thermal cycling, after which the emulsion is broken, and the PCR products are recovered. The mixture of DNA amplicons can be subjected to shotgun library construction and sequenced by NGS technology. By combining these RDT and SS target enrichment technologies with NGS, they can become important sequencing tools with the potential to be implemented in a clinical diagnostics laboratory. These enrichments methods and NGS technologies are relatively new, and as such, quality control of the sequence data has not yet been well defined. Guidelines will need to be put in place before NGS technology can be used routinely in molecular diagnostics laboratories. Some of the most common heterogeneous genetic disorders for which genetic diagnosis is sought include inherited breast cancer, intellectual disability, ataxia, congenital sensory disorders, and inherited muscle disorders.10 Over the past decade, molecular understanding of the congenital muscular dystrophies (CMDs) has greatly expanded.18 Congenital muscular dystrophy disorders can be classified into four major groups, based on the affected genes and the location of their expressed protein: i) abnormalities of extracellular matrix proteins (LAMA2, COL6A1, COL6A2, and COL6A3); ii) abnormalities of membrane receptors for the extracellular matrix (FKTN, POMGNT1, POMT1, POMT2, FKRP, LARGE, ITGA7, and DAG1); iii) abnormal endoplasmic reticulum protein (SEPN1); and iv) intranuclear envelope protein (LMNA).19 Inheritance patterns range from classic autosomal recessive to de novo dominantly acting mutations (COL6 and LMNA). A specific diagnosis can be challenging because muscle pathology may not yield a definitive diagnosis, and access to and expertise in using immunohistochemical stains is limited. Muscle biopsy and genetic test findings must be interpreted in a clinical context, yet the majority of diagnostic testing is not accompanied by a standard clinical data set. When clinical features are manifested in patients and recognized by clinicians, the proportion of people who have the disease who test positive (clinical sensitivity) for merosindeficient, Ullrich/Bethlem, and Walker-Warburg syndrome CMDs and related CMDs is 100%, 60% to 65%, and 60% to 65%, respectively.20 Mutation screening by conventional Sanger-based DNA sequencing is not a scalable technology in a clinical laboratory setting because of the time requirements to complete an analysis and quality assurance procedures that exponentially increase with genetic complexity.10 The goal of this study was to evaluate the RDT and SS sequence enrichment technologies in conjunction with NGS sequencing by comparing them to each other and to the current gold standard, Sanger sequencing. We selected 12 genes associated with CMDs, which span a 65-kb exonic region (321 exons ⫾ 50 bp on either side of each intron/exon boundary), as the clinical target in this pilot study. Given the genetic complexity and the fact that a specific diagnosis can be challenging, the genes that
make up our CMD panel are ideal for evaluating the effectiveness of these target enrichment methods for clinical applications. In this report, we describe the identification of sequence variants in 12 CMD genes using two target enrichment methods (RDT and SS) and an NGS sequencing platform (SOLiD 3; Life Technologies, Grand Island, NY) under optimized conditions, and we discuss our findings in light of the validation and clinical laboratory implementation of these enrichment approaches.
Materials and Methods Patients All development was performed at the Emory Genetics Laboratory, which is a Clinical Laboratory Improvement Amendments and College of American Pathologists–accredited high-complexity laboratory. To demonstrate that NGS data could be used to identify different types of mutations, five positive control samples (C11, C12, C13, C14, and C15) whose mutations had previously been identified by Sanger sequencing of CMD panel genes were included in the analysis. The CMD comprehensive panel that consisted of Sanger sequencing COL6A1, COL6A2, COL6A3, FKRP, FKTN, ITGA7, LAMA2, LARGE, POMGNT1, POMT1, POMT2, and SEPN1 was performed on sample C12. The Bethlem Myopathy/Ullrich CMD sequencing panel was performed (Sanger sequencing of COL6A1, COL6A2, and COL6A3) on samples C11 and C13. Moreover, the merosin-deficient CMD Type 1A (MDC1A) sequencing panel (Sanger sequencing of LAMA2) was performed on sample C14. Similarly, the muscle-eye-brain disease sequencing panel was performed (Sanger sequencing of POMGNT1) on sample C15. Furthermore, a normal control sample (wild-type, W16) known to lack any mutations was added to the sample list. In addition to the six control samples, six patients with CMD phenotypes were selected from the cohort of families collected by Dr. Carsten Bonnemann (National Institutes of Health, Bethesda, MD) under an approved institutional review board from the Children’s Hospital of Philadelphia, and written informed consent was obtained for all patients. In all families, the affected members suffered from an underlying muscular dystrophy. The underlying gene mutations had not been identified for three patients, whereas the mutations were known for three patients, and these represented our blinded sample set.
Microdroplet-Based PCR Primer Design A list of the 12 CMD genes was provided to RainDance Technologies (Lexington, MA), and they designed a custom CMD panel using their custom primer design pipeline based on the Primer3 algorithm (http://frodo.wi.mit. edu/primer3). The custom panel was prepared, and primers were designed to target all 321 coding exons (383 amplicons) of these 12 genes, including 50 bp of intronic sequence flanking each exon in the design. The amplicons in the panel ranged in size from 200 to 600 bases, with a GC content of 25% to 87%, and repre-
NGS in Muscular Dystrophy Diagnostics 235 JMD May 2012, Vol. 14, No. 3
sented a total coding sequence of 65 kb. All single nucleotide polymorphisms (SNPs) and repeat regions were filtered from the primer selection region. The RDT design was quality checked in our laboratory to ensure that none of the primers were designed over known SNPs (dbSNP build 130) using an in-house Perl script against the National Center for Biotechnology Information SNP database. Primers were also verified to avoid repetitive regions of the genome using the program RepeatMasker (http://www.repeatmasker.org). The primers for the 383 amplicons varied in annealing temperature from 57°C to 60°C, with a primer length range of 15 to 22 bases. Other rules for primer design included BLASTing the primers to the chromosome that had the gene of interest and in silico PCR, using the UCSC Genome Browser, to match the designed primers to the PCR product sequence and size for the gene of interest.
Microdroplet-Based PCR The samples were fragmented to 3 to 4 kb by shearing the genomic DNA with the Covaris S2 instrument (Covaris, Woburn, MA) following the manufacturer’s instructions. To prepare the input DNA template mixture for targeted amplification, 3 g of the purified genomic DNA fragments were added to 4.7 L of High-Fidelity buffer (Invitrogen, Carlsbad, CA), 1.26 L of magnesium sulfate (Invitrogen), 1.6 L of 10 mmol/L dNTP (Invitrogen), 3.6 L of 4 mol/L betaine (Sigma-Aldrich, St. Louis, MO), 3.6 L of Droplet Stabilizer (RainDance Technologies, Lexington, MA), 1.8 L of dimethyl sulfoxide (Sigma-Aldrich), and 0.7 L of 5 units/L of Platinum High-Fidelity Taq (Invitrogen). The samples were brought to a final volume of 25 L with nuclease-free water. PCR droplets were generated on the RDT1000 instrument (RainDance Technologies). The CMD panel consists of an emulsion that contains a collection of unique primer droplets in which each primer droplet contains a single matched forward and reverse primer for each amplicon in the panel. Each panel contains multiple replicates of each unique primer droplet. Careful control is achieved in the manufacture of each panel to ensure that the volume of each droplet is consistent. This ensures that the concentration of the forward and reverse primers are consistent across all PCR reactions. Furthermore, the manufacture of each panel allows the counting of each unique primer droplet so that the representation of each unique primer droplet is consistent within the panel. This ability to uniformly represent each primer droplet within each panel allows a uniform representation of each PCR reaction per sample, resulting in low bias between all of the amplicons in the panel. The RDT1000 generates a PCR droplet by pairing a single genomic DNA template droplet with a single primer droplet. The paired droplets flow past an electrode that is embedded in the chip and are instantly merged to create a single PCR droplet. All of the resulting PCR droplets are dispensed as an emulsion into a PCR tube and then transferred to a standard thermal cycler for PCR amplification. Each single sample generates more than 1,000,000 singleplex PCR droplets. Samples were cycled in an Applied Biosystems (Foster City, CA) Gene-
Amp 9700 thermocycler as follows: initial denaturation at 94°C for 2 minutes; 55 cycles at 94°C for 15 seconds, 54°C for 15 seconds, 68°C for 30 seconds; final extension at 68°C for 10 minutes, and a 4°C hold. After PCR amplification, the emulsion was broken to release each individual amplicon from the PCR droplets. For each sample, an equal volume of Droplet Destabilizer (RainDance Technologies) was added to the emulsion of PCR droplets, the sample was vortexed for 15 seconds, and spun in a microcentrifuge at 13,000 ⫻ g for 5 minutes. The oil below the aqueous phase was carefully removed from the sample. The remaining sample was purified using a MinElute column (Qiagen, Valencia, CA) following the manufacturer’s recommended protocol. The purified amplicon DNA was then tested on an Agilent Bioanalyzer (Agilent Technologies, Santa Clara, CA) to confirm that the amplicon profile (mixture of all amplicons of sizes ranging from 200 to 929 bp) matched the expected amplicon profile.
Microdroplet-Based PCR Amplicon Concatenation and Shearing The ends of the amplicons were blunt-end repaired by adding the reagents to the purified DNA (diluted to 68 L): 10 L of 10⫻ blunting buffer (Epicenter, Madison, WI), 10 L of 2.5 mmol/L dNTP Mix (Invitrogen), 10 L of 10 mmol/L ATP, 2 L of End-It enzyme mix (Epicenter, Madison, WI), and sterile water to a total reaction volume of 100 L. The reaction was incubated at room temperature for 30 minutes, and the DNA was immediately purified using Ampure XP beads (Agencourt, Danvers, MA). The amplicons were subsequently concatenated using the NEB Quick Ligation kit according to the manufacturer’s protocol. DNA was purified using Ampure XP beads and eluted in 105 L of low TE buffer. An Agilent Technologies 7500 Bioanalyzer chip was run to confirm the concatenation of PCR products. The sample was fragmented as described in the standard SOLiD workflow.
SureSelect Probe Design and Synthesis The biotinylated-cRNA probe solution was manufactured by Agilent Technologies and was provided as capture probes. The sequences corresponding to the 12 CMD genes (321 exons) were uploaded to the Web-based probe design tool, eArray.21 The coordinates of the sequence data in this study are based on NCBI Build 36.1 (UCSC hg18). The following parameters were chosen for the probe design: 120-bp capture-probe length, 20⫻ capture-probe tiling frequency, a 20-bp allowed overlap, and avoidance of repetitive regions. In total, 54,420 probes were designed, synthesized on a wafer, subsequently released off the solid support by a selective chemical reaction, PCR-amplified through universal primers attached on the probes, and then amplified and biotin-conjugated by in vitro transcription.16
236 Valencia et al JMD May 2012, Vol. 14, No. 3
Table 1.
Mapping Data of Reads Obtained Following Sequence Enrichment
Patient no. C11 C12 C13 C14 C15 W16 1 3 7 8 9 10 Ave. ⫾ SD Ave. ⫾ SD
Targeted method
High-quality reads (n)
Mapped to human genome (%)
On target (%)
Mean read length, (bases)
Bases covered for ROI (5⫻) (%)
Bases covered for ROI (20⫻) (%)
RDT SS RDT SS RDT SS RDT SS RDT SS RDT SS RDT SS RDT SS RDT SS RDT SS RDT SS RDT SS RDT SS
209,312 456,576 338,596 589,792 265,206 585,719 162,715 364,716 343,911 408,524 482,435 358,043 461,154 219,550 526,152 533,999 328,037 536,653 558,078 433,943 237,236 223,520 712,674 325,952 385,459 ⫾ 164,064 419,749 ⫾ 127,594
57 60 57 57 56 55 53 48 55 56 57 60 53 51 55 54 51 53 55 58 43 46 54 56 54 ⫾ 4 55 ⫾ 4
36 18 36 19 35 18 29 14 38 16 31 17 38 18 35 23 37 17 36 20 29 14 36 16 35 ⫾ 3 18 ⫾ 3
47 47 47 47 47 47 47 47 47 47 47 47 46 47 47 47 46 47 47 47 47 47 47 47 47 ⫾ 0 47 ⫾ 0
88 96 88 96 88 96 87 96 88 96 87 96 88 95 89 96 88 96 88 96 88 96 89 96 88 ⫾ 1 96 ⫾ 0
86 95 87 95 87 96 84 95 87 95 86 95 87 94 88 95 87 94 87 95 86 94 88 95 87 ⫾ 1 95 ⫾ 1
Reads were obtained from RainDance Technologies and SureSelect sequence enrichment of human genomic DNA samples for congenital muscular dystrophy target regions using a SOLiD sequencing platform. Ave., average; C, positive control samples; RDT, RainDance Technologies; ROI, region of interest; SS, SureSelect; W, wild-type sample.
Genomic DNA Fragment Library for SureSelect Genomic DNA fragment libraries were prepared according to the manufacturer’s instructions (Agilent Technologies). Briefly, 3 g of each genomic DNA was fragmented by Adaptive Focused Acoustics (Covaris S2; Covaris), resulting in fragmentation of the genomic DNA to a size range of 150 to 180 bp. After end repair, the SOLiD barcoding adaptors were ligated and the libraries cleaned up using Ampure XP beads. A high-sensitivity bioanalyzer chip was run to ensure that ligation was successful. Each fragment library was nick-translated and enriched by a PCR amplification step. The PCR-amplified fragment libraries were quantified by a NanoDrop (ND1000; NanoDrop Technologies, Wilmington, DE).
of the PCR plate and incubated at this temperature for at least 5 minutes. The capture library mix was added to the “C” row in the PCR plate and incubated for 2 minutes at 65°C. The hybridization mixture was added to the capture probes, followed by the addition of the DNA fragment library. The solution hybridization was performed for 24 hours at 65°C. After the hybridization, the captured targets were selected by pulling down the biotinylated probe/target hybrids by using streptavidin-coated magnetic beads (Dynal DynaMag-2; Invitrogen). The magnetic beads were
SureSelect Solution-Based Hybridization and Target Enrichment The target-enrichment step for each sample was performed according to the manufacturer’s instructions (Agilent Technologies). Briefly, in a 96-well PCR plate, the capture probes were mixed with RNase block solution and kept on ice in a separate PCR plate; 500 ng of each genomic DNA-fragment library (“B” row) was mixed with SureSelect Block Mix and transferred into the B row, heated for 5 minutes at 95°C, and held at 65°C thereafter in the thermocycler GeneAmp PCR System 9700 thermocycler (Applied Biosystems). While maintaining the plate at 65°C, hybridization buffer was added into the “A” row
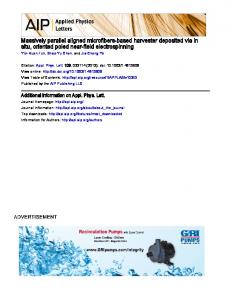
Figure 1. Average gene coverage among all of the congenital muscular dystrophy genes following RainDance and SureSelect target enrichment and next-generation sequencing.
NGS in Muscular Dystrophy Diagnostics 237 JMD May 2012, Vol. 14, No. 3
Table 2.
Common and Unique Exons with Consistently Low Coverage across All RDT and SS Samples RDT
SS
RDT and SS
Gene
Exon #
%GC
Gene
Exon #
%GC
Gene
Exon #
%GC
COL6A1 COL6A1 COL6A1 COL6A1 COL6A1 COL6A1 COL6A2 COL6A2 COL6A2 COL6A2 COL6A2 COL6A2 COL6A2 COL6A2 COL6A2 COL6A3 COL6A3 FKTN FKTN ITGA7 ITGA7 LAMA2 LAMA2 POMT2 POMT2 SEPN1
5 12 24 30 34 35 3 6 7 14 16 22 24 26 27 13 15 6 7 15 25 27 47 9 10 6
65 67 68 59 50 67 65 65 64 68 71 73 63 62 59 48 63 41 45 62 66 36 43 62 40 87
LAMA2 SEPN1
53 3
33 58
COL6A1 LAMA2 LAMA2 SEPN1 POMT1 POMT1 POMT1 POMT1 POMT1 POMT1 POMT1 POMT1 POMT1 POMT1 POMT1 POMT1 POMT1 POMT1 POMT1 POMT1 POMT1 POMT1 POMT1
1 1 44 1 2 3 4 5 6 7 8 9 10 11 12 13 14 15 16 17 18 19 20
73 71 17 87 60 45 39 59 40 56 57 55 59 51 67 57 49 67 64 59 57 61 55
Coverage was ⬍20⫻ average. %GC, percent GC content.
prepared by washing 3 times and resuspending in binding buffer [1 mol/L NaCl, 1 mmol/L EDTA, and 10 mmol/L Tris-HCl (pH 7.5)]. The captured target solution was added to the beads and rotated for 30 minutes at room temperature. The beads/captured targets were pulled down by using a magnetic separator (DynaMag-Spin; Invitrogen), removing the supernatant, resuspending in wash buffer #1 (Agilent Technologies), and incubating for 15 minutes at room temperature. The beads/captured probes were pulled down with the magnetic separator and washed by resuspension and incubation for 10 minutes at 65°C in wash buffer #2. After three warm washes, elution buffer (0.1 mol/L NaOH) was added and incubated for 10 minutes at room temperature. The eluted captured targets were transferred to a tube containing neutralization buffer [1 mol/L Tris-HCl (pH 7.5)] and desalted with the MinElute PCR Purification Kit (Qiagen). Finally, the targets were enriched by 20 to 30 cycles of PCR amplification by using 5 L per sample as a template, and the amplified targets were purified by Ampure XP beads. The samples were processed by the standard SOLiD workflow.
Variant Annotation and Identification of Causative Mutations SNP and indel information was extracted from the alignment data using the NextGENe (Softgenetics, State College, PA) software. Analysis was limited to ⫾20 bp on either side of each exon. Additional custom filtering criteria were imposed to minimize the false-positive rates.
Variants were filtered first for those that are novel (not present in dbSNP or the 1000 Genomes databases) and for those that are likely deleterious. We predicted that damaging SNPs would be novel silent, missense, nonsense, or splice-site SNPs, whereas damaging indels would be in coding regions. The variants that met these criteria were used for downstream analysis. Specifically, a large list of variants were identified by NGS; however, variants with ⬍20⫻ coverage (coverage is the average number of reads representing a given nucleotide in the reconstructed sequence) were removed from the list to be Sanger sequence confirmed, unless a variant was listed in the Human Gene Mutation Database as a frameshift or a nonsense change. In addition, variants with high frequency were also removed, but Human Gene Mutation Database, frameshift, and nonsense changes were kept. Similarly, synonymous coding variants previously found in the normal population were removed from the list. There were examples of variants in exons with ⬍20⫻ coverage that were selected for confirmation based on the likelihood of being real changes as indicated by the allele percentage (the percentage of a nucleotide at a specific location given by NextGENe visual sequence output; for a heterozygote and a homozygote, a 50%:50% and ⬎90% allele percentage is expected, respectively) and Phred-like sequencing quality score (q), defined as q ⫽ ⫺10log10(p), where p ⫽ error probability for the base (ie, if q ⫽ 20 and P ⫽ 0.01, then the error rate is 1 in 100) at that site. Finally, all variants that met all of the specified criteria were Sanger sequence confirmed.
238 Valencia et al JMD May 2012, Vol. 14, No. 3
Table 3.
Number of Sequence Variants Identified by RainDance Technologies and SureSelect Using Filtered Data to Minimize the FalsePositive Rates
Patient no. C11 C12 C13 C14 C15 W16 1 3 7 8 9 10 Ave. ⫾ SD Ave. ⫾ SD
Targeted method
Total NGS variants*
Variants missed by NGS†
Sanger variants‡
False positive (%)
RDT SS RDT SS RDT SS RDT SS RDT SS RDT SS RDT SS RDT SS RDT SS RDT SS RDT SS RDT SS RDT SS
8 (8) 9 (16) (53) (43) 6 (14) 12 (19) 7 (4) 16 (7) 20 (6) 23 (4) 21 17 18 16 15 21 17 22 24 11 15 20 20 18 16 ⫾ 6 (17 ⫾ 20) 17 ⫾ 5 (18 ⫾ 15)
7 (6) 7 (6) (5) (5) 5 (7) 4 (2) 15 (1) 9 (0) 11 (0) 11 (0) 12 11 10 9 6 5 9 6 6 7 18 15 8 8 10 ⫾ 4 (4 ⫾ 3) 8 ⫾ 3 (3 ⫾ 3)
7 (5) 7 (12) (39) (37) 4 (12) 5 (18) 5 (4) 9 (5) 13 (4) 12 (4) 8 10 8 7 8 9 11 10 14 12 8 10 12 13 9 ⫾ 3 (13 ⫾ 15) 9 ⫾ 2 (20 ⫾ 24)
(37) (25) (26) (30) (14) (5) (0) (13) (33) (0) NA NA NA NA NA NA NA NA NA NA NA NA NA NA (22 ⫾ 15) (15 ⫾ 13)
No. of exons with ⬍20⫻ coverage 94 30 93 27 87 22 186 38 92 45 106 55 76 61 79 25 94 82 74 29 146 107 65 45 100 ⫾ 36 49 ⫾ 26 (table continues)
The bold numbers indicate the sequence variants that were identified by RainDance Technologies and SureSelect next-generation sequencing using filtered data to minimize the false-positive rates. The filtering criteria were applied to RDT and SS data on the blinded and positive control samples. The numbers in parentheses are the number of variants identified using unfiltered RDT and SS data to confirm previously identified Sanger method variants in positive control samples only. *Total number of variants identified following each enrichment method and next-generation sequencing. † Total number of variants identified by Sanger sequencing and missed by NGS because such data was filtered by the criteria described in Materials and Methods. ‡ Total number of variants identified by next-generation sequencing that were confirmed by Sanger sequencing. Ave., average; C, positive control samples; EX, exonic variants; False pos. (%), false-positive percentage; INT, intronic variants; N-SNP, non-SNP variants; N-SNP EX, non-SNP exonic variants; N-SNP INT, non-SNP intronic variants; W, wild-type normal sample.
Validation of Mutations and Polymorphisms by Sanger Sequencing Primers were designed to amplify each exon, including 50 bp of flanking intronic regions of LAMA2, COL6A1, COL6A2, COL6A3, FKTN, POMGNT1, POMT1, POMT2, FKRP, LARGE, ITGA7, and SEPN1. Samples were prepared by fluorescence sequencing on the ABI 3730XL DNA analyzer with BigDye Terminator chemistry and the BigDye XTerminator purification kit (Applied Biosystems).
Results A total of 12 samples were evaluated in this comparative study. Five positive control samples were chosen to have different types of CMD-causing mutations to evaluate the ability of the target enrichment methods to identify different types of sequence variations. In addition, a wild-type sample was included to serve as a normal control reference. Moreover, six blinded samples were examined by NGS to identify the underlying mutation(s) responsible for the clinical features de-
scribed for each patient and to evaluate each method for its diagnostic potential.
RDT and SS Enrichment Strategies Demonstrate Similar Sequencing Coverage and Genome Mapping A single run on the SOLiD produced a read average of 385,459 and 419,749 for RDT and SS, respectively, with no statistically significant difference between the two enrichment methods (Table 1). RDT and SS samples had a similar average percentage mapped to the genome, namely, 54% and 55%, respectively. However, on average, a higher percentage of the RDT reads mapped to the target region relative to the SS reads. A range of 29% to 38% of RDT and 14% to 23% of SS unique reads mapped to the targeted regions, percentages that are consistent with other studies.17,22 Approximately 96% of the region of interest had at least a 5⫻ coverage in the SS samples compared to 88% of the RDT samples. Similarly, 95% of the region of interest had at least 20⫻ coverage in the SS samples and lower in the RDT samples (87%).
NGS in Muscular Dystrophy Diagnostics 239 JMD May 2012, Vol. 14, No. 3
Table 3.
Continued
INT
EX
SNP
N-SNP
N-SNP INT
N-SNP EX
0 (3) 0 (3) (17) (24) 2 (5) 1 (7) 1 (3) 2 (3) 5 (1) 3 (1) 3 5 7 8 5 5 5 5 8 9 3 3 7 7 4 ⫾ 3 (6 ⫾ 6) 4 ⫾ 3 (8 ⫾ 9)
8 (5) 9 (13) (36) (38) 4 (9) 11 (12) 6 (1) 14 (4) 15 (5) 20 (3) 18 12 11 8 10 16 12 18 16 18 12 17 13 11 11 ⫾ 4 (11 ⫾ 14) 14 ⫾ 4 (14 ⫾ 14)
7 (6) 7 (12) (44) (41) 4 (12) 5 (15) 5 (4) 8 (4) 12 (2) 23 (2) 6 5 8 8 12 13 8 10 11 12 8 11 13 12 9 ⫾ 3 (14 ⫾ 17) 10 ⫾ 515 ⫾ 16
1 (2) 2 (4) (9) (21) 2 (2) 7 (4) 2 (0) 6 (3) 8 (4) 7 (2) 15 12 10 8 3 8 9 12 13 15 7 9 7 6 7 ⫾ 5 (4 ⫾ 3) 8 ⫾ 4 (7 ⫾ 8)
0 (0) 0 (0) (3) (8) 1 (0) 0 (1) 0 (0) 0 (0) 2 (1) 0 (1) 2 4 4 6 2 1 1 0 4 27 1 0 1 1 2 ⫾ 1 (1 ⫾ 1) 4 ⫾ 8 (2 ⫾ 3)
1 (2) 2 (4) (6) (13) 1 (2) 7 (3) 2 (0) 6 (3) 6 (3) 10 (1) 13 8 6 2 1 7 8 12 9 4 6 9 6 5 5 ⫾ 4 (3 ⫾ 2) 7 ⫾ 3 (5 ⫾ 5)
Sequence Coverage and GC Content of Target Region The target sequence complexity has a strong effect on the efficiency of DNA amplification and capture for individual exons. The mean gene depth was similar between the RDT and SS samples (Figure 1). The mean gene depth of coverage across all RDT samples ranged from 0⫻ for POMT1, to 108⫻ for POMGNT1, with an average of 51 ⫾ 28⫻ across all genes. By contrast, the mean gene depth of coverage across all SS samples ranged from 2⫻ for POMT1, to 87⫻ for LARGE, with an average of 53 ⫾ 22⫻ across all genes. In some instances, RDT enriched certain genes, namely, POMGNT1 and POMT2, better than SS (Figure 1). The opposite is also true: SS enriched LARGE better than RDT. Despite the high mean gene-read depth and target region coverage, several exons, including exon 1 of COL6A1, exon 1 of LAMA2, exon 1 of SEPN, and all exons of POMT1, had low average coverage in both RDT and SS runs (see Supplemental Figures S1–S4 at http://jmd. amjpathol.org and Table 2). In addition, a closer examination showed that the first coding exons were poorly covered (see Supplemental Figures S1–S12 at http://
jmd.amjpathol.org). All of the exons of POMT1 failed due to the average percent GC content of 56%, and several exons have a percent GC content ⬎60%. Interestingly, 26 exons of the 321 targeted exons (8%) had low coverage in RDT compared to 2 exons (0.8%) in SS samples (Table 2).
Variant and Mutation Identification in Control Samples The Sanger method is considered by the clinical laboratory community as the gold standard for sequencing. To validate the enrichment methods, we compared the variant calls obtained by Sanger sequencing to those obtained by NGS using five control samples with known mutations and one wild-type normal control as follows: 1. Sample C11: COL6A1, COL6A2, and COL6A3 sequenced for Bethlem myopathy/Ullrich CMD panel; 2. Sample C12: LAMA2, COL6A1, COL6A2, COL6A3, FKTN, POMGNT1, POMT1, POMT2, FKRP, LARGE, and ITGA were sequenced for CMD comprehensive panel; 3. Sample C13: COL6A1, COL6A2, and COL6A3 were sequenced for Bethlem myopathy/Ullrich CMD panel;
240 Valencia et al JMD May 2012, Vol. 14, No. 3
Table 4. Patient no. C11 C12
C13
C14 C15 W16 1 3 7 8 9
10
Detection of Variants and Mutations Following Target Enrichment Gene
Exon/ intron
Mutation
COL6A1 COL6A2 COL6A2 COL6A1 FKTN LAMA2 LAMA2 SEPN1 SEPN1 SEPN1 SEPN1 COL6A1 COL6A1 COL6A2 COL6A3 LAMA2 LAMA2 POMGNT1 POMGNT1
30 23 28 29 9 14 39 5 11 13 3=UTR 26 33 24 38 22 47 7 17
COL6A3 COL6A2 LAMA2 COL6A3 COL6A1 LAMA2 LAMA2 COL6A1 COL6A2 COL6A2 COL6A3 LARGE SEPN1 COL6A1
14 22 27 1 6 24 43 21 26 22 41 15 12 14
Amino acid change/ consequence (frameshift/del)
Status (Homo/Het)
c.1931G⬎A c.1770G⬎A c.2994C⬎T IVS29-8G⬎A IVS9-40C⬎A c.2084C⬎T c.5614G⬎T IVS5⫹39C⬎T IVS11-31C⬎T c.1645G⬎A c.1773⫹44G⬎T IVS26⫹50C⬎T c.2424G⬎T IVS24-3dupC IVS38-34C⬎T c.3154A⬎G c.6617delT c.636C⬎T IVS17⫹1G⬎A
p.R644Q p.T590 p.H998
Het Het Het Het Het Het Het Het Het Het Het Het Het Het Homo Het Het Het Het
IVS14-8del29 IVS22⫹4G⬎A c.4010A⬎G c.53C⬎A IVS6-18CC⬎T c.3412G⬎A IVS43⫹5G⬎C IVS21-2A⬎G c.2039G⬎A IVS22⫹4G⬎A c.9206C⬎T c.1949G⬎A c.1506C⬎A IVS14⫹1G⬎A
Del
p.D695V p.D1872Y p.V549M p.Q808H p.S1052G frameshift p.F212
p.H1337R p.A18X p.V1138M p.R680H T3069I p.R650Q p.N502K
Het Het Het Homo Het Het Het Het Het Het Het Het Homo Het (table continues)
Target enrichment achieved by RainDance Technologies and SureSelect in combination with next-generation sequencing. Out-of-frame deletion mutation predicted to result in a premature translation stop. This change is of the type predicted to cause disease. *It is possible for silent changes to disrupt RNA splicing. † Mutation and/or variant of unknown clinical significance not detected because the bioinformative algorithm set to detect ⫾20 bases from exon/intron boundaries. ‡ This mutation has been reported in individuals with MEB disease. § This mutation results in a G to A change in the consensus donor site of the exon 17/intron 17 boundary and is predicted to result in aberrant splicing of POMGNT1 RNA. This mutation has been reported in individuals with MEB disease. ⫹, present; ⫺, not present; C, positive control samples; Del, deletion; Het, heterozygous change; Homo, homozygous change; MEB, muscle-eye-brain; Mut, mutation; UTR, untranslated region; VUS, variant of unknown clinical significance, pending functional analysis for reclassification; W, wild-type sample.
4. Sample C14: LAMA2 was sequenced for CMDC1A panel; 5. Sample C15: POMGNT1 was sequenced for the muscle-eye-brain panel; 6. Sample W16: wild-type control. Different sets of genes were sequenced for the control samples because, traditionally, the clinical features of the patients were used to determine which genes should be pursued. Specifically, we sequenced the five positive controls, which encompass a variety of variants, such as deletions (sample C14), duplications (samples C12 and C13), missense (sample C11), and splicing changes (sample C15), post-RDT or SS enrichment using the SOLiD platform and the Sanger method (Table 3). NGS identified a large number of sequence variants within our targeted regions of the controls with ⬍100% concordance to Sanger sequencing results (Table 3). The NGS-identified variants of the positive control sam-
ples were generated by using the unfiltered RDT and SS data, so that it would be a true variant number comparison between the enrichment methods and Sanger sequencing. After a close examination of parameters such as coverage, allele percentage, and Phred-like score, the false-positive rate (Table 3) decreased significantly by eliminating variant calls with low probability of being true positives. On average, the false-positive rate of the two methods, RDT (22% ⫾ 15%) and SS (15% ⫾ 13%), was not statistically different. However, in several cases, the RDT false-positive rate was lower than the SS rate, such as in sample C14. By contrast, false-negative variants not detected by the RDT NGS were often in exons with poor sequence coverage (⬍20⫻) and high GC content. For example, exon 22: IVS22⫹4G⬎A, change in COL6A2 was not observed using the RDT data due to 0⫻ coverage and 73% GC content (Tables 2 and 4). However, this change was confirmed by Sanger sequencing.
NGS in Muscular Dystrophy Diagnostics 241 JMD May 2012, Vol. 14, No. 3
Table 4.
Continued
RDT detected
RDT mutation coverage
SS detected
SS mutation coverage
Sanger confirmed
⫺ ⫹ ⫹ ⫹ ⫺ ⫹ ⫹ ⫺ ⫺ ⫹ ⫺ ⫺ ⫹ ⫺ ⫺ ⫹ ⫺ ⫹ ⫹
11 8 20 7 ⫺ 82 29 ⫺ ⫺ 78 ⫺ ⫺ 8 8 ⫺ 17 1 34 105
⫹ ⫺ ⫹ ⫹ ⫺ ⫹ ⫹ ⫺ ⫺ ⫹ ⫺ ⫺ ⫹ ⫹ ⫺ ⫹ ⫹ ⫹ ⫹
66 20 42 34 ⫺ 63 88 ⫺ ⫺ 159 ⫺ ⫺ 17 162 ⫺ 40 75 30 73
⫹ ⫹ ⫹ ⫹ ⫹ ⫹ ⫹ ⫹ ⫹ ⫹ ⫹ ⫹ ⫹ ⫹ ⫹ ⫹ ⫹ ⫹ ⫹
VUS VUS* VUS* VUS VUS† VUS VUS VUS† VUS† VUS VUS† VUS† VUS VUS VUS† VUS Del mut Splicing mut‡ Splicing mut§
⫹ ⫹ ⫹ ⫹ ⫹ ⫹ ⫹ ⫺ ⫹ ⫺ ⫹ ⫹ ⫹ ⫹
87 44 10 111 66 66 66 ⫺ 8 ⫺ 26 10 26 19
⫺ ⫹ ⫹ ⫹ ⫹ ⫹ ⫹ ⫺ ⫹ ⫹ ⫹ ⫹ ⫹ ⫹
⫺ 137 32 35 122 132 15 ⫺ 22 26 15 49 17 14
⫹ ⫹ ⫹ ⫹ ⫹ ⫹ ⫹ ⫹ ⫹ ⫹ ⫹ ⫹ ⫹ ⫹
Del mut
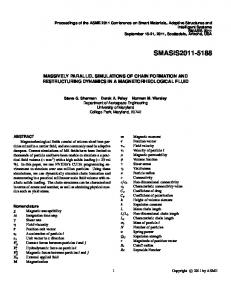
High coverage along with high uniformity and specificity render target enrichment methods suitable for the reliable detection of different types of sequence variants in positive control samples. RDT and SS in combination with NGS correctly identified most variants of unknown clinical significance and mutations in the positive control samples (C11 to C15), except for changes whose coverage was too low (Table 4 and Figure 2, A and B). Deep intronic variants were not detected because we limited the custom set of sequence analysis to ⫾20 bp on either side of each exon. Examples of mutations detected by all three methods include a POMGNT1splice site change in sample C15, one copy of IVS17⫹1G⬎A in intron 17 (Figure 2A and Table 4), and a missense change detected in sample C12 LAMA2, one copy of c.2084C⬎T (p.D695V) in exon 14 (Figure 2B). By contrast, changes that were found in one data set but not the other include: c.1931G⬎A (p.R644Q) in IVS24-3dupC in COL6A1 and c.6617delT in LAMA2 not detected in RDT samples
Notes
Possibly damaging Nonsense mut Mut-HGMD
Splicing mut
C11 and C14, respectively, but that were found in the corresponding SS samples. Conversely, one change, c.1770G⬎A (p.T590) in exon 23 of COL6A2, was identified in the RDT data of sample C11, but not in the SS data of the same sample. The missed changes in the RDT data may be explained by the coverage being too low at these sites, which is a likely consequence of high GC content.
Variant Types Detected by NGS in Blinded Samples RDT and SS in combination with NGS permitted the detection of different types of variants in the six blinded control samples, and a significant proportion of such variants were confirmed by Sanger sequencing (Table 3; see Materials and Methods for filtering data criteria). The types of identified variants were exonic and intronic vari-
242 Valencia et al JMD May 2012, Vol. 14, No. 3
Figure 2. Types of variants detected in RainDance and SureSelect samples that were Sanger sequence confirmed. A: Example of splice site mutation of sample C15. One copy of an IVS17⫹1G⬎A splice site mutation in intron 17 of POMGNT1 was detected by Sanger sequencing, RainDance, and SureSelect data. Arrows, splice site mutation. B: Example of missense mutation detected in sample C12. One copy of c.2084C⬎T (p.D695V) missense mutation in LAMA2 was observed in Sanger sequencing, RainDance, and SureSelect data. Arrows, missense mutation.
ants and SNP and non-SNP variants. Examples of missense, deletion, nonsense, splice site alteration, and duplication changes that we found in our data are c.4010A⬎G (p.H1337R) in LAMA2 (sample 3), IVS148del29) in COL6A3 (sample 1), c.53C⬎A (p.A18X) in
Table 5.
COL6A3 (sample 7), IVS14⫹1G⬎A in COL6A1 (sample 10), and IVS24-3dupC in COL6A2 (sample C14). The total number of RDT variant calls in the blinded control samples varied from 6 to 24, and approximately 60% of the calls were Sanger sequence confirmed. Similarly, SS
A comparison of Two Enrichment Methodologies, RainDance Technologies and SureSelect, Relative to the Sequencing Gold Standard, the Sanger Method Parameters
RainDance Technologies
SureSelect
Clinical implementation Cost per PCR amplicon Equipment
Yes $1.56 Use of specialized equipment, automation
Ease of use
Easier, small number of steps
DNA requirement Length of region for enrichment Scalability (samples/day)
3 g for 1 Mb target Up to 1 Mb
Yes $2.34 Use of specialized equipment, automation or manual execution Complicated, many manipulations 3 g for up to 30 Mb target Up to exome
One patient per time (8 samples/day) ⬎20⫻ coverage needed May be used for genes with pseudogenes ⬎85% (95% CI: 72–88%)
Eight patients per time (8 samples/day) ⬎20⫻ coverage needed Cannot be used for pseudogenes ⬎85% (95% CI: 77%–91%)
⬎99.5% (95% CI: 99.9%–100%) ⬎85% uniform amplification ⬎99% reproducibility at 10-fold between two samples
85–99.5%* (95% CI: 79.9%– 99.9%) ⬎85% uniformity capture ⬎85% reproducibility at 10-fold between two samples†
Variant calls Limitation Analytical sensitivity Analytical specificity Uniformity Reproducibility
Sanger Yes $5.48 None required Labor intensive 19 g for 65 Kb region Most limited One exon per time (1 sample/ day) 2⫻ May be used for genes with pseudogenes ⬎99.5% (95% CI: 95.6%–100%) ⬎99.5% (95% CI: 99.9%–100%) ⬎95% uniform amplification 100% reproducibility at 2-fold between two samples
*The specificity variation depends on which exons are captured in a given experiment. Exon capture variability has been observed in SureSelect. Therefore, RainDance Technologies amplifications are more reproducible than SureSelect captures. † The average exon coverage profile of each gene varies between SureSelect capture experiments, whereas the RainDance Technologies average exon coverage profile is much more consistent.
NGS in Muscular Dystrophy Diagnostics 243 JMD May 2012, Vol. 14, No. 3
variants were in the range of 9 to 23, and approximately 60% were also Sanger sequence confirmed. On average, 10 and 8 variants were not detected in the RDT and SS data, respectively. Many of these variants were in problematic regions that had low exon coverage due to the high GC content, as indicated by the number of exons with ⬍20⫻ coverage (Tables 2 and 3). In general, NGS successfully identified silent, missense, nonsense, splice site, deletion, and duplication changes in positive and blinded samples using RDT and SS data. Deletions of up to 30 bp have been detected by NGS.
Comparison of Enrichment Methods Comparison of the RDT and SS enrichment methods for SOLiD sequencing, and Sanger sequencing demonstrated essential similarities and differences (Table 5). RDT offers the lowest cost per amplicon, which is significantly less than SS and Sanger sequencing. Though RDT requires specialized equipment for the enrichment, its advantage is the ability to offer automation for the enrichment process. In addition, the DNA requirement for a 65-kb target interval is 3 g for RDT and SS, but it is much higher for Sanger sequencing (⬃19 g). RDT is much better than Sanger sequencing in terms of being able to process more samples per day (eight vs. one). The RDT throughput is similar to that of SS; however, the enrichment step of the RDT process is automated. Recently, the automated Agilent NGS Sample Preparation Workstation was developed to streamline the sample preparation of the targeted next-generation sequencing workflow, which greatly improves the throughput and reduces the hands-on time. RDT also has the advantage over SS in its ability to distinguish between a gene and its pseudogene targets during the enrichment process. The analytical sensitivities of RDT and SS (⬎85%) are similar to each other, but lower than Sanger sequencing (⬎99.5%) (Table 5), whereas the analytical specificities of RDT and Sanger (⬎99.5%) sequencing is similar, but lower for SS (85% to 95.5%). RDT and Sanger displayed significantly higher reproducibility than SS. When two samples are compared to each other, the RDT data demonstrated ⬎99% variant call identity, and SS was lower at ⬎85%.
Discussion In recent years, studies have shown that target enrichment in combination with NGS holds out the promise of becoming a useful diagnostic tool for the detection of mutations in families with complex monogenic disorders10,23–26; however, the performance of this technology has to be addressed before implementing it in a clinical and diagnostic laboratory setting. Here, we evaluate strengths and limitations, including the ability to identify different types of sequence variations and the diagnostic potential, of two enrichment technologies, RDT and SS, in a cohort of patients presenting with congenital muscular dystrophies, a clinical classification with heterogeneous genetic causes (Tables 1 and 3, numbers in parentheses;
Table 3, bold numbers). To this end, a wild-type control, which had all 12 CMD genes Sanger sequenced, was included to serve as a normal control reference, along with five positive control samples blinded to laboratory staff and six blinded samples with clinical features of the CMDs. The percentage of reads successfully mapped to the human genome was similar between RDT and SS, but a higher percentage of RDT reads mapped to the target region in comparison to the SS reads (Table 1). The target region–mapped percentages are consistent with other reports.1,17,22,27 Thus, this demonstrates that specificity is lower in SS samples. The off-target reads in RDT samples may be explained by nonspecific sequence amplification and contaminating traces of genomic DNA. High specificity and uniformity has been shown for RDT between different amplicons by a study that was investigating new disease-causing mutations in X-linked intellectual disability genes.1 Compared to other hybridization methods, RDT is better suited for enriching for short neighboring exons.1 PCR can be optimized to amplify target regions, whereas hybridization approaches will have to carry adjacent sequences together with real ones, thereby reducing specificity and lowering target percentages (Table 1). In addition to its specificity, RDT has less allelic bias, since most alleles can be equally amplified. For a simple two-allele example, the ability to see both alleles is attributed to the ability of RDT to represent less than a haploid copy of the genome within each PCR reaction. This results in RDT having the ability to achieve single-molecule PCR, which is not possible with any other target enrichment strategy, including other PCR-based approaches. The result of having limiting amounts of genomic DNA is that when an allele is rare, RDT will have many singleplex PCR reactions per amplicon, allowing the rare allele to be present within one PCR reaction in which it is represented as the only target, letting us mitigate allelic competition. In contrast, selection by hybridization will capture less of an allele that is significantly different from the reference, and this allelic bias can increase false-negative rates.1 Moreover, the target mapped reads are lower in the SS samples compared with the RDT samples, because there may be other 100% identical matches to off-target regions on other chromosomes, which resulted in the reads to these exons not being mapped by the read alignment programs.22 The target sequence complexity has a strong effect on the efficiency of DNA amplification and capture for individual exons. Even though the mean gene coverage/read depth was similar within and between RDT and SS samples, all exons of POMT1 were not amplified by RDT or captured by SS, and thus a low coverage was observed (Figure 1). Generally, a high mean gene read depth was observed for most exons of most genes, with the exception of POMT1. However, in many samples, the first exon was problematic and typically had a low average coverage in both RDT and SS runs (see Supplemental Figures S1–S12 at http://jmd.amjpathol.org and Table 2). High GC content may explain the low coverage in the first exons of genes, given that the mean GC content of the first coding exon of all CMD genes is 64%. Also, the exons of POMT1
244 Valencia et al JMD May 2012, Vol. 14, No. 3
have an average percent GC content of 56%, and several failed exons have a percent GC content ⬎60% (Table 2). For example, exon 1 of SEPN1, COL6A1, and LAMA2 had the highest GC contents, with percentages of 87, 73, and 71, respectively (Table 2). In addition, most exons that dropped out in the RDT samples also had a high GC content, which may hinder PCR amplification and could explain the absence of sequence data and lack of variant calls in these regions. Moreover, the negative effect of high GC content, as seen in our study for the exons with very low or null coverage, is also consistent with previous reports.1,22,28 In contrast to RDT, SS is also sensitive to sample base composition, and sequences at the extremes of high GC/AT content can be lost through poor annealing and secondary structure, respectively.28 Another consideration is that it is seldom possible to capture all of a desired target region in a hybrid capture experiment; targets are generally subjected to repeat masking (see Materials and Methods) before probe design to avoid capture of homologous repetitive elements. For exonic targets, ⬍5% to 15% of the primary target region can be lost in this way, leaving a region to which probes could be designed after repeat masking, or target capture region, that constitutes ⬎85% to 95% of the primary target region. For contiguous regions, the percentage of primary target region that is represented in the capture target region is generally lower (⬃50% to 65%), but this is highly variable between regions (Table 1). Relative to RDT, SS capture– based enrichment had a smaller number of missed exons, which may be explained by our use of 120-bp probes due to their length and the 20⫻ tiling redundancy that ensured capturing a target even if another probe missed it. The tiling redundancy would not be an advantage if larger genomic regions were to be targeted, since the most probes allowed is 55,000 per design. This means that RDT and SS enrichment technologies both have the potential for clinical use; however, Sanger sequencing will still be needed to confirm complex exons that are inefficiently amplified or captured. At this time, diagnostic applications of enrichment methods with NGS are complementary to Sanger sequencing efforts until they achieve high enough coverage to account for all possible variants at a given target region. Allelic dropout due to SNPs in the PCR primer binding sites is a limitation inherent to all PCR-based assays, including Sanger sequencing.29 RDT uses a library of primers to amplify the target regions and is therefore also susceptible to allele dropout if specific SNPs are in the primer binding sites. To minimize the absence of amplification of specific exons due to allele dropout, primers were designed in regions where SNPs have not been reported by using the Single Nucleotide Polymorphism and the 1000 Genomes databases. In the event that allele dropout occurs in RDT-targeted exons, sequence coverage cannot overcome allele dropout because there will be an absence of amplification, and such products consequently would generate zero to low sequence reads. By contrast, SS is a hybridization-based technology that relies on 120-bp probes to capture the region of interest. In this case, SS is likely to be less susceptible to allele
dropout, meaning that a particular exon of interest will not be captured, because one SNP out of 120 bp may not be enough to affect the binding of the SS probe to its target. Also, to further decrease the chance for allele dropout, a 20⫻ capture-probe tiling frequency and a 20-bp allowed overlap was used in the probe design. Even though the likelihood of allele dropout happening in an SS experiment is low, it is possible that the probes will not capture the targets of interest. Sequence coverage cannot overcome allele dropout, because no targets would be available to sequence. Although both technologies may be susceptible to allele dropout, the aforementioned considerations were taken into account to minimize such events. Furthermore, the importance of noting the clinical phenotype in the diagnosis of patients should be kept in mind to decrease the false-negative cases even further. In assessing the validity of variants identified by NGS following RDT and SS enrichment, we saw that there was a deviation of NGS-identified variants in the targeted regions relative to Sanger sequencing results (Table 3). The analytical sensitivity of RDT and SS was lower than that of Sanger sequencing: ⬎85%, ⬎85%, and ⬎99.5%, respectively (Tables 4 and 5). However, in positive control samples, RDT in combination with SS data was sufficient to correctly identify most variants of unknown clinical significance and mutations, with the exception of deep intronic variants and variants whose coverage was too low (Figure 2, A and B, and Table 4). The falsepositive rates, possibly caused by inefficiency of amplification and artifacts of sequencing, decreased after investigators learned that the coverage levels, allele percentages, and Phred-like scores in combination were necessary to reach a threshold of ⬍15% (Table 3). NGS permitted different types of variants to be detected following RDT and SS enrichment in the six blinded control samples, including silent, missense, nonsense, small deletion, and small duplication changes (confirmed by Sanger sequencing; Table 4). The range of the total number of RDT variants was between 6 and 24, compared with SS variant calls of 9 to 23. However, on average, approximately 60% of such variants were confirmed by Sanger sequencing because of low exon coverage in some regions, as indicated by the number of exons with ⬍20⫻ coverage (Tables 2 and 3). Several parameters are worth comparing between the two enrichment technologies and contrasting them to Sanger sequencing; namely, clinical implementation, cost, requirement for specialized equipment, ease of use, analytical sensitivity and specificity, and scalability (Table 5). RDT offers the lowest enrichment cost per amplicon when compared to SS and Sanger sequencing. An advantage of RDT requiring specialized equipment for the enrichment is that it allows full enrichment automation. By contrast, the manual SS procedure is more complicated and Sanger sequencing is labor intensive, since one must amplify and sequence each amplicon. However, an automated platform is now available for the SS enrichment method to fully automate the library construction steps. The RDT and SS DNA requirements are similar, but the Sanger method requires a significantly higher amount of DNA. RDT is more appropriate for situations
NGS in Muscular Dystrophy Diagnostics 245 JMD May 2012, Vol. 14, No. 3
requiring multiple genes with long exons because it can enrich a target interval up to 1 Mb. Up to eight samples can be processed per day. Similarly, SS can be used to process eight patients per day, but it can enrich a much larger target interval, up to the entire exome. By contrast, only one patient sample may be processed by Sanger sequencing in a day because it is such a large panel (383 amplicons). One important diagnostic issue is the ability to distinguish between gene and pseudogene targets; RDT and Sanger can readily address this issue by correctly choosing locations where the primers are to hybridize on the genomic DNA template. Since SS is a hybridization-based method, its limitation is not being able to distinguish between the gene and pseudogene targets. Therefore, RDT is most appropriate for the CMD panel because of the lower cost, ease of use, the length of the target interval that is appropriate (65 Kbp), the ability to distinguish between genes and pseudogenes, and the ability to process eight samples per day. From an assay validation perspective, the analytical sensitivities of RDT and SS are similar, but lower than Sanger sequencing (⬎95%). The lower analytical sensitivity may be explained by the lower coverage of specific exons. However, the analytical specificities of RDT and Sanger were higher than SS. Furthermore, RDT and Sanger displayed a significantly higher reproducibility than SS, as shown by the comparison of two samples whose variants were tallied. For example, RDT data showed a ⬎99% variant call identity between the two samples, whereas the SS was ⬎85%. The analytical specificity of all three methods taken together approached 100%. As part of a diagnostic plan, exons with low coverage get reflexed to Sanger sequencing to ensure that no variants are missed. Therefore, RDT with Sanger sequencing will continue to have the analytical sensitivity of ⬎99% by virtue of using Sanger sequencing for low-coverage exons.
Conclusions Current single-gene approaches to identify mutations in patient samples do not offer the throughput and ease of use to screen the multiple genes often associated with many medical genetic disorders, such as CMDs. Targeted sequencing paired with NGS offers the first opportunity to effectively screen the complete coding regions for a panel of genes in a single experiment. The two targeted sequencing approaches evaluated in this study (RDT and SS) demonstrated the ability to quickly and accurately allow clinicians to simultaneously test a panel of 12 genes associated with CMDs. Both RDT and SS enrichment technologies proved suitable for use in a clinical laboratory setting (Table 5). On the basis of our findings, the RDT microdroplet-based PCR approach to targeted sequencing stands out as the appropriate solution for a clinical laboratory. Irrespective of the enrichment method used, some exons in highly repetitive and GC-rich regions are difficult to target with both of these approaches and will still require traditional Sanger sequencing. Our results support the notion that targeted
molecular diagnostics of heterogeneous genetic disorders is now a reality. The adoption of a targeted sequencing approach in a clinical genetics laboratory will pave the way for a significant improvement in the diagnosis of heterogeneous genetic disorders and improve our understanding of disease genes.
Acknowledgments We thank the patients who participated and made this study possible.
References 1. Hu H, Wrogemann K, Kalscheuer V, Tzschach A, Richard H, Haas SA, Menzel C, Bienek M, Froyen G, Raynaud M, Van Bokhoven H, Chelly J, Ropers H, Chen W: Mutation screening in 86 known X-linked mental retardation genes by droplet-based multiplex PCR and massive parallel sequencing. Hugo J 2009, 3:41– 49 2. Asmann YW, Wallace MB, Thompson EA: Transcriptome profiling using next-generation sequencing. Gastroenterology 2008, 135: 1466 –1468 3. Holt RA, Jones SJM: The new paradigm of flow cell sequencing. Genome Res 2008, 18:839 – 846 4. Marguerat S, Wilhelm BT, Bähler J: Next-generation sequencing: applications beyond genomes. Biochem Soc Trans 2008, 36:1091– 1096 5. Morozova O, Marra MA: Applications of next-generation sequencing technologies in functional genomics. Genomics 2008, 92:255–264 6. Mardis ER, Ding L, Doling DJ, Larson DE, McLellan MD, Chen K, et al: Recurring mutations found by sequencing an acute myeloid leukemia genome. N Engl J Med 2009, 361:1058 –1066 7. Ng SB, Turner EH, Robertson PD, Flygare SD, Bigham AW, Lee C, Shaffer T, Wong M, Bhattacharjee A, Eichler EE, Bamshad M, Nickerson DA, Shendure J: Targeted capture and massively parallel sequencing of 12 human exomes. Nature 2009, 461:272–276 8. Schuster SC: Next-generation sequencing transforms today’s biology. Nat Methods 2008, 5:16 –18 9. Tucker T, Marra M, Friedman JM: Massively parallel sequencing: the next big thing in genetic medicine. Am J Hum Genet 2009, 85:142–154 10. Hoischen A, Gilissen C, Arts P, Wieskamp N, van der Vliet W, Vermeer S, Steehouwer M, de Vries P, Meijer R, Seiqueros J, Knoers NV, Buckley MF, Scheffer H, Veltman JA: Massively parallel sequencing of ataxia genes after array-based enrichment. Hum Mutat 2010, 31:494 – 499 11. Albert TJ, Molla MN, Muzny DM, Nazareth L, Wheeler D, Song X, Richmond TA, Middle CM, Rodesch MJ, Packard CJ, Weinstock GM, Gibbs RA: Direct selection of human genomic loci by microarray hybridization. Nat Methods 2007, 4:903–905 12. Hodges E, Rooks M, Xuan Z, Bhattacharjee A, Benjamin Gordon D, Brizuela L, Richard McCombie W, Hannon GJ: Hybrid selection of discrete genomic intervals on custom-designed microarrays for massively parallel sequencing. Nat Protoc 2009, 4:960 –974 13. Hodges E, Xuan Z, Balija V, Kramer M, Molla MN, Smith SW, Middle CM, Rodesch MJ, Albert TJ, Hannon GJ, McCombie WR: Genomewide in situ exon capture for selective resequencing. Nat Genet 2007, 39:1522–1527 14. Okou DT, Steinberg KM, Middle C, Cutler DJ, Albert TJ, Zwick ME: Microarray-based genomic selection for high-throughput resequencing. Nat Methods 2007, 4:907–909 15. Nikolaev SI, Iseli C, Sharp AJ, Robyr D, Rougemont J, Gehrig C, Farinelli L, Antonarakis SE: Detection of genomic variation by selection of a 9 mb DNA region and high throughput sequencing. PLoS ONE 2009, 4:e6659 16. Gnirke A, Melnikov A, Maguire J, Rogov P, LeProust EM, Brockman W, Fennell T, Giannoukos G, Fisher S, Russ C, Gabriel S, Jaffe DB, Lander ES, Nusbaum C: Solution hybrid selection with ultra-long oligonucleotides for massively parallel targeted sequencing. Nature Biotechnol 2009, 27:182–189 17. Tewhey R, Warner JB, Nakano M, Libby B, Medkova M, David PH, Kotsopoulos SK, Samuels ML, Hutchison JB, Larson JW, Topol EJ,
246 Valencia et al JMD May 2012, Vol. 14, No. 3
18. 19. 20.
21.
22.
23.
Weiner MP, Harismendy O, Olson J, Link DR, Frazer KA: Microdroplet-based PCR enrichment for large-scale targeted sequencing. Nature Biotechnol 2009, 27:1025–1031 Muntoni F, Voit T: The congenital muscular dystrophies in 2004: a century of exciting progress. Neuromuscul Disord 2004, 14:635– 649 Schessl J, Zou Y, Bönnemann CG: Congenital muscular dystrophies and the extracellular matrix. Semin Pediatr Neurol 2006, 13:80 – 89 Wang CH, Bonnemann CG, Rutkowski A, Sejersen T, Bellini J, Battista V, et al: Consensus statement on standard of care for congenital muscular dystrophies. J Child Neurol 2010, 25:1559 –1581 Yeager M, Orr N, Hayes RB, Jacobs KB, Kraft P, Wacholder S, Minichiello MJ, Fearnhead P, Yu K, Chatterjee N, Wang Z, Welch R, Staats BJ, Calle EE, Feigelson HS, Thun MJ, Rodriguez C, Albanes D, Virtamo J, Weinstein S, Schumacher FR, Giovannucci E, Willett WC, Cancel-Tassin G, Cussenot O, Valeri A, Andriole GL, Gelmann EP, Tucker M, Gerhard DS, Fraumeni JF Jr., Hoover R, Hunter DJ, Chanock SJ, Thomas G: Genome-wide association study of prostate cancer identifies a second risk locus at 8q24. Nat Genet 2007, 39:645– 649 Hoppman-Chaney N, Peterson LM, Klee EW, Middha S, Courteau LK, Ferber MJ: Evaluation of oligonucleotide sequence capture arrays and comparison of next-generation sequencing platforms for use in molecular diagnostics. Clin Chem 2010, 56:1297–1306 ten Bosch JR, Grody WW: Keeping up with the next generation: massively parallel sequencing in clinical diagnostics. J Mol Diagn 2008, 10:484 – 492
24. Daiger SP, Sullivan LS, Bowne SJ, Birch DG, Heckenlively JR, Pierce EA, Weinstock GM: Targeted high-throughput DNA sequencing for gene discovery in retinitis pigmentosa. Adv Exp Med Biol 2010, 664:325–331 25. Rehman AU, Morell RJ, Belyantseva IA, Khan SY, Boger ET, Shahzad M, Ahmed ZM, Riazuddin S, Khan SN, Riazuddin S, Friedman TB: Targeted capture and next-generation sequencing identifies C9orf75, encoding taperin, as the mutated gene in nonsyndromic deafness DFNB79. Am J Hum Genet 2010, 86:378 –388 26. Volpi L, Roversi G, Colombo EA, Leijsten N, Concolino D, Calabria A, Mencarelli MA, Fimiani M, Macciardi F, Pfundt R, Schoenmakers EF, Larizza L: Targeted next-generation sequencing appoints c16orf57 as clericuzio-type poikiloderma with neutropenia gene. Am J Hum Genet 2010, 86:72–76 27. Hedges DJ, Guettouche T, Yang S, Bademci G, Diaz A, Andersen A, Hulme WF, Linker S, Mehta A, Edwards YJK, Beecham GW, Martin ER, Pericak-Vance MA, Zuchner S, Vance JM, Gilbert JR. Comparison of three targeted enrichment strategies on the SOLiD sequencing platform. PLoS One 2011, 6:e18595 28. Porreca GJ, Zhang K, Li JB, Xie B, Austin D, Vassallo SL, LeProust EM, Peck BJ, Emig CJ, Dahl F, Gao Y, Church GM, Shendure J: Multiplex amplification of large sets of human exons. Nat Methods 2007, 4:931–936 29. Hussain Askree S, Hjelm LN, Ali Pervaiz M, Adam M, Bean LJ, Hedge M, Coffee B: Allelic dropout can cause false-positive results for Prader-Willi and Angelman syndrome testing. J Mol Diagn 2011, 13:108 –112


![FREE [DOWNLOAD] PROGRAMMING MASSIVELY PARALLEL ...](https://m.moam.info/img/260x300/free-download-programming-massively-parallel-_64789e54097c4744708d088f.jpg)