Rios Curucay Brangu. 5. 64. 6/8/1990 ... Rios Guaviare y Vich. 5. 57 ... calculated. AOI for the non-vegetation classes such as sandy banks, water bodies (white.
Pak. J. Bot., 37(4): 843-852, 2005.
ASSESSMENT OF THE IMAGE VALUE GRADIENT PROBLEM IN THE AMAZON LANDSAT TM DATA RIFFAT NASEEM MALIK AND SYED ZAHOOR HUSAIN* Department of Biological Sciences, Quaid-e-Azam University, Islamabad, Pakistan. Abstract The main purpose of this study was to investigate the image value gradient problem which was observed in Landsat TM images during the production of WAGIS mosaic (Toivonen et al., 2002) currently present on the Internet-based Western Amazon Geographic Information Service (www.utu.fi/ml/amazon). The results revealed a presence of gradient in image pixel values from west to east direction. The spectral reflectance values in visible bands of the Landsat TM were more affected as compared to the infrared bands. The gradient phenomenon were prominent in land-cover classes where vegetation was a major component (such as forested land), however nonvegetation classes also showed random change in reflectance values along the west to east direction along the gradient. The presence of gradient phenomenon poses serious problem in the use of Landsat TM imagery for image analysis based on reflectance values, change detection studies and the preparation of mosaics using multitemporal Landsat TM imageries. The results further highlight the consideration of gradient phenomenon in developing new image correction methodologies while using the Landsat TM imagery, particularly, in western Amazonian rainforest. These and other related problems are discussed.
Introduction Western Amazonian comprises a huge bulk of tropical rainforest, and is among the most poorly known, least mapped and remote terrestrial areas of the world and therefore, research, land-use planning and conservation decisions largely rely on remotely sensed data (Toivonen et al., 2002). Large numbers of satellite sensor are providing data at various temporal, spectral and spatial scales. Among these the Landsat TM is the most popular and commonly used for scientific investigation particularly in Amazonian environments, which is most diverse, and species rich ecosystem on the globe. Owing to its appropriate radiometric properties, spatial and spectral resolution, Landsat TM data is highly suitable for studies on the lowland ecosystems, despite its sensitivity to cloud cover and atmospheric effects (Toivonen et al., 2002). Despite the long history of Landsat TM program and its substantial use of imagery for different scientific investigation, basic pre-processing methods are still debated. Scattering, haze, path radiance and clouds are the major factors, which influence the image quality of sensors operating in optical spectrum such as Landsat TM. In Amazonia the question of radiometric and histogram stretching methods are very important and interesting as imagery is very much affected by the high humidity of the atmosphere. Heavy stretching operations are required to detect differences within the continuous homogenous forest cover (Toumisto et al., 1994). Furthermore, advanced physical atmospheric correction methods are often inapplicable due to the lack of input parameters; even image based corrections suffer due to the existence of bright and darks objects in the imagery of these regions (Toivonen et al., 2000). *Environmental Sciences Programme, Fatima Jinnah Women University, The Mall, Rawalpindi, Pakistan
844
1. 3. 4. 5. 6. 7. 8. 9. 10. 11. 12. 13. 14.
RIFFAT NASEEM MALIK & SYED ZAHOOR HUSAIN
Table 1. Landsat TM data used for gradient analysis. Place name Path Row Acquisition Rio Yavari 5 63 8/30/1993 Rio Purus, Brazil 1 65 9/7/1996 Rios Curucay Brangu 5 64 6/8/1990 Mara¤on con Tigre 7 63 7/24/1989 Rio Matos 233 70 8/8/1989 Rio Guaviare 4 57 3/10/1985 Rios Guaviare y Vich 5 57 1/31/1986 Rios Cusianay Cravo 6 57 3/25/1991 Rio Abuna 1 1 67 5/30/1987 Rio Abuna 2 1 67 5/30/1987 Rio Abuna 3 1 67 7/9/1996 Rio Alto Yurua 2 5 67 6/30/1994 Rio Alto Yurua 3 5 67 8/6/1990
During the generation of Landsat TM mosaic of the Western Amazonian (Toivonen et al., 2002) during 2000-2002, The University of Turku, Amazon Research Team (UTUART) has encountered a gradient phenomenon indicating that there is change in the DN values roughly from west to east in most of Landsat TM images. Despite the abundance of Landsat TM related research, this phenomenon has not been fully described in the literature (Toivonen et al., 2002). This phenomenon may severely disturb imagery, which appears as a gradual decline in average pixel vales from the west to the east and is a problem in calibrating adjacent images to each other and in detailed vegetation analysis (Kalliola et al., 1998). It is not known, whether the atmosphere causes gradient problem or does it reflect asymmetric reflectance function of the different ground objects. Therefore, this study was aimed at investigating the gradient phenomenon in Landsat imagery; particularly analysing its strength and variations in different wavelengths (bands) among different land cover classes. Landsat images of the Western Amazon used for the generation of WAGIS mosaic (Toivonen et al., 2002) currently present on the Internet-based Western Amazon Geographic Information Service (www.utu.fi/ml/amazon) were used for this project. A total of 14 Landsat TM images acquired between 1985 and 1996 in different months of the year were selected (Table 1). Raw Landsat TM data in its original resolution was used for the analysis. The selection of the images was based on fact that they should contain a clear gradient, least amount of cloud cover and at least two land-cover classes should be mapped across the gradient. After visual analysis of the imagery, land-cover classes such as upland, swamp, flooded, and gallery forests, sandy banks, water bodies (white and black river bodies such as lakes), deforested areas, savannah vegetation were selected and included for further analysis (Fig. 1). Images were subjectively divided into four major zones along the gradient, which include very high gradient (VH), medium gradient (M), low (L) and very low gradient (VL) respectively (Figs. 1 & 3). Areas of interest (AOI) for all land-cover classes were generated along the direction of the gradient for each zone. Statistical parameters, i.e. minimum, maximum, mean and standard deviation of the digital number (DN) variation within each band were calculated. AOI for the non-vegetation classes such as sandy banks, water bodies (white and black water bodies i.e. rivers and lakes), and deforested areas were generated from
ASSESSMENT OF THE IMAGE VALUE GRADIENT PROBLEM
845
the raw dataset as well from the specially enhanced imageries. Based on the statistical results, a ‘Gradient Index’ was calculated using following equation:
⎛ (V − V2 ) + (V2 − V3 ) + (V3 − V4 ) ⎞ %100 ⎟ G.I = ⎜ 1 Vmin − Vmax ⎝ ⎠
Equation 1
Where V1, V2, V3, and V4 are mean radiance values along very high, medium, low and very low gradient zone. Vmin and Vmax are minimum and maximum radiance values along the gradient. Results and Discussion The results have indicated that there is a clear gradient in the Landsat TM data as digital values changes from west to the east in all the images, which were used for this study. The results have also indicated that there is a clear gradient for all the vegetation classes such as upland, swamps, flooded, gallery and Bamboo forests. This shows that there is a gradual change in the pixel values, which is from very high gradient zone to the very low gradient zone (Fig. 4). When the comparison was made between the vegetation and non-vegetation classes it became evident that there is a random change in the pixel values along the direction of gradient of non-vegetation classes (Fig. 5). In water classes such as in black and white water categories the pixels indicates that either the gradient phenomenon is reverse or it is not detected. In areas of low-growing vegetation the phenomenon is not detected. This may either be due to the high internal variation of the vegetation and thus of minor importance, as an artefact to image information, or it may indeed suggest that lower vegetation does not cause a gradient in reflectance values. When strength of gradient phenomena was compared among different bands of Landsat TM data it was found that Pixels values were high and more varying in the visible bands which were severely affected by this phenomenon as compared to other visible bands, (Table 2). Among the visible portion of the spectrum, visible blue was highly affected band when compared to visible green and red. Among infrared bands, it was found that band 4 (near infrared: NIR) is the least affected band (Table 2) as compared to shortwave infrared bands i.e. SWIR (bands 5 and 7). Among the SWIR, band 5 was found more effected in comparison to band 7. Though band 4 was least effected. Differences of mean values along different zones indicated that band 4 has higher DN values difference along the gradient as compared to band 7 as well as visible green and red wavebands. In general results have indicated that differences among the pixel values along the gradient suggested that band 1, 4, and 5 show large differences as compared to pixel DN among other bands along the gradient. This study presents the first description of the phenomenon in the Amazonian region, yet in the region the small differences in forest reflectance values necessitate strong stretching of histograms. Therefore, any noise in the image information is pronounced. In addition, despite the recent Landsat TM mosaicking efforts and the increasing use of Landsat TM imagery in the Amazon region, the gradient phenomenon is often neglected or corrected with cosmetic enhancements. Neglecting the anisotropic reflectances which may lead to misleading conclusions on vegetation types and land cover classes. On the other hand, cosmetic corrections applied to the entire image may lead to mistaken impressions on water sediment load or organic matter content, a crucial matter for the local human livelihood.
846
RIFFAT NASEEM MALIK & SYED ZAHOOR HUSAIN
Fig. 1. Subset of False Colour Composite of 4, 3, 2 Bands of Landsat TM showing different lands-cover classes used to extract pixel values used for gradient analysis.
ASSESSMENT OF THE IMAGE VALUE GRADIENT PROBLEM
847
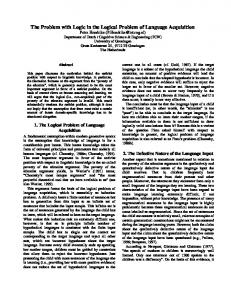
Fig. 2. Gradient phenomenon in Landsat TM data only band one is shown.
VH
M
L
VL
AOI
AOI AOI
AOI
Fig. 3. Subset of Landsat TM image acquired on 30/8/1993 over Rio Yawar in 50S 700W. Note: VH: very high, M: Medium, L: Low and VL: very low gradient zone, AOI: area of interest
848
RIFFAT NASEEM MALIK & SYED ZAHOOR HUSAIN
Fig. 4. Gradient phenomena as depicted in (a-f) upland forest in Landsat TM data of Amazon rainforest. Only one of the forest types is represented graphically, as the others depicts the same pattern of pixel values along the gradient showing east to west direction. Calculations are based on the average values of 5-10 AOIs of respective class along each part of the gradient showing east to west direction. Key: VH: very high, M: Medium, L: Low and VL: very low gradient zone in bands 1, 2, 3, 4 5, & 7
Our additional analysis from Kongo, Pakistan and Finland together with reports from Australia suggests that the phenomenon is not present in the particular meteorological and land cover conditions of rain forest. On the contrary, although Amazonian landscape offers an ideal setting for its detection, the phenomenon is more universally present in Landsat TM imagery. The detection and strength of the phenomenon poses new challenges for the development of land cover specific correction methods and further consideration of shadow effects and BRDF on imagery with small opening angle (Landsat 14.5º). This obviously requires both methodological development and the physical origin of the phenomenon should be better understood.
ASSESSMENT OF THE IMAGE VALUE GRADIENT PROBLEM
849
Fig. 5. Gradient phenomena as depicted in (a-f) Sandy river banks in Landsat TM data of Amazon rainforest gives an indication of randon pattern along the east to west gradient direction. Only one of the non-vegetation class is represented graphically, as the others depicts the same pattern of pixel values along the gradient showing east to west direction. Calculations are based on the average values of 5-10 AOIs of respective class along each part of the gradient showing east to west direction. Key: VH: very high, M: Medium, L: Low and VL: very low gradient zone in bands 1, 2, 3, 4 5, & 7
In addition to methodological development, the awareness of the phenomenon among the users of Landsat TM is crucial and it should be considered in visual interpretations, classifications, mosaicking and in modelling based on reflectance values. The strength and detection of gradient phenomenon could pose problems for the development of new correction methods which should take into account the shadows effects and BRDF on imagery with small opening angles. The users of Landsat TM data should be aware of this darkening effect while using Landsat TM data based on pixels values for forest types mapping more specifically of plant species mapping for ecological conservation and planning, deforestation, change detection studies and making mosaics using multitemporal Landsat TM data The study clearly demonstrates that the Gradient phenomenon is not peculiar to rain forest but it is universally present, it is more pronounced in Amazonian Rain forest where continuous and homogenous landscape prevails however is not as clear in other regions where landscape patchy and fragmented.
850
RIFFAT NASEEM MALIK & SYED ZAHOOR HUSAIN
ASSESSMENT OF THE IMAGE VALUE GRADIENT PROBLEM
851
852
RIFFAT NASEEM MALIK & SYED ZAHOOR HUSAIN
Acknowledgement This study was carried out when the first Author was a visiting research fellow at the Department of Geography, University of Turku, Finland. The authors gratefully acknowledge the help given by the Amazonian Research Team at the Turku University. Funds for the project provided by CIMO (Centre of International Mobility) is gratefully acknowledged. References Achard, D., H. Eva H. and P. Mayaux. 2001. Tropical forest mapping from coarse spatial resolution satellite data: data production and accuracy assessment issues. Int. Journal of Remote Sensing, 22: 2741-2762. Lu, D., P. Mausel, E. Brondizio and E. Moran. 2002. Assessment of atmospheric methods for Landsat TM data applicable to Amazon basin LBA research. Int. Journal of Remote Sensing, 23: 2651-2671. Song, C., C.E. Woodcock, K.C. Seto, M. Pax Lenney and S.A. Macomber. 2001. Classification and change detection using Landsat TM data: When and How to Correct Atmospheric Effects. Remote Sensing of Environment, 75: 230-244. Toivonen, K. and Driesprong. 2002. Western Amazonian GIS: Creation process of Landsat TM image mosaic and Internet map service. UTU-LCC Publications 4: 1-73. Available at http://www.utu.fi/ml/kartografia/compcart/. Toivonen, T. and S. Mäki. 2000. Accessibility of lowland rain forest of Western Amazonia via rivers: an analysis using Landsat TM mosaic and GIS. In: Remote sensing for environmental monitoring, GIS applications, and geology. (Ed.): M. Ehlers. Proc. of SPIE, vol. 4545:145154. Tuomisto, H., A. Linna and R. Kalliola. 1994. Use of digitally processed satellite images in studies of tropical rain forest vegetation. Int. Journal of Remote Sensing, 15: 1595-1610. Tuomisto, H., K. Ruokolainen, R. Kalliola, A. Linna, W. Danjoy and Z. Rodriguez. 1995. Dissecting Amazonian biodiversity. Science, 269: 3–66. (Received for publication 29 August 2005)