In the first phase, we built the Bayesian network based on expert knowledge ... According to the same study, Scrum dominates as the agile development process ...... §https://mirkoperkusich.wordpress.com/2015/05/18/second-experience-npt- ...
JOURNAL OF SOFTWARE: EVOLUTION AND PROCESS J. Softw. Evol. and Proc. 2015; 00:1–40 Published online in Wiley InterScience (www.interscience.wiley.com). DOI: 10.1002/smr
Assisting the Continuous Improvement of Scrum Projects using Metrics and Bayesian Networks Mirko Perkusich, Kyller Costa Gorgonio, Hyggo Almeida, Angelo Perkusich Embedded Systems and Pervasive Computing Laboratory, Federal University of Campina Grande, Zip code 58109-900, Campina Grande, PB, Brazil.
SUMMARY Scrum is a simple process to understand, but hard to adopt. Therefore, there is a need for resources to assist on its adoption. In this paper, we present the process followed to build a Bayesian network to assist on the assessment of the quality of the software process in the context of Scrum projects. The model provides data to help Scrum Masters lead the improvement of business value delivery of Scrum teams. The process is divided into two phases. In the first phase, we built the Bayesian network based on expert knowledge extracted from the literature and experts. We used a top-down approach and reasoning to define the key metrics necessary to build the models and their relationships. In the second phase, we updated the Bayesian network based on limitations of the first version. We validated the Bayesian network inferences with ten simulated scenarios. Comparing both versions, for all scenarios, we improved the accuracy of the inferences. Therefore, we concluded that the Bayesian networks adequately represent Scrum projects from the viewpoint of the Scrum Master. Finally, the model built is in conformance with agile methods tailoring and can be adapted to any Scrum team. c 2015 John Wiley & Sons, Ltd. Copyright Received . . .
KEY WORDS: Agile methods, Scrum, Bayesian Networks, Continuous Improvement, Kaizen
∗ Correspondence
to: Embedded Systems and Pervasive Computing Laboratory, Federal University of Campina Grande,
58109-900, Campina Grande, PB, Brazil. c 2015 John Wiley & Sons, Ltd. Copyright Prepared using smrauth.cls [Version: 2012/07/12 v2.10]
2
PERKUSICH ET AL.
1. INTRODUCTION
One of the reasons that agile methods have recently become popular on software development is because they focus on improving collaboration between developers and clients and rapidly responding to change of requirements. The use of agile methods is increasing to satisfy the need to respond to fast moving market demand and to gain market share [27]. According to a study [48] that collected data from over four thousand practitioners in 2014, the top three benefits of agile development are the ability to manage changing priorities and increase of team productivity and project visibility. According to the same study, Scrum dominates as the agile development process of choice with 56% of preference. Given this, in this work we focus on Scrum projects. To achieve its goals, a key concept in agile software development is continuous improvement (i.e., Kaizen). In fact, one of the twelve principles of the Agile Manifesto† states that, at regular intervals, the team reflects on how to become more effective, then tunes and adjusts its behavior accordingly. Scrum, which is based on empirical process control theory [46], describes an event, namely Sprint Retrospective Meeting, and a role, namely Scrum Master, to support the project teams continuous improvement. The Sprint Retrospective Meeting occurs at the end of every sprint (i.e., iteration) as an opportunity for the team to inspect itself and create a plan for improvements [46]. The Scrum Master is responsible to ensure that the team adheres to Scrum theory, practices and rules. During the Scrum Retrospective Meeting, the Scrum Master participates as a peer team member from the accountability over the Scrum process. Furthermore, the Scrum Master encourages the team to improve, within the Scrum framework, its development process and practices to make it more effective and enjoyable. We present an overview on Scrum in Section 2.1. On the other hand, even though Scrum is simple to understand, it is hard to master [46, 39]. It requires self-organizing, cross-functional teams and collaboration between business and development team to develop products incrementally. Especially in companies with former waterfall approach, these factors might lead agile to fail. According to VersionOne [48], 44% of respondents
† http://www.agilemanifesto.org
c 2015 John Wiley & Sons, Ltd. Copyright Prepared using smrauth.cls
J. Softw. Evol. and Proc. (2015) DOI: 10.1002/smr
3 pointed to lack of experience with agile methods as the main cause for agile to fail; 42% to company philosophy or culture at odds with core agile values. As barriers to agile adoption, 44% pointed to the ability to change organizational culture, 35% to not enough personnel with the necessary agile experience, 32% to pre-existing waterfall framework. Given this, there is a need for resources to assist on the adoption and continuous improvement of agile methods. Since agile is an empirical approach, it is necessary to define metrics to diagnose and improve the processes that produce business value. On the other hand, solely defining metrics is not enough. It is necessary to instrument the Scrum Master with data to, given the defined metrics, assess and predict the quality of artifacts (e.g., product backlog) and resources (e.g., development team). Our solution is to combine the definition of metrics with Bayesian networks. We use this technique because it explicitly treats uncertainty, inherent to software process [52], by using random variables and probability functions. Considering probability allows handling missing data and modeling the confidence of assessments, which is a requirement in our context. Furthermore, they are flexible to handle different types of data and be easily modified, which is necessary to conform to process tailoring. For instance, it can model the causal relationship between objective (e.g., test code coverage) and subjective metrics (e.g., team motivation) of the software development process, which can be measured using different scales. Finally, it can be defined given existing data or by eliciting data from experts, which is our case. In software engineering context, this technique has been used for several purposes such as to predict the velocity of an agile project [21], predict the delay of software maintenance projects [9] and analyze software project risk [22]. We present an overview of the usage of Bayesian networks in software engineering in Section 2.3. In Perkusich et al. [34], we presented the first version of a Bayesian network that models the software process of Scrum projects by considering artifacts, managerial and technical practices and team factors from the viewpoint of the Scrum Master. In Perkusich et al. [36], we presented a procedure to apply the model’s usage into the team’s process and presented results of industrial case
c 2015 John Wiley & Sons, Ltd. Copyright Prepared using smrauth.cls
J. Softw. Evol. and Proc. (2015) DOI: 10.1002/smr
4
PERKUSICH ET AL.
studies in two projects. On the other hand, in neither of the papers, we presented details regarding the process used to identify the Bayesian network’s variables and define their relationship, which we present in this paper. This paper provides three contributions. First, we present a model to represent the relationship between the Scrum process factors identified through literature review. Second, we present the process to build an executable Bayesian networks-based model to assist on assessing the software processes of Scrum projects. Lastly, we present the process applied to validate the inferences of the Bayesian network. Comparing with our prior works [34, 36], we present three novelties. First, the process of identifying the variables of the model has never been presented before. Second, we discuss limitations of the model presented in Perkusich et al. [36] and the process executed to develop a new version of the Bayesian network, which is composed of new practices and objective metrics. Lastly, we present results regarding the validation process of the new Bayesian network, in which we used simulated scenarios. This paper is organized as follows: in Section 2, we present relevant literature review focusing on Scrum and Bayesian networks; in Section 3 we present the methodology for building the proposed model; in Section 4, we present details regarding the process of building the directed acyclic graph of the first version of the Bayesian network; in Section 5, we present details regarding the process to build and validate the the second version of the Bayesian network; and, in Section 6, we present our conclusions, current limitations and future works.
2. BACKGROUND
2.1. Scrum Scrum is the most used agile framework in the industry [48] and it is common to combine it with other agile frameworks such as eXtreme Programming [8] and Kanban [2] (a process called ScrumBan). Scrum is an iterative and incremental process to optimize the ability to foresee c 2015 John Wiley & Sons, Ltd. Copyright Prepared using smrauth.cls
J. Softw. Evol. and Proc. (2015) DOI: 10.1002/smr
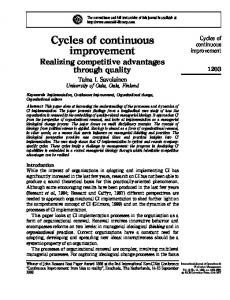
5 and control risks. The Scrum process is sustained by three pillars: transparency, inspection and adaptation [20]. At the end of each iteration, called sprint, a functional product increment is delivered to be verified and validated by the stakeholders. Important aspects of the process such as acceptance criteria must be visible (i.e., transparent) to all stakeholders. The stakeholders should inspect the artifacts and progress of the project frequently to detect any undesired variability. Finally, the project should be adapted to support changes. We present an overview of the Scrum process in Figure 1. There are two main artifacts: product backlog and sprint backlog. The product backlog is an ordered list that represents the product’s features, requirements, improvements, and bug fixes. It should be ordered given value, risk, business priority, and necessity. Furthermore, it is emergent and should adapt to business changes [38]. The sprint backlog is composed of product backlog items that were allocated to a given sprint [20]. There are three roles: Product Owner, Scrum Master, and developer [20]. The Product Owner is responsible for maximizing the product’s value. He/she should serve as an interface between the technical team and the business team and is responsible for managing the product backlog. The Scrum Master serves as a servant-leader and is responsible to ensure that Scrum’s theories, rules, and practices are correctly applied in the project. The developers are responsible for executing any activity related to delivering the product increment at the end of the sprints (e.g., design, implement and test). There are four essential meetings: planning, daily, review, and retrospective [20]. The planning meetings occur at the beginning of each sprint to define its work and goal. The daily meetings occur daily to inspect the progress of the sprint and synchronize the team’s work to mitigate risks. The review meetings occur at the end of each sprint to inspect the produced product increment and if necessary, to adapt the product backlog to changes requested by the business team. The retrospective meetings occur after the review meetings to assess the interactions between people, relationships, processes and tools. During this meeting, the team identifies problems, defines action
c 2015 John Wiley & Sons, Ltd. Copyright Prepared using smrauth.cls
J. Softw. Evol. and Proc. (2015) DOI: 10.1002/smr
6
PERKUSICH ET AL.
points (i.e., corrective and preventive actions), and defines a plan to apply the action points.
Daily meeting Product backlog
Product increment
24 hours
Sprint backlog Sprint 2 – 4 weeks
Review meeting Retrospective meeting
Planning meeting
Figure 1. Overview of Scrum.
2.2. Bayesian networks Bayesian networks are probabilistic graph models and used to represent knowledge about an uncertain domain [5]. A Bayesian network, B , is a directed acyclic graph that represents a joint probability distribution over a set of random variables V [18]. The network is defined by the pair B = {G, Θ}. G is the directed acyclic graph in which the nodes X1 , . . . , Xn represent random
variables and the arcs represent the direct dependencies between these variables. Θ represents the set of the probability functions. This set contains the parameter θxi |πi = PB (xi |πi ) for each xi in Xi conditioned by πi , the set of the parameters of Xi in G. Equation 1 presents the joint distribution
defined by B over V .
PB (X1 , . . . , Xn ) =
n Y i=1
PB (xi |πi ) =
n Y
θXi |πi
(1)
i=1
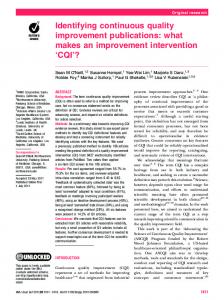
We present an example of a Bayesian network in Figure 2. Ellipses represent the nodes and arrows represent the arcs. The probability functions are usually represented by tables. Even though the arcs represent the causal connection’s direction between the variables, information can propagate in any direction [32]. c 2015 John Wiley & Sons, Ltd. Copyright Prepared using smrauth.cls
J. Softw. Evol. and Proc. (2015) DOI: 10.1002/smr
7
RELATIVES HAD CANCER T .1
X2
F 0.9
RELATIVES HAD CANCER
T
F
0.6
0.4
SMOKE
X3
LUNG CANCER
X1
X2
T
F
F
F
0.1
0.9
F
T
0.4
0.6
T
F
0.2
0.8
T
T
0.6
0.4
Figure 2. A Bayesian network example.
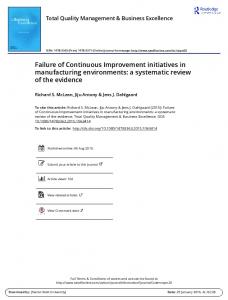
Bayesian networks have many advantages such as suitability for small and incomplete data sets, structural learning possibility, combination of different sources of knowledge, explicit treatment of uncertainty, support for decision analysis, and fast responses [47]. Therefore, they are applied to support systems with uncertainty [29]. Bayesian networks have been used for several expert systems such as assisting in safety decision making in complex project environments [51] and to predict performance in innovation projects given their transformational leadership characteristics [10]. There are two challenges to build Bayesian networks: building the directed acyclic graph (DAG) and defining the probability functions [31]. To assist on building the directed acyclic graph, Fenton et al. [15] present a set of idioms, which are Bayesian network fragments that represent the graphical part of generic types of uncertain reasoning. In this paper, we will only present the idiom that we use in our method: synthesis. Synthesis idiom models the synthesis or combination of many nodes into one node for the purpose of organizing the Bayesian network. We used synthesis idiom to decompose the initial factors into observable ones. We present an example of this idiom extracted from Fenton and Neil [14] in Figure 3. A common application of the synthesis idiom is to reduce effects of combinatorial explosion, which is the case when a node has too many parents, by divorcing the parents. According to Fenton c 2015 John Wiley & Sons, Ltd. Copyright Prepared using smrauth.cls
J. Softw. Evol. and Proc. (2015) DOI: 10.1002/smr
8
PERKUSICH ET AL.
Language complexity
Interface complexity
Structural complexity
Code complexity
Data complexity
Documentation complexity
System complexity
Synthesis idiom
Figure 3. Example of synthesis idiom.
and Neil [14], ideally, a node should have at most three parents. For instance, say that assessing Tests results depends on Occurrences of failures, Severity of faults, Tester experience and Testing effort. Considering that each node has five states, the Node Probability Table (NPT) of Test results would have 54 cells. To reduce this complexity, we could add two synthetic nodes: Reliability and Test quality. Reliability is defined in terms of Occurrences of failures and Severity of faults. Test quality is defined in terms of Tester experience and Testing effort. Finally, Tests results is defined only in terms of Reliability and Test quality. With this new configuration, the total number of cells to define the NPTs of Test results, Reliability and Test quality is 3 ∗ 52 cells, reducing the complexity in 88%. The Bayesian network’s probability functions are usually represented as NPTs. In many cases, there is not enough data to define them and it is necessary to collect them from domain experts. However, manually defining the NPTs through domain experts can become unfeasible depending on the number of nodes and states, because the complexity grows exponentially. To reduce the effort of defining NPTs through domain experts, Fenton et al. [15] proposed the concept of ranked nodes. It is based on the doubly truncated Normal distribution (TNormal) limited in the [0, 1] region. This distribution is based on four parameters: µ, mean (i.e., central tendency); σ 2 , variance (i.e., confidence in the results); a, lower bound (i.e., 0); and, b, upper bound (i.e., 1).
This distribution enables us to model a variety of shapes (i.e., relationships) such as a uniform c 2015 John Wiley & Sons, Ltd. Copyright Prepared using smrauth.cls
J. Softw. Evol. and Proc. (2015) DOI: 10.1002/smr
9 distribution, achieved when σ 2 = ∞, and highly skewed distributions, achieved when σ 2 = 0. We show TNormal examples in Figure 4.
µ = 0.5 σ2=1 a=0 b=1
µ = 0.5 σ 2 = 0.01 a=0 b=1
µ = 0.2 σ 2 = 0.1 a=0 b=1
Figure 4. TNormal examples.
In the approach presented in Fenton et al. [15], µ is defined by a weighted function of the parent nodes. There are four weighted functions: weighted mean (WMEAN), weighted minimum (WMIN), weighted maximum (WMAX) and mixture of WMIN and WMAX (MIXMINMAX). According to the authors, these functions are enough to represent the types of relationship necessary for defining NPT. We show examples NPT calculated with these functions in Figure 5. In the examples presented in Figure 5, WMEAN and MIXMINMAX have the same values. The difference between the two functions is that WMEAN calculates the weighted mean of the parent node’s values (i.e., the weights are set for the parent nodes) and MIXMINMAX mixes the minimum and maximum functions (i.e., the weights are set for the functions). To define which function should be used, the model developer must perform “what if” analysis with the expert by defining questions and collecting answers to define a truth table. The model developer must analyze the answers and define the most appropriate function. The variance is defined empirically and it should reflect the expert’s confidence in the results [15]. We show an example of questions and answers in Table I, in which the node C has two parents, A and B . In the example shown, the most appropriate function is WMIN. We used ranked nodes, because we did not have enough data to build the Bayesian network using batch learning. Therefore, we needed to elicit data from an expert. By using ranked nodes, the effort c 2015 John Wiley & Sons, Ltd. Copyright Prepared using smrauth.cls
J. Softw. Evol. and Proc. (2015) DOI: 10.1002/smr
10
PERKUSICH ET AL. WMEAN
WMIN
WMAX
MIXMINMAX
Figure 5. TNormal examples.
Table I. Example of truth table to define the weighted function for µ.
A
B
C
Very high
Very high
Very high
Very low
Very low
Very low
Very low
Very high
Very low
Very high
Very low
Low
to elicit data is reduced. Furthermore, the solution is implemented in AgenaRisk‡ , a tool to execute Bayesian networks.
2.3. Bayesian networks applied to software engineering According to the Maxim of Uncertainty in Software Engineering (MUSE) [52], uncertainty is inherent and inevitable in software development processes and products. As a corollary to MUSE, Ziv and Richardson [52] propose that software uncertainties should be modeled and managed
‡ www.agenarisk.com
c 2015 John Wiley & Sons, Ltd. Copyright Prepared using smrauth.cls
J. Softw. Evol. and Proc. (2015) DOI: 10.1002/smr
11 explicitly through uncertainty-modeling techniques such as Bayesian networks. Ziv and Richardson [52] state that Bayesian networks offer a mathematically-sound computational model for uncertainty reasoning and that their graph structure matches software systems. Furthermore, since software practitioners have experience with tree structures, the graphical structure of Bayesian networks facilitates communication with them and facilitate analysis and modifications. Therefore, Bayesian network has been applied to many areas in software engineering such as risk management and product quality prediction. Fan and Yu [12], Hearty et al. [21], Fenton et al. [13], Jeet et al. [26] and Hu et al. [22] modeled software processes to support risk management. Fan and Yu [12] built a model capable of predicting potential risks, identifying the source of risks, and supporting dynamic resource adjustment. Fenton et al. [13] showed how to use a Bayesian network to predict software defects and perform “what if” scenarios. Jeet et al. [26] built a model to estimate the impact of low productivity on the schedule of a software development. They used interviews and historical data to build the model. Hu et al. [22] proposed a risk identification framework for outsourced software projects. These works present models that have different purposes than the procedure we propose. Abouelela and Benedicenti [1] and Jeet et al. [25] modeled software processes to support quality management. Abouelela and Benedicenti [1] built a model to predict the rate of defects of a XP project. Furthermore, the model predicts the duration of the project. Thus, the proposed model allows its users to determine if a XP project will succeed. The inputs of the model are: information on requirements, size of the team, pair programming usage, Test-Driven Development usage, client availability, team velocity and the number of defects. Jeet et al. [25] built a model to detect the number of defects in a software development project. The rate of defects and the project manager’s judgments are used for predictions and support in managing the number of defects. These works have limited scope and focus on making predictions to support quality management. Pendharkar et al. [33] and Melo and Sanchez [9] modeled software processes to support project planning. Pendharkar et al. [33] used Bayesian networks to predict the effort necessary to complete a software development project using historical data and subjective estimations of experts. Melo and
c 2015 John Wiley & Sons, Ltd. Copyright Prepared using smrauth.cls
J. Softw. Evol. and Proc. (2015) DOI: 10.1002/smr
12
PERKUSICH ET AL.
Sanchez [9] presented a Bayesian network for maintenance project delays based on the experience of specialists and a corresponding tool to help in managing software maintenance projects. Settas et al. [40], Stamelos [42], Stamelos et al. [43] modeled software processes to support other project management activities. Settas et al. [40] and Stamelos [42] used Bayesian networks to help managerial decision making by modeling software project management anti-patterns. Stamelos et al. [43] modeled the uncertainties of factors to estimate software productivity. Hearty et al. [21] used a Learning Dynamic Bayesian network model to predict project velocity in XP. It can learn from project data to make quantitative effort predictions and risk assessment. According to the authors, their approach is also suitable for Scrum. One of the factors used by the model is process effectiveness. Since it only considers a few XP practices, it is one of the model’s limitations. As shown in Section 4 and Section 5, our models consider Scrum roles, events and agile software development and project management best practices to assess the process quality. Given this, as presented in Section 6, in future works, we intend the models created using our method with the model presented in Hearty et al. [21] to combine process improvement and project management information. Nagy et al. [30] used Bayesian networks to build a model to monitor the health of an agile project considering its key factors. The proposed model was built using the knowledge of experts, but Nagy et al. [30] did not present the elicitation process, experts background and justifications regarding the identified key agile factors. Furthermore, the model was not validated. Given its weaknesses and the lack of instructions on how to use it, we believe that it has limited contribution. In this paper, we present the steps executed to, as shown in Section 4 and Section 5, construct a Bayesian network to assist on the continuous improvement of Scrum-based projects considering Scrum roles, events and agile software development and project management best practices, which is a novel approach.
c 2015 John Wiley & Sons, Ltd. Copyright Prepared using smrauth.cls
J. Softw. Evol. and Proc. (2015) DOI: 10.1002/smr
13 3. METHODOLOGY
Our goal was to build a generic process assessment model to assist on the continuous improvement of Scrum software development projects by considering Scrum’s roles, events and agile software development and project management best practices. By generic, we mean that it considers the official Scrum roles, events, rules and management practices as described in the Scrum Guide [46] and recommended technical practices. We consider the Scrum Guide as the official document that describes Scrum, because it is authored by the creators of Scrum: Jeff Sutherland and Ken Schwaber. The proposed model’s goal is not to fit all organizations that use Scrum, because it is not realistic. As it occurs with the adoption of any software development method (e.g., Rational Unified Process or Extreme Programming), an organization might need to tailor it to meet its context and needs. Therefore, the model’s goal is to consider “best practices” and minimize the effort necessary to adopt it by organizations. We decided to follow the Scrum Guide, because it has been shown that deviations from it that are not well motivated and reasonable can lead to negative consequences such as reduced product quality. In Eloranta, Koskimies and Mikkonen [11], the authors show data collected from eighteen teams in eleven companies resulting in fourteen anti-patterns on the adoption of Scrum such as having a Product Owner without authority and an unordered Product Backlog. On the other hand, monitoring only the factors identified through the Scrum Guide is not enough to reach our goal: guide the continuous improvement of the software process of teams that use Scrum. As discussed in Williams [50], using only Scrum managerial practices on software development projects result in reduction of productivity caused by poor product quality. Therefore, we added agile technical practices to the generic model. As already discussed, some technical practices contained in the generic model might not make sense to a given context, but this is not a limitation of the model itself. It is a natural consequence of adopting any prescribed software development method [7].
c 2015 John Wiley & Sons, Ltd. Copyright Prepared using smrauth.cls
J. Softw. Evol. and Proc. (2015) DOI: 10.1002/smr
14
PERKUSICH ET AL.
Since our model is a Bayesian network, the problem of building it can be divided into (i) defining the DAG and (ii) the NPT. The DAG represents key software process factors (e.g., agile project management best practices) and their relationships in a Scrum software development project. A key software process factor is a factor related to the software process that the model developer judged as relevant for the model (e.g., software validation). The NPT quantifies through probabilities the relationships of the nodes. On the DAG, each node represents a key factor, and there is an edge between two nodes whenever they relate to each other. Also, for each edge, the influenced key factor on the relationship is the edge’s endpoint. Furthermore, each key factor has possible states and each one of them has an associated probability. Given that, as shown in Perkusich et al. [36], each key factor represents a set of tuples N = {(s1 , p1 ), . . . , (s|N | , p|N | )}, where si is a possible state and pi is the associated probability. Also, we have the set of key factors F = {N1 , . . . , N|F | }. Furthermore, we have the set of edges R = {(Nj , Nk ) | Nj ⊂ F ∧ Nk ⊂ F }, where Nj is the initial point and Nk is the endpoint of the edge. Therefore, the problem is to find all elements of the sets F and R. To find all elements of the set F , we need to identify all key factors Na , and for each key factor Na , find all the possible states si and associated probability pi , where a ≤ |F | and i ≤ |Na |. Finally, to find all elements of the set R, we need to identify all the relationships between the key factors, which are represented by the 2-tuples (Nj , Nk ), where Nj and Nk ∈ F . To build the Bayesian network, we followed an engineering process based on Neil, Fenton and Nielson [31]. We show the main activities of the process in Figure 6. The process is divided into two phases. In the first phase, the steps are: (i) specify requirements, (ii) define DAG, (iii) build the NPTs, (iv) validate Bayesian network inferences and (v) evaluate Bayesian network’s usage. In step (i), the requirements of the model were defined. As already discussed, the model must be generic and consider Scrum’s key process factors as described in the Scrum Guide and agile technical practices recommended by the literature. Furthermore, it must be built from the viewpoint of the Scrum Master, the input variables must be subjective metrics of observable factors and represent one Scrum team. In this paper, from the first phase, the scope is to present details regarding step (ii),
c 2015 John Wiley & Sons, Ltd. Copyright Prepared using smrauth.cls
J. Softw. Evol. and Proc. (2015) DOI: 10.1002/smr
15 which are presented in Section 4. This version of the Bayesian network was validated with simulated scenarios and evaluated with a case study in two projects. For details regarding the remaining steps, refer to Perkusich et al. [34], Perkusich et al. [35] and Perkusich et al. [36]. The second phase is composed of three steps: (vi) update the DAG, (vii) update the NPTs and (viii) validate the Bayesian network inferences. In the second phase, we updated the Bayesian network given limitations of the first version. The limitations are discussed in Section 4.3. We present the process to update and validate the Bayesian network in Section 5.
Start
(i) Specify requirements
(iii) Build the NPTs
(iv) Validate Bayesian network inferences
Second phase
First phase
(ii) Define DAG
(vi) Update DAG
(vii) Update NPTs
(viii) Validate Bayesian network inferences End
(v) Evaluate Bayesian network’s usage
Figure 6. Process followed to build the Bayesian network.
4. PROCESS TO BUILD THE FIRST VERSION OF THE DAG
The problem of defining the DAG was subdivided into two: define the nodes and relationships and define the nodes’ states. We solved the first problem by following aa top-down approach in which we decomposed the top-level node, Process quality, into factors that we judged to be observable by the team’s Scrum Master. To decompose the nodes, we used reasoning and data from the Scrum Guide, c 2015 John Wiley & Sons, Ltd. Copyright Prepared using smrauth.cls
J. Softw. Evol. and Proc. (2015) DOI: 10.1002/smr
16
PERKUSICH ET AL.
respected agile practitioners such as Cohn [8] and Pichler [38] and scientific literature, as shown in Section 4.1. Afterwards, we presented the initial elements (i.e., key software process factors) to eleven experts and, using the Delphi technique [24], refined the sets of elements during one-to-one discussions as shown in Section 4.2. Finally, we defined the nodes’ states as shown in Section 4.2. Given the popularity of Object Oriented design, to encapsulate the DAG complexity, we explain its construction using an analogy with Object Oriented paradigm in which dependent nodes in the DAG are treated as classes; independent nodes (i.e., observable factors), as primitives; and, relationship between dependent nodes as class composition. We show an example of the analogy used in Figure 7. In the class diagrams, we use bold font to represent classes (i.e., objects).
Factor A + Factor B + Factor C + Factor D
Factor A
Quality
Factor D
Factor B Factor B + Factor E + Factor F
Factor C Factor E
Factor F
Figure 7. Analogy between Object Oriented paradigm and DAG’s tree structure.
4.1. Initial definition of the DAG Since our goal was to assess the process quality, we defined the first element of F : Process quality. As presented in Perkusich et al. [36], all software processes include four main activities: software specification, software design and implementation, software validation and software evolution. In Scrum, the Product Owner is responsible for maximizing the value of the product [46]. In other words, the Product Owner is responsible for the software specification. Furthermore, at the end of c 2015 John Wiley & Sons, Ltd. Copyright Prepared using smrauth.cls
J. Softw. Evol. and Proc. (2015) DOI: 10.1002/smr
17 every sprint a product increment must be delivered. By assessing this artifact, we assess software design, implementation and evolution. Finally, software validation is performed by increment inspection at the end of every sprint [46]. Given that Work validation quality, Product increment quality and Product Owner overall work quality are not directly observable, we considered them as classes. We show the resulting class diagram in Figure 8.
Process quality + Product increment quality
+ Work validation quality + Product Owner overall work quality
Figure 8. Process quality class diagram.
Afterwards, we defined the class Work validation quality. In Scrum, stakeholders validate the work (i.e., product) during Sprint Review meetings. During this meeting, the Product Owner verifies which items are done by checking their acceptance criteria, checks if the sprint goal was reached and the if stakeholders collaborates with the Scrum team to analyze if the product attends the market needs [46]. Not having Sprint Review meetings or not having the customers to attend it might lead to a lot of rework due to misunderstanding and development of wrong features [11]. The Scrum Master can observe if the activities described were executed successfully during Sprint Review meetings. Given this, we considered them as primitives. We show the Work validation quality class diagram in Figure 9.
Work validation quality + Stakeholders feedback
+ Acceptance criteria check + Sprint goal check
Figure 9. Work validation quality class diagram. c 2015 John Wiley & Sons, Ltd. Copyright Prepared using smrauth.cls
J. Softw. Evol. and Proc. (2015) DOI: 10.1002/smr
18
PERKUSICH ET AL.
For the stakeholders and Product Owner to be able to guide product development, the team delivers a potential shippable product (i.e., increment) at the end of every sprint [46]. The delivered increment is a result of the activities performed during the sprint and its planning. We show the Product increment quality class diagram in Figure 10. Product increment quality + Sprint progress
+ Sprint Planning quality
Figure 10. Product increment quality class diagram.
The sprint planning occurs during the Sprint Planning meeting. During this meeting, the Spring Backlog Items, which are extracted from the Product Backlog are negotiated between the Product Owner and the developers [46] to define the Sprint Backlog quality. The Sprint Backlog’s quality depends on the Product Backlog Items’s quality and the team’s ability to decompose them into technical tasks [19] and estimate their size. Furthermore, the sprint length must be defined according to the project’s environment (e.g., frequency of changes and stakeholders availability), have at most four weeks and be fixed [46, 11]. Velocity is a metric used to assist the team during the Sprint Planning meeting, because it indicates its workload capacity per sprint [8, 21, 28]. Finally, the sprint goal, which must be broad and realistic, is defined during the Sprint Planning meeting to give focus to the developers. We show the resulting class diagram in Figure 11, in which the class Product Backlog item quality is described later. During the sprints, there are three factors that influence their progress: Daily Scrum meetings, Sprint Backlog stability and the development team’s competence. Daily Scrum meetings are essential to satisfy the Scrum principle that states that team must inspect and adapt constantly [46]. Furthermore, Scrum assumes that the team is not disturbed during the sprints, because it interrupts the work flow of the team, consequently reducing its efficiency [11]. Therefore, the Sprint Backlog, which represents the sprint’s scope, must be stable and represent all the work performed by the team during the sprint. We show the Sprint progress class diagram in Figure 12. c 2015 John Wiley & Sons, Ltd. Copyright Prepared using smrauth.cls
J. Softw. Evol. and Proc. (2015) DOI: 10.1002/smr
19 Sprint Planning quality + Team velocity defined + Broad and realistic goal + Sprint length + Sprint Backlog quality
Sprint Backlog quality
+ Size estimation quality + Task breakdown quality + Product backlog items description
Figure 11. Sprint Planning quality and Sprint backlog quality class diagrams.
Sprint progress + Development team competence
+ Daily Scrum quality + Sprint items and priorities stability
Figure 12. Sprint progress class diagram.
Daily Scrum meetings improve communications, eliminate other meetings, identify impediments, highlight and promote quick decision-making, and improve the development teams level of knowledge [46]. They are time-boxed to fifteen minutes and their purpose is to synchronize activities and create a plan for the next day, not to report status. During these meetings, team members must answer three questions: (i) What did I do yesterday that helped the team meet the sprint goal?, (ii) What will I do today to help the team meet the sprint goal?, and (iii) Do I see any impediment that prevents me or the team from meeting the sprint goal?. According to Stray, Sjberg and Dyb [44] this meeting’s topics should be restricted to these three questions, with more focus on the last two. Self-justification during this meeting is an indicator of escalation of commitment [45] and technical discussions should be taken in a post meeting [44]. We show the Sprint progress class diagram in Figure 13. c 2015 John Wiley & Sons, Ltd. Copyright Prepared using smrauth.cls
J. Softw. Evol. and Proc. (2015) DOI: 10.1002/smr
20
PERKUSICH ET AL.
Daily Scrum quality + Monitor sprint progress
+ All participants present + Answer the 3 basic questions + 15 minutes limit
Figure 13. Daily Scrum quality class diagram.
In Scrum, the development team is self-managed, cross-functional and must build the product incrementally [46]. Self-management is considered a key factor to indicate an agile team’s maturity [16]. Not having a cross-functional team might result in less committed team, staged development, slower feedback loops and complex communication [11]. Given this, its competence depends on its teamwork quality, software engineering practices and ability to continuously improve [8]. We defined that the teamwork quality depends on: members’ personality, members’ technical knowledge, motivation, collective ownership, team physical distribution and team size. We decomposed the software engineering practices into code quality, inspection and integration frequency. We show the resulting class diagram in Figure 14. Development team competence + Continuous improvement + Development team teamwork skills
+ Software engineering techniques quality
Development team teamwork skills + Team physical distribution + Team size + Collective ownership + Members motivation + Members personality + Members expertise
Software engineering techniques quality + Code integration frequency + Code quality + Code inspection quality
Figure 14. Development team competence, Development team teamwork skills and Software engineering techniques quality class diagrams.
According to Cohn [8], Scrum teams should use XP’s software engineering techniques [4]. To inspect the code, pair programming is a recommended practice for agile teams to improve quality, c 2015 John Wiley & Sons, Ltd. Copyright Prepared using smrauth.cls
J. Softw. Evol. and Proc. (2015) DOI: 10.1002/smr
21 productivity and knowledge sharing [37]. On the other hand, with this purpose many agile teams use peer code review [23]. To guarantee code quality, teams should use Test Driven Development (TDD). If the team does not use TDD, it must execute another process that includes test automation, refactoring and evolution of tests, which are popular agile practices [50] to maintain high product quality. To integrate code, many agile teams use Continuous Integration, which according to Williams [50] is the most popular agile practice. Given this, we added five elements to F : Pair programming and Peer code review, children of Code inspection quality; and, Code refactoring, Automated tests and Tests coverage analysis, children of Code quality. We show the resulting class diagram in Figure 15.
Software engineering techniques quality + Code integration frequency + Code quality
Code inspection quality + Pair programming + Peer code review
+ Code inspection quality
Code quality + Code refactoring + Automated tests + Test coverage analysis
Figure 15. Software engineering techniques quality, Code quality and Code inspection quality class diagrams.
The Product Owner is the only responsible to manage scope and all stakeholders must respect his/her decisions [46]. The Product Owner must have specific personal characteristics [16], guarantee the Product Backlog quality and track the project’s progress [11]. According to Pichler [38], the Product Owner must be: visionary and doer, leader and team player, empowered and committed, available and qualified and communicator and negotiator. A Product Owner with incorrect personality and empowerment might cause unclear requirements and poor communication c 2015 John Wiley & Sons, Ltd. Copyright Prepared using smrauth.cls
J. Softw. Evol. and Proc. (2015) DOI: 10.1002/smr
22
PERKUSICH ET AL.
quality. Lack of progress visibility results in lack of team awareness [11]. We show the resulting class diagram in Figure 16.
Product Owner overall quality + Progress tracking + Product Backlog quality + Product Owner personal characteristics
Product Owner personal characteristics + Communicator and negotiator + Empowered and committed + Available and qualified + Visionary and doer + Leader and team player
Figure 16. Product Owner overall quality and Product Owner personal characteristics class diagrams.
The Product Backlog quality depends on its management and the Release Plan quality. The Product Backlog must be emergent, estimated, ordered and properly detailed [46]. By being emergent, it stays flexible to changes in requirements. By being estimated, helps on the project tracking. By being ordered, it gives the team focus on time to market and deliver value to the client [11]. By being properly detailed, it facilitates communication between the team and customers. In agile teams, a practice to foster motivation and collaboration is to have the release plan and product vision communicated to the whole team [50]. The Release Plan depends on the product vision quality, the description of the top three to five features and definition of the launch data [38]. The product vision must have a broad and engaging goal, be clear and stable, short and concise, and describe the critical attributes to satisfy the customer needs [38]. We show the resulting class diagram in Figure 17. To order the Product Backlog, the Product Owner must consider business value, risks and technical dependencies [46]. Furthermore, the Product Backlog Items must be negotiable, testable, top items must be small enough to be implemented during one sprint, have clear and complete c 2015 John Wiley & Sons, Ltd. Copyright Prepared using smrauth.cls
J. Softw. Evol. and Proc. (2015) DOI: 10.1002/smr
23 Product Backlog quality + Product Backlog management + Release plan
Release Plan + Launch date defined + 3 to 5 top features described + Product vision quality
Product Backlog management
+ Product Backlog is emergent + Product Backlog is estimated + Product Backlog ordering quality + Product Backlog items description
Product vision quality + Critical attributes to satisfy customer needs described + Broad and engaging goal + Clear and stable + Short and concise
Figure 17. Product Backlog quality, Product Backlog management, Product Backlog items description and Release plan and Product vision quality class diagrams.
acceptance criteria, independent and consider non-functional requirements [8]. We show the resulting class diagram in Figure 18.
Product Backlog management + Product Backlog is emergent + Product Backlog is estimated + Product Backlog ordering quality + Product Backlog items description
Product Backlog ordering quality + Considers technical dependencies + Considers business value + Considers risk
Product Backlog items description + Testable + Negotiable + Estimated size is small + Clear acceptance criteria + Considers non-functional requirements + Independent
Figure 18. Product Backlog ordering quality class diagram.
This way, we finalized the initial analysis and built the model’s first version. During this process, we identified sixty seven variables: twenty two, dependent; and, forty six, independent. c 2015 John Wiley & Sons, Ltd. Copyright Prepared using smrauth.cls
J. Softw. Evol. and Proc. (2015) DOI: 10.1002/smr
24
PERKUSICH ET AL.
4.2. Discussions with specialists We consulted a group of eleven experts to evaluate the results presented in Section 4.1. The group was composed of practitioners with experience as Scrum Master, Product Owner, agile project manager, agile coach, consultants and team leaders in companies located in Brazil, USA, Europe and India. To reach a consensus between the practitioners, since they were spread in different locations and it was not possible to meet with all simultaneously, we applied the Delphi technique [24]. The Delphi technique is a structured group communication process to conduct detailed discussion regarding a specific issue. We used an iterative process to apply the Delphi technique and aimed for reaching consensus for, at least, 7 of the experts. In the first iteration, we had one-to-one discussions with the experts. This discussion included explaining the model’s goal and the process that we used to identify the key process factors in Scrum projects and receiving their feedback. Afterwards, we consolidated the feedback of all the experts and developed, for the fragments of the DAG that had not reached a consensus, a set of possible options. In the second iteration, we sent a questionnaire containing one question for each fragment that had not reached a consensus asking the expert their opinion regarding the best option. At the end of the second iteration, we reached a consensus. The DAG was modified after the practitioners’ evaluation. According to 8 of them, in real projects, it is common for clients to be unavailable during Sprint Retrospective meetings. Therefore, their feedback is collected in separate meetings. We show the resulting Work validation quality class diagram in Figure 19. According to seven of the practitioners, code documentation should be considered a factor in code quality. In agile projects, scope changes frequently and having the code well documented makes changes easier to be executed. Furthermore, nine practitioners stated that for code inspection, static analysis tools are often used to automate this process. We present these modifications in Figure 20. After the practitioners’ evaluation, F was composed of seventy three variables: twenty one, dependent; and, fifty independent. We show the final class diagram in Figure 21. Furthermore, we consulted the group of experts that participated in the Delphi regarding the number of states each node should have. After the discussions, we decided to use three states because c 2015 John Wiley & Sons, Ltd. Copyright Prepared using smrauth.cls
J. Softw. Evol. and Proc. (2015) DOI: 10.1002/smr
25
Work validation quality
+ Sprint review meeting quality + Stakeholders feedback outside the Sprint review meeting
Work validation quality
+ Stakeholders feedback + Acceptance criteria check + Sprint goal check
Sprint review meeting quality + Stakeholders feedback + Acceptance criteria check + Sprint goal check
Before evaluation from experts
After evaluation from experts
Figure 19. Work validation quality class diagram’s modifications after practitioners’ evaluation.
Code quality
Code quality + Code refactoring
+ Code refactoring
+ Automated tests
+ Automated tests
+ Test coverage analysis
+ Test coverage analysis + Documentation
Code inspection quality Code inspection quality
+ Peer code review
+ Peer code review
+ Pair programming
+ Pair programming + Static code analysis Before evaluation from experts
After evaluation from experts
Figure 20. Code quality and Sprint planning quality class diagrams’ modifications after practitioners’ evaluation.
it is quick and simple to use. Thus, we agreed that, given our context, it would not negatively the capabilities of the model. Since for all nodes we use an ordinal scale, the three states defined were: Bad, Moderate and Good. We defined High as the state the represents the best case scenario for the given factor (i.e., node).
4.3. Limitations Even though the model’s usage was successfully evaluated with an industrial case study with two projects [36], there are limitations and improvement opportunities. The method [35] that we used c 2015 John Wiley & Sons, Ltd. Copyright Prepared using smrauth.cls
J. Softw. Evol. and Proc. (2015) DOI: 10.1002/smr
26
PERKUSICH ET AL.
Process quality + Product increment quality + Work validation quality + Product Owner overall work quality Product increment quality
Work validation quality
+ Sprint progress + Sprint Planning quality
+ Sprint review meeting quality + Stakeholders feedback outside the Sprint review meeting
Sprint progress
Sprint Planning quality
+ Development team competence + Daily Scrum quality + Sprint items and priorities stability
+ Team velocity defined + Broad and realistic goal + Sprint length + Sprint Backlog quality
Product Owner overall quality + Progress tracking + Product Backlog quality + Product Owner personal characteristics
Product Owner personal characteristics + Communicator and negotiator + Empowered and committed + Available and qualified + Visionary and doer + Leader and team player
Daily Scrum quality + Monitor sprint progress + All participants present + Answer the 3 basic questions + 15 minutes limit
Development team competence + Continuous improvement + Development team teamwork skills + Software engineering techniques quality
Software engineering techniques quality + Code integration frequency + Code quality + Code inspection quality
Sprint Backlog quality + Size estimation quality + Task breakdown quality + Product backlog items description
Product Backlog quality
Development team teamwork skills
Release Plan
+ Product Backlog management + Release plan
+ Team physical distribution + Team size + Collective ownership + Members motivation + Members personality + Members expertise
+ Launch date defined + 3 to 5 top features described + Product vision quality
Product Backlog management Product vision quality
+ Product Backlog is emergent + Product Backlog is estimated + Product Backlog ordering quality + Product Backlog items description
Code inspection quality + Pair programming + Peer code review
+ Critical attributes to satisfy customer needs described + Broad and engaging goal + Clear and stable + Short and concise
Product Backlog items description + Testable
Code quality + Code refactoring + Automated tests + Test coverage analysis
Sprint review meeting quality + Stakeholders feedback + Acceptance criteria check + Sprint goal check
+ Estimated size is small + Clear acceptance criteria + Considers non-functional requirements
Product Backlog ordering quality + Considers technical dependencies + Considers business value + Considers risk
Figure 21. First experience’s complete class diagram.
to define the NPT was criticized given its subjectivity and its modeling limitations. It is based on ordinal (i.e., ranked) nodes as presented in Fenton et al. [15], which presents four types of functions to model the NPTs. We only used one, which limits modeling capabilities. Regarding the variables’ scale, we had previously agreed with using a 3-point Likert scale, as shown in Section 4.2. On the other hand, by applying the model to real projects, we observed that only three states limits the modeling capabilities due to lack of options to represent the reality of the projects, which is an evidence of a failure in our previous process to define the number of states for each node. Furthermore, for some NPTs, node divorcing [14], which consists of separating the parent nodes from one another, can be applied to reduce the complexity of defining the NPTs and the effects of combinatorial explosion. For instance, the factor Development team teamwork skills depends directly on six factors. Considering that Development team teamwork skills is defined with a 3-point scale, its NPT will have 36 (i.e., 729) cells. c 2015 John Wiley & Sons, Ltd. Copyright Prepared using smrauth.cls
J. Softw. Evol. and Proc. (2015) DOI: 10.1002/smr
27 According to Williams [50], our first model is missing two important agile practices: Definition of Done (i.e., done criteria) and Emergent Design. Definition of Done is presented in the Scrum Guide [46] and considered an important practice to maintain focus on the product quality [50]. Regarding Emergent Design, even though we did not consider it explicitly, we consider Code refactoring as an indicator for the given factor. Finally, our first model is mainly composed of subjective metrics, except for test coverage. To automate process and product quality analysis of agile projects, many objective metrics have been proposed such as Running Tested Feature (RTF) and percentage of automated tests[3, 28]. Replacing some subjective metrics with objective metrics would decrease the effort to input data to the model, because the values of some factors could be defined automatically. Furthermore, it would reduce the model’s subjectivity, because some of the factor’s values would be independent of the Scrum Master’s judgment.
5. PROCESS TO BUILD THE SECOND VERSION OF THE BAYESIAN NETWORK
With the purpose of solving the problems described in Section 4.3, we improved the model presented in Section 4. We started by evaluating each fragment in the Bayesian network to identify improvement opportunities. Afterwards, the first step, which we present in Section 5.1, was to add essential agile practices as presented in Williams [50] and refactor the DAG to reduce the complexity of defining the NPTs. The second step, which we present in Section 5.2, was to define the NPT following the method presented in Fenton et al. [15], which, compared to the method Perkusich et al. [35] used to build our first model, improves the modeling capabilities (i.e., uses four types of weighted expressions to define NPT). Finally, as presented in Section 5.3, we validated the model with simulated scenarios.
5.1. DAG revision The first step was to add the factor Definition of Done, considered by Williams [50] one of the most important agile practice. According to Sutherland and Schwaber [46], Definition of Done is an c 2015 John Wiley & Sons, Ltd. Copyright Prepared using smrauth.cls
J. Softw. Evol. and Proc. (2015) DOI: 10.1002/smr
28
PERKUSICH ET AL.
artifact to ensure a shared understanding of when a Product Backlog item or an increment is done. So, in our model, it would be an attribute of the class Product increment quality. Instead of defining the class Definition of done as an instance variable of Product increment quality, we created a new class Scope definition quality, and defined Definition of Done and Sprint Planning quality as its instance variables. Afterwards, we defined a composition between Product increment quality and Scope definition quality. The reasoning behind this decision was that, for a given sprint, the total amount of work that should be performed by the team is the combination of tasks related to the functional goals of the sprint and the quality criteria defined in the Definition of Done. Furthermore, this configuration reduces the complexity of defining the NPTs. We show the resulting class diagram in Figure 22.
Product increment quality
+ Sprint progress + Scope definition quality Product increment quality + Sprint progress + Sprint Planning quality Scope definition quality + “Done” criteria + Sprint Planning quality
First version
Second version
Figure 22. Product increment quality class diagram modifications.
Afterwards, we noticed that the fragment Software engineering techniques quality could be improved. The first modification was to modify Code inspection quality and define it as an attribute of Code quality instead of Software engineering techniques quality, because code inspection activities are an indicator of the source code quality. Afterwards, we removed Code quality’s attribute Documentation, because it is an attribute of the source code quality that is controlled by code inspection activities. So, if we kept it, we would be representing the same factor (i.e., documentation) twice. In general, there are two types of automated tests: acceptance and unit tests. Given this, we added two metrics to indicate Automated tests: Running Tested Features and Unit tests coverage. c 2015 John Wiley & Sons, Ltd. Copyright Prepared using smrauth.cls
J. Softw. Evol. and Proc. (2015) DOI: 10.1002/smr
29 Depending on the project’s context, other metrics could be used. Furthermore, we removed Pair programming from the model, because we concluded that it is an “extreme” case of Peer code review. We show the resulting class diagram in Figure 23. Software engineering techniques quality + Code integration frequency + Code quality Software engineering techniques quality + Code integration frequency
Code inspection quality + Pair programming + Peer code review
+ Code quality
Automated tests
+ Code inspection quality Code quality + Automated tests + Code refactoring + Code inspection quality
Code quality
+ Running Tested Features + Unit tests code coverage Code inspection quality
+ Static code analysis + Peer code review
+ Code refactoring + Automated tests + Test coverage analysis + Documentation
First version
Second version
Figure 23. Software engineering techniques quality class diagram modifications.
The second step was to modify the DAG to reduce the model complexity and improve performance. For this purpose, we used divorcing [14], which consists of applying the synthesis idiom to cut down the combinatorial space. We show the modifications performed using divorcing in Figure 24, Figure 25 and Figure 26. Product Owner personal characteristics + Collaborative skills + Visionary and doer + Empowered and committed Product Owner personal characteristics + Communicator and negotiator + Available and qualified + Leader and team player + Visionary and doer + Empowered and committed
Collaborative skills + Communicator and negotiator + Available and qualified + Leader and team player
First version
Second version
Figure 24. Modifications in Product Owner personal characteristics caused by applying the divorcing technique.
c 2015 John Wiley & Sons, Ltd. Copyright Prepared using smrauth.cls
J. Softw. Evol. and Proc. (2015) DOI: 10.1002/smr
30
PERKUSICH ET AL.
Teamwork quality + Team structure + Collaboration + Members expertise Teamwork quality + Team size + Team physical distribution + Members expertise + Collective ownership + Members motivation + Members personality
Team structure
+ Team size + Team physical distribution Collaboration + Collective ownership + Members motivation + Members personality
First version
Second version
Figure 25. Modifications in Teamwork quality caused by applying the divorcing technique.
Product Backlog items description + Details + Negotiable + Estimated size is small Product Backlog items description + Negotiable + Estimated size is small + Testable + Clear acceptance criteria + Considers non-functional requirements + Independent
First version
Details + Testable + Clear acceptance criteria + Considers non-functional requirements + Independent
Second version
Figure 26. Modifications in Product Backlog items description caused by applying the divorcing technique.
Afterwards, we removed Development team competence’s attribute Continuous improvement, because the model’s goal is to assist on continuous improvement. So, we noticed after evaluating the model the model in real projects [36] that it was confusing to input values for this factor. Finally, to improve modeling capabilities, we changed from using 3-point Likert scale to 5-point Likert scale.
5.2. NPT definition To define the NPT of a ranked node it is necessary to define three parameters: f , V = (v1 , ..., vk ) and σ 2 , where f is the type of function, V is a vector containing parent node’s weights, k is the number c 2015 John Wiley & Sons, Ltd. Copyright Prepared using smrauth.cls
J. Softw. Evol. and Proc. (2015) DOI: 10.1002/smr
31 of parent nodes, and σ 2 is the variance. In AgenaRisk, the tool used to execute the Bayesian network, these variables have the following range: f ∈ {W M EAN, W M IN, W M AX, M IXM IN M AX}, w ∈ {1, ..., 5}, σ 2 ∈ {5.0E −4 , ..., ∞} and k ∈ {1, ..., ∞}.
With this purpose, we applied the method presented in Fenton et al. [15], which consists of eliciting data from an expert through “what if” analysis and truth table. We elicited data from an expert with five years of experience as Scrum Master and was already familiarized with the model presented in Perkusich et al. [36]. Furthermore, for each dependent node in the DAG, we defined a set of questions to elicit knowledge from the expert. Each question was defined in terms of combinations of states of the given node’s parents. The set of questions defined the number of lines of the truth table; the data elicited from the expert, the result for each line. Given that the knowledge from the expert was elicited, we defined the f , V and σ 2 through reasoning and trial and error until we reached accurate inferences. Initially, we defined, for each node, 2 ∗ i questions, where i is the number of parents. The questions were defined using extreme values, such as the combination Very low and Very high, using a 5-point Likert scale. If, for a given case, the number of questions was insufficient to define the f , V and σ 2 , we added questions. To assess the accuracy of the calculations (i.e., inferences), we used the Brier score [6]. For a single prediction, which is our case, the Brier score is simply the square of the difference between the predicted probability (q ) and the actual outcome (o) [14], for each state: B =
Ps
n=1 (on
− qn )2 ,
where B is the Brier score and s is the number of possible outcomes (i.e., number of states of the given node). Given that we want the best possible calibration, we attempted to, given data collected from the experts, find a combination of parameters f and V = (v1 , ..., vn ) that minimizes B . We considered an inference to be accurate with a mean Brier score less or equal to 0.1. For brevity, in this paper, we only show the process to define one NPT. We created a webpage§ to present the data collected to define all the NPTs. Product increment quality has two attributes: Sprint progress and Scope definition. Therefore, we created a truth table with the possible combination of the extreme values of both attributes to § https://mirkoperkusich.wordpress.com/2015/05/18/second-experience-npt-calibration-data/
c 2015 John Wiley & Sons, Ltd. Copyright Prepared using smrauth.cls
J. Softw. Evol. and Proc. (2015) DOI: 10.1002/smr
32
PERKUSICH ET AL.
perform “what if” analysis with the expert. We present the truth table in Table II. By analyzing Table II, we concluded that if any of the attribute’s value is low, Product increment quality tends to be low. Therefore, we decided to use WMIN function with the same weights for both attributes. Empirically, we chose the weights to be 5 and σ 2 = 0.0005, because we observed that WMIN tends to be a minimum function reflecting the expert’s confidence in the results with this configuration. Table II. Truth table for Product increment quality.
A
B
C
Very high
Very high
Very high
Very low
Very low
Very low
Very low
Very high
Low
Very high
Very low
Low
5.3. Validation Since we had success validating the first version of the Bayesian network, to test the new version, we used the same ten simulated scenarios that we used to validate the first one and compared the results. A simulated scenario is defined in terms of a scenario description, input values for the independent nodes and expected values for the highest level nodes. The simulated scenarios were defined by a Scrum Master, which acted as an agile coach in the company that we performed the case studies for the first Bayesian network. For each scenario, he defined the expected results given his experience. The expected results were, initially, defined using only words. Afterwards, for the highest level nodes, the expected calculated values (i.e., hypotheses) were defined. For brevity, this paper limits itself to present the analysis of only one of the scenarios used to test the model. We created a webpage¶ to present all the calculate data from the scenarios. This
¶ https://mirkoperkusich.wordpress.com/2015/05/18/second-experience-validation-results/
c 2015 John Wiley & Sons, Ltd. Copyright Prepared using smrauth.cls
J. Softw. Evol. and Proc. (2015) DOI: 10.1002/smr
33
States Node
Bad
Moderate
Good
Project progress
100%
0%
0%
Product Owner overall work quality
50%
50%
0%
Product increment quality
0%
100%
0%
Work validation quality
100%
0%
0%
Table III. Expected values for highest level nodes in the first version of the Bayesian network.
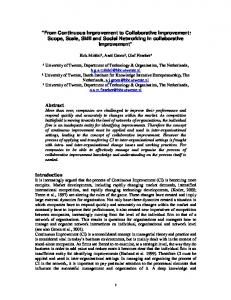
scenario represents a Scrum software development project that has a highly capable and organized development team, but does not have a person committed and skilled to play the role of the Product Owner. Furthermore, the stakeholders do not collaborate closely with the team. The expected result for this project is to have a small chance of reaching its goals, and the major reasons for the failure are the Product Owner low work quality and lack of proper work validation. In Table III, we present the expected values for the highest level nodes. After defining this scenario, we defined the values for the input nodes in the model and ran it on AgenaRisk. In Table IV, we present the values for the nodes Project progress and its parent nodes, which are the most important nodes for the initial analysis, for the first version of the Bayesian network. In Table V, we present the values for the second version. Even though we used 5-point scale in the second version, in both tables, to ease the comparison, we present data using 3-point scale, as in the first version. To compare the accuracy of the both models, we compared the mean Brier score given the four nodes highest level nodes. For the first version, the mean Brier score was 0.558; for the second version, 0.002. Since the Brier score is lower for the second version, we can conclude that it is more accurate in this scenario. We followed the same process for the remaining scenarios. In Figure 27, we present a boxplot of the mean Brier score for all scenarios. By analyzing the boxplot, we can conclude that the new version has a better accuracy. c 2015 John Wiley & Sons, Ltd. Copyright Prepared using smrauth.cls
J. Softw. Evol. and Proc. (2015) DOI: 10.1002/smr
34
0.0
0.2
0.4
0.6
0.8
1.0
PERKUSICH ET AL.
First version
Second version
Figure 27. Boxplot of the mean Brier score for all scenarios.
States Node
Bad
Moderate
Good
Project progress
6%
86%
8%
Product Owner overall work quality
20%
77%
3%
Product increment quality
1%
62%
37%
Work validation quality
13%
85%
2%
Table IV. Scenario results for highest level nodes in the first version of the Bayesian network.
By analyzing both tables, we concluded that the results from the second model is better, because it emphasizes with more confidence that the project progress is not going well, as it was expected, and the biggest reasons for it are the bad work validation process and bad quality of work performed by the Product Owner. By analyzing the values of the nodes Work validation, Product Owner work quality and their parents, the Scrum Master can observe which problems are the major sources for having the current values on the node Project progress and use this information to lead the project to improve the chances of succeeding. c 2015 John Wiley & Sons, Ltd. Copyright Prepared using smrauth.cls
J. Softw. Evol. and Proc. (2015) DOI: 10.1002/smr
35
States Node
Bad
Moderate
Good
Project progress
80%
20%
0%
Product Owner overall work quality
54%
46%
0%
Product increment quality
15%
83%
2%
Work validation quality
80%
20%
0%
Table V. Scenario results for highest level nodes in our second version of the Bayesian network.
5.4. Threats to validity The internal and construct threats to validity are related to the NPTs calibration. Since the Bayesian network is large, the expert might have reacted differently as time passed. Furthermore, the expert was chosen due to availability, not randomly. Therefore, the fact that we were able to, given the collected data, calibrate the NPTs, might have been coincidence. Furthermore, since the NPTs were calibrated by only one person, they are biased by his experience and opinions. The external threats to validity are related with the simulated scenarios defined to validate the model. Since they were defined by one person, they might not be enough to generalize that the model is suited to detect process problems in all situations of Scrum projects. On the other hand, since we performed a case study with the first version of the Bayesian network, it is an indicator that our models can help Scrum teams to continuously improve.
6. CONCLUSION
In this paper, we presented the process to build a Bayesian network to assist on empirical software process management of Scrum projects. The goal of the proposed model is to assist on the continuous improvement by considering technical and managerial best practices and process metrics. Scrum Masters should use them to perform assessment and predictions to gain knowledge and help the team to improve. c 2015 John Wiley & Sons, Ltd. Copyright Prepared using smrauth.cls
J. Softw. Evol. and Proc. (2015) DOI: 10.1002/smr
36
PERKUSICH ET AL.
We presented details regarding the process executed to build the first version of the Bayesian network, which was evaluated with an industrial case studies, as presented in Perkusich et al [36]. We discussed limitations of the first model such as not considering key agile practices, metrics and unnecessary complexity to define the Bayesian network’s NPT. Furthermore, we presented a new model that we built by modifying the first version and implementing improvements. We successfully validated it with ten simulated scenarios and concluded that it adequately models Scrum projects from the viewpoint of the Scrum Master. In a survey presented by VersionOne [48], the leading cause (44%) of failed agile projects is the lack of experience with agile methods. Therefore, we encourage practitioners to use the model as a tool to assess the process and identify early the factors that need improvement. Furthermore, in the same study, 42% of the respondents point to company culture at odds with core agile values as the leading cause of failed projects. By using the models presented in this paper, practitioners can collect and record data of agile projects as a source of information to show agile advantages to upper management and change the company’s culture. In this paper, we presented generic models, because they consider best practices of the industry. However, for a practice to be effective, it depends on the context of the project (e.g., organization culture). To adapt to a specific context, practitioners recommend agile processes tailoring [3]. As presented in Section 5, the second version of the Bayesian network was built by modifying the first one and its inferences have improved accuracy. This shows that using Bayesian networks as the modeling tool allows the model to be easily modified. This way, we conclude that the model is flexible and in conformance with process tailoring, which is a common practice in the software industry. Even though we applied more metrics that can be automatically collected by tools (i.e., objective) in our second experience, their interpretation is still subjective. In this case, by interpretation, we mean translating the metric from a numeric scale to an ordinal scale. For instance, define that 35% of test coverage is Bad. This is due to the fact that the thresholds that were defined in the numeric scale and used to convert it to an ordinal scale were set manually given the practitioner’s experience
c 2015 John Wiley & Sons, Ltd. Copyright Prepared using smrauth.cls
J. Softw. Evol. and Proc. (2015) DOI: 10.1002/smr
37 (i.e., subjective). Given this, we need to evaluate using numeric variables in the Bayesian network or applying techniques such as the ones presented in Foucault et al. [17] and Shatnawi [41] to automatically define thresholds given historical data and statistics. Currently, we are working on automating the process of building NPTs to reduce the subjectivity and performing case studies in real projects to validate our second model. For future works, we intend to integrate the model construction with an agile model tailoring framework such as AMQuICk [3]. Furthermore, we intend to integrate our model with performance measurement models such as the ones presented in Hearty et al. [21], which forecasts productivity, and Wagner et al. [49], which assesses the product quality. With this, we will unify continuous improvement and Key Performance Indicators assessment.
REFERENCES
1. M. Abouelela and L. Benedicenti. Bayesian network based xp process modelling. International Journal of Software Engineering and Applications, 1(3):1–15, 2010. 2. D. J. Anderson. Successful Evolutionary Change for Your Technology Business. Blue Hole Press, 1 edition, 4 2010. 3. H. Ayed, N. Habra, and B. Vanderose.
Am-quick: A measurement-based framework for agile methods
customisation. In Software Measurement and the 2013 Eighth International Conference on Software Process and Product Measurement (IWSM-MENSURA), 2013 Joint Conference of the 23rd International Workshop on, pages 71–80, Oct 2013. 4. K. Beck. Extreme Programming Explained: Embrace Change. Addison-Wesley, 1 edition, 11 2000. 5. I. Ben-Gal. Bayesian Networks. John Wiley and Sons, 2007. 6. G. W. Brier. Verification of forecasts expressed in terms of probability. Monthly Weather Review, 78(1):1 – 3, 1950. 7. A. S. Campanelli and F. S. Parreiras. Agile methods tailoring a systematic literature review. Journal of Systems and Software, 110:85 – 100, 2015. 8. M. Cohn. Succeeding with Agile: Software Development Using Scrum. Addison-Wesley Professional, 1 edition, 11 2009. 9. A. C. de Melo and A. J. Sanchez. Software maintenance project delays prediction using bayesian networks. Expert Systems with Applications, 34(2):908 – 919, 2008. 10. M. A. de Oliveira, O. Possamai, L. V. Dalla Valentina, and C. A. Flesch. Applying bayesian networks to performance forecast of innovation projects: A case study of transformational leadership influence in organizations c 2015 John Wiley & Sons, Ltd. Copyright Prepared using smrauth.cls
J. Softw. Evol. and Proc. (2015) DOI: 10.1002/smr
38
PERKUSICH ET AL.
oriented by projects. Expert Systems with Applications, 39(5):5061–5070, 2012. 11. V.-P. Eloranta, K. Koskimies, and T. Mikkonen. Exploring scrumbutan empirical study of scrum anti-patterns. Information and Software Technology, 74:194 – 203, 2016. 12. C.-F. Fan and Y.-C. Yu. Bbn-based software project risk management. Journal of Systems and Software, 73(2):193– 203, Oct. 2004. 13. N. Fenton, P. Krause, and M. Neil. Software measurement: uncertainty and causal modeling. Software, IEEE, 19(4):116–122, 2002. 14. N. Fenton and M. Neil. Risk Assessment and Decision Analysis with Bayesian Networks. CRC Press, 5 edition, 11 2012. 15. N. E. Fenton, M. Neil, and J. G. Caballero. Using ranked nodes to model qualitative judgments in bayesian networks. IEEE Trans. on Knowl. and Data Eng., 19(10):1420–1432, Oct. 2007. 16. R. M. Fontana, I. M. Fontana, P. A. da Rosa Garbuio, S. Reinehr, and A. Malucelli. Processes versus people: How should agile software development maturity be defined? Journal of Systems and Software, 97:140 – 155, 2014. 17. M. Foucault, M. Palyart, J.-R. Falleri, and X. Blanc. Computing contextual metric thresholds. In Proceedings of the 29th Annual ACM Symposium on Applied Computing, SAC ’14, pages 1120–1125, New York, NY, USA, 2014. ACM. 18. N. Friedman, D. Geiger, and M. Goldszmidt. Bayesian network classifiers. Machine Learning, 29(2-3):131–163, 1997. 19. S. Grapenthin, S. Poggel, M. Book, and V. Gruhn. Improving task breakdown comprehensiveness in agile projects with an interaction room. Information and Software Technology, 67:254 – 264, 2015. 20. M. Griffiths. PMI-ACP Exam Prep. RMC (Rita Mulcahy Companies) Publications, 2012. 21. P. Hearty, N. Fenton, D. Marquez, and M. Neil. Predicting project velocity in xp using a learning dynamic bayesian network model. Software Engineering, IEEE Transactions on, 35(1):124–137, 2009. 22. Y. Hu, X. Mo, X. Zhang, Y. Zeng, J. Du, and K. Xie. Intelligent analysis model for outsourced software project risk using constraint-based bayesian network. Journal of Systems and Software, 7(2):440 – 449, 2012. 23. S. S. Inc. Peer code review: An agile process. http://smartbear.com/SmartBear/media/pdfs/WP-CC-Peer-CodeReview-An-Agile-Process.pdf, 2013. Accessed: 2013-04-18. 24. P. M. Institute. PMBoK: Project Management Body of Knowledge. Project Management Institute, 5 edition, 1 2013. 25. K. Jeet, N. Bhatia, and R. S. Minhas. A bayesian network based approach for software defects prediction. SIGSOFT Softw. Eng. Notes, 36(4):1–5, Aug. 2011. 26. K. Jeet, N. Bhatia, and R. S. Minhas. A model for estimating the impact of low productivity on the schedule of a software development project. SIGSOFT Softw. Eng. Notes, 36(4):1–6, Aug. 2011. 27. K. Jinzenji, T. Hoshino, L. Williams, and K. Takahashi. An experience report for software quality evaluation in highly iterative development methodology using traditional metrics. In Software Reliability Engineering (ISSRE), 2013 IEEE 24th International Symposium on, pages 310–319, Nov 2013. c 2015 John Wiley & Sons, Ltd. Copyright Prepared using smrauth.cls
J. Softw. Evol. and Proc. (2015) DOI: 10.1002/smr
39 28. E. Kupiainen, M. V. Mntyl, and J. Itkonen. Using metrics in agile and lean software development a systematic literature review of industrial studies. Information and Software Technology, 62:143 – 163, 2015. 29. E. Lee, Y. Park, and J. G. Shin. Large engineering project risk management using a bayesian belief network. Expert Systems with Applications, 36(3, Part 2):5880 – 5887, 2009. 30. A. Nagy, M. Njima, and L. Mkrtchyan. A bayesian based method for agile software development release planning and project health monitoring. In Intelligent Networking and Collaborative Systems (INCOS), 2010 2nd International Conference on, pages 192–199, 2010. 31. M. Neil, N. Fenton, and L. Nielson. Building large-scale bayesian networks. Knowl. Eng. Rev., 15(3):257–284, Sept. 2000. 32. J. Pearl and S. Russell. Bayesian networks. Handbook of brain theory and neural networks, 1995. 33. P. Pendharkar, G. Subramanian, and J. Rodger. A probabilistic model for predicting software development effort. Software Engineering, IEEE Transactions on, 31(7):615–624, 2005. 34. M. Perkusich, H. O. de Almeida, and A. Perkusich. A model to detect problems on scrum-based software development projects. In Proceedings of the 28th Annual ACM Symposium on Applied Computing, SAC ’13, pages 1037–1042, New York, NY, USA, 2013. ACM. 35. M. Perkusich, A. Perkusich, and H. Almeida. Using survey and weighted functions to generate node probability tables for Bayesian networks. In Proceedings of BRICS-CCI 2013, 2013. 36. M. Perkusich, G. Soares, H. Almeida, and A. Perkusich. A procedure to detect problems of processes in software development projects using bayesian networks. Expert Systems with Applications, 42(1):437 – 450, 2015. 37. K. Petersen and C. Wohlin. A comparison of issues and advantages in agile and incremental development between state of the art and an industrial case. Journal of Systems and Software, 82(9):1479 – 1490, 2009. SI: {QSIC} 2007. 38. R. Pichler. Agile Product Management with Scrum: Creating Products that Customers Love. Addison-Wesley Professional, 1 edition, 4 2010. 39. K. Schwaber. Scrum is hard and disruptive. http://www.verheulconsultants.nl/ScrumIsHardandDisruptive.pdf, 2006. Accessed: 2013-11-26. 40. D. Settas, S. Bibi, P. Sfetsos, I. Stamelos, and V. Gerogiannis. Using bayesian belief networks to model software project management antipatterns. In Software Engineering Research, Management and Applications, 2006. Fourth International Conference on, pages 117–124, 2006. 41. R. Shatnawi. Deriving metrics threshold using log transformation. Journal of Software Evolution and Process, 27:95–113, 2015. 42. I. Stamelos. Software project management anti-patterns. Journal of Systems and Software, 83(1):52 – 59, 2010. 43. I. Stamelos, L. Angelis, P. Dimou, and E. Sakellaris. On the use of bayesian belief networks for the prediction of software productivity. Information and Software Technology, 45(1):51 – 60, 2003. 44. V. Stray, D. I. Sjberg, and T. Dyb. The daily stand-up meeting: A grounded theory study. Journal of Systems and Software, 114:101 – 124, 2016. c 2015 John Wiley & Sons, Ltd. Copyright Prepared using smrauth.cls
J. Softw. Evol. and Proc. (2015) DOI: 10.1002/smr
40
PERKUSICH ET AL.
45. V. G. Stray, N. B. Moe, and T. Dyb˚a. Agile Processes in Software Engineering and Extreme Programming: 13th International Conference, XP 2012, Malm¨o, Sweden, May 21-25, 2012. Proceedings, chapter Escalation of Commitment: A Longitudinal Case Study of Daily Meetings, pages 153–167. Springer Berlin Heidelberg, Berlin, Heidelberg, 2012. 46. J. Sutherland and K. Schwaber. The scrum guide. http://www.scrumguides.org/docs/scrumguide/v1/Scrum-GuideUS.pdf, 2013. Accessed: 2016-03-02. 47. L. Uusitalo. Advantages and challenges of bayesian networks in environmental modelling. Ecological Modelling, 203(34):312 – 318, 2007. 48. VersionOne. 9th annual state of agile development survey results. http://www.versionone.com/pdf/state-of-agiledevelopment-survey-ninth.pdf, 2015. Accessed: 2015-05-05. 49. S. Wagner, K. Lochmann, L. Heinemann, M. Klas, A. Trendowicz, R. Plosch, A. Seidi, A. Goeb, and J. Streit. The quamoco product quality modelling and assessment approach. In Software Engineering (ICSE), 2012 34th International Conference on, pages 1133–1142, June 2012. 50. L. Williams. What agile teams think of agile principles. Commun. ACM, 55(4):71–76, Apr. 2012. 51. L. Zhang, X. Wu, L. Ding, M. J. Skibniewski, and Y. Yan. Decision support analysis for safety control in complex project environments based on bayesian networks. Expert Systems with Applications, 40(11):4273–4282, 2013. 52. H. Ziv and D. Richardson.
Constructing bayesian-network models of software testing and maintenance
uncertainties. In Software Maintenance, 1997. Proceedings., International Conference on, pages 100–109, Oct 1997.
c 2015 John Wiley & Sons, Ltd. Copyright Prepared using smrauth.cls
J. Softw. Evol. and Proc. (2015) DOI: 10.1002/smr