872
WEATHER AND FORECASTING
VOLUME 19
Association between NSSL Mesocyclone Detection Algorithm-Detected Vortices and Tornadoes THOMAS A. JONES School of Meteorology, University of Oklahoma, Norman, Oklahoma, and Department of Atmospheric Science, University of Alabama in Huntsville, Huntsville, Alabama
KEVIN M. MCGRATH
AND
JOHN T. SNOW
School of Meteorology, University of Oklahoma, Norman, Oklahoma (Manuscript received 28 August 2003, in final form 21 May 2004) ABSTRACT Nearly 100 000 vortex detections produced by the Mesocyclone Detection Algorithm (MDA) are analyzed to gain insight into the effectiveness of the detection algorithm in identifying various types of tornado-producing events. Radar and algorithm limitations prevent raw vortex detections from being very useful without further discrimination. Filtering techniques are developed to remove spurious vortex detections and discriminate between vortices that are and are not related to mesocyclones. To investigate whether various vortex detections (and their attributes) are associated with severe weather phenomena, they are compared with available tornado reports to determine if detections with certain types of attributes can be associated with tornadic events. Tornado reports are used since the ground truth tornado set is more reliable than other databases of severe weather phenomena. Basic skill scores and more advanced principal component methods are used to quantify the correlation between vortex detection attributes and tornadoes. The results of this analysis reveal that only a very small percentage (,5%) of vortex detections, using the most basic definition, are associated with the occurrence of a tornado. Percentages increase to approximately 10% as the criteria for defining a vortex detection as a mesocyclone detection become more strict; however, many tornadic events are only associated with weaker detections and are ‘‘missed’’ when the detection threshold is increased. Several velocity-derived detection attributes are shown to have weak to moderate predictive ability when determining whether a detection is (or is not) tornadic.
1. Introduction The primary goal of this work is to determine what percentage of Doppler radar–detected vortices produce tornadoes and what vortex attributes are most useful in discriminating vortices that are (and are not) associated with a tornado. Much of the previous literature including Stumpf et al. (1998), Witt et al. (1998), Marzben et al. (1999), and Mitchell et al. (2000) produced mixed results and is limited by small (or event specific) detection datasets and/or nonobjective verification methods. In contrast, this work focuses on using a large radar dataset collected from six radars over a period of nearly two years and develops new, objective, techniques in relating vortex detections to tornado reports. The Doppler capability of the Weather Surveillance Radar-1988 Doppler (WSR-88D) allows for the detecCorresponding author address: Thomas Jones, University of Alabama in Huntsville, Dept. of Atmospheric Science, Rm. 4015, 320 Sparkman Dr., Huntsville, AL 35805. E-mail:
[email protected]
q 2004 American Meteorological Society
tion of radial velocity data from which the presence of mesoscale and smaller atmospheric vortices can be observed (Burgess 1976; JDOP 1979). Some of these vortices present signatures associated with mesocyclones that are important in severe weather forecasting. Several automated algorithms have been developed to determine where in a field of velocity data mesocyclone signatures may be present, though the initial algorithms contained many limitations (Desrochers and Donaldson 1992). Beginning in the early 1990s, the National Oceanic and Atmospheric Administration (NOAA) National Severe Storms Laboratory (NSSL) began work on a vortex detection algorithm now known as the Mesocyclone Detection Algorithm (MDA; Stumpf et al. 1998). The MDA uses radial velocity data and attempts to locate areas in the velocity field that approximate a cyclonic Rankine vortex (Stumpf et al. 1998; Zrnic´ et al. 1985). However, these vortices are not necessary associated with mesocyclones or tornadoes. Determining this association requires further processing and analysis of the detection characteristics.
OCTOBER 2004
JONES ET AL.
Early mesocyclone-related research suggested that as many as 50% of radar-detected mesocyclones in supercell-type thunderstorms are tornadic (Burgess 1976; Burgess and Lemon 1991; Burgess and Doswell 1993). As research and detection algorithms evolved, the number of detections increased while the percentage of those classified as tornadic decreased. Recent literature suggests between 20% and 30% of all mesocyclone detections are considered tornadic (Burgess and Doswell 1993; Stumpf et al. 1998; Trapp and Stumpf 2002). Further research using larger, more objective datasets suggests that these numbers are overly optimistic with respect to the number of tornadic mesocyclone detections (Marzban et al. 1998; Mitchell et al. 2000). These works suggest that as few as 2% of all mesocyclone detections are tornadic using the new algorithms and definitions, significantly removed from the 50% value held as truth in the not too distant past (Burgess 1976; JDOP 1979; Burgess and Lemon 1991; Burgess and Doswell 1993; Stumpf et al. 1998). While a 50% to 2% drop in the number of detections classified as tornadic may seem excessive, it must be taken in the light that the criteria for ‘‘detecting’’ a mesocyclone have changed significantly over the years. Early works by Burgess and others primarily observed supercell-type thunderstorms in Oklahoma. The criteria for a ‘‘mesocyclone’’ detection were set high so that vortices not associated with the primary mesocyclone did not contaminate the results. Current detection algorithms, such as the MDA, use much lower threshold criteria and more robust diagnosis techniques to produce a detection. However, the MDA in particular is designed to pick up vortices that are not necessarily associated with a classic tornado-producing mesocyclone (Stumpf et al. 1998). Thus, a detection dataset produced by the MDA will contain more than just mesocyclone detections. Various definitions exist as to when a ‘‘vortex’’ detection becomes a mesocyclone detection. The most common and accepted definition is when a vortex detection reaches the strength criteria first used by Burgess (1976). Hereafter, ‘‘vortex detections’’ refers to all detections produced by the MDA while the term ‘‘mesocyclone detections’’ is reserved for detections that pass through various quality control filters and exceed certain strength thresholds. For the purposes of this work, the thresholds are set low so that only very weak vortex detections are not retained as mesocyclone detections. Several different strength thresholds are applied in the upcoming analysis to determine an optimum threshold at which to define a vortex detection as a mesocyclone detection. The MDA has many previously known and recently discovered shortcomings, some of which are possible to address after the detections are made (Stumpf et al. 1998; Mitchell et al. 2000; McGrath et al. 2002). Filtering techniques developed by Jones et al. (2002) and McGrath et al. (2002) further processed the MDA detections to correct for some of these shortcomings. Fil-
873
tering consists of combining information from additional algorithms while using assumptions about the physical relationship between mesocyclones and their parent storms to discriminate between detections not associated with atmospheric phenomena and detections that are. 2. Level-II data processing a. Algorithm processing Processing WSR-88D level-II data through the Warning Decision Support System II (WDSS II), which includes the necessary detection algorithms, produces the vortex detection datasets (NSSL 2000; Lakshmanan 2002). The algorithm code within WDSS II reflects the algorithm code planned for implementation in the latest WSR-88D software build (G. J. Stumpf 2001, personal communication). b. Proper adaptable parameter settings The set of algorithm-adaptable parameters recommended for operational use by NSSL are used for all level-II processing. Important parameters for the MDA include a minimum velocity difference threshold of 10 m s 21 for detection of a mesocyclone and a 0-dBZ threshold for which velocity data associated with lower reflectivities are ignored. Previous studies of MDA output indicated that lower threshold values (5 m s 21 or 220 dBZ) for either of these two parameters led to an increase in the number of vortex detections recorded (Stumpf et al. 1998). However, many of these additional detections do not represent identifiable atmospheric phenomena and are a result of artifacts and ambiguities present in the level-II data. Higher thresholds for the velocity and reflectivity parameters (20 m s 21 or 20 dBZ) can cause the MDA to fail to detect many stronger (and physically more significant) vortices. c. Raw vortex detection A raw vortex detection is hereafter defined as any and all detections produced by the MDA from the data processed. Each detection is defined as an independent entity in time and space; thus, the same vortex detected over three volume scans is defined as three separate vortex detections. The ability of the MDA to track detections, often referred to as trend information, from one volume scan to the next has been shown to be unreliable (G. J. Stumpf 2001, personal communication). No attempt is made to combine individual 3D vortex detections into 4D vortex detections. Since time continuity is not factored in, the number of vortex detections counted do not represent the true number of vortices that occur in nature. The number of detections far exceeds the number of true vortex occurrences (Mitchell et al. 2000; Jones et al. 2002; Trapp and Stumpf 2002).
874
WEATHER AND FORECASTING
VOLUME 19
No attempt is made to combine detections of the same mesocyclone from multiple radars into a single detection. The analysis techniques presented in section 4 take into account the attributes of all detections associated with a tornado no matter from which radar they originate, greatly simplifying the analysis process. d. Volume coverage pattern issues The WSR-88D radar has several 3D scanning strategies, or volume coverage pattern (VCP) modes, each of which has different vertical and temporal resolutions. The VCP mode in which a radar operates is quite important with respect to the number of mesocyclones detected as well as to the values of the associated mesocyclone attributes. The two precipitation modes that are relevant for this work (VCP11 and VCP21) differ in the number of elevations scanned and the time it takes to complete a volume scan. VCP11 is the faster scanning mode taking 5 min to scan 14 different elevations while VCP21 takes 6 min to scan nine elevations. Since VCP11 is faster and of higher resolution, more mesocyclones are detected given a specific event if the radar is in VCP11 rather than VCP21. Another potential effect of the different VCPs on vortex detections is that vortex attributes may be significantly different between one or the other scanning strategies. A sensitivity study undertaken by Brown et al. (2000) analyzed a severe weather case recorded in VCP11 and removed certain elevations from these data to produce a volume scan similar to VCP21. Results revealed that the VCP11 dataset contained approximately 5% more detections that the pseudo-VCP21 dataset, a direct result of the greater vertical resolution of VCP11 data. For detections made in both VCPs, the attributes of the VCP11 mesocyclone detections were stronger (in terms of maximum velocity values) approximately 10% of the time. However, the degree of detection strength underestimation in VCP21 data was relatively small; thus, the overall statistics on comparing VCP11 and VCP21 data should not be compromised. 3. Filtering a. Detection issues The concentration of vortex detections is not homogeneous with respect to range from the radar (Mitchell et al. 2000; McGrath et al. 2002). Near a particular radar site, the concentration of raw mesocyclone detections is much greater than farther away. This is due to the MDA being able to detect smaller-scale vortices near the radar since the bin resolution is much finer. Many vortices detected near the radar are weak and can be easily removed from the detection dataset, as they are not likely to be associated with severe weather (Figs. 1a and 1b). These detections are removed by filtering out those with a mesocyclone rank (MR) equal to zero,
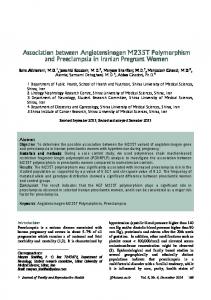
FIG. 1. Plots of KAMA mesocyclone detections from 1500 UTC 2 May to 0000 UTC 4 May 2001. (a) The raw set of detections. A high concentration of very weak detections (smallest dots) is located close to the radar site. (b) The detections retained after filtering MR 5 0 and MESOpRANGE 5 147 km detections. Note the region of spurious detections concentrated between 20 and 70 km northwest of the radar site. (c) The detections remaining after passage through the SCIT filter. Most of the anomalous detections (which result from improperly dealiased ground clutter), which were obscuring legitimate mesocyclones, have now been removed.
OCTOBER 2004
JONES ET AL.
which is indicative of a vortex with a maximum velocity difference of only 10 m s 21 . (Appendix A provides a brief description of MR and other detection attributes.) Operational practice defines a vortex detection as a mesocyclone detection only when MR $ 3 or even MR $ 5. These higher strength values represent ‘‘operationally oriented’’ definitions of a mesocyclone detection (D. W. Burgess 2002, personal communication). These and additional definitions are analyzed below. Another common vortex detection issue that requires correction includes dealiasing errors apparent at certain range rings given specific combinations of volume coverage patterns (VCPs) and pulse repetition frequencies (PRFs). These errors can lead to a large number of anomalous detections, which appear as a ‘‘ring’’ of mesocyclone detections at a specific range from the radar most commonly occurring at a range of 147 km (Mitchell et al. 2000; McGrath 2002). Other rings also have been observed with much less frequency at 116, 126, and 136 km, respectively. The frequency of false detections at the ;147 km range ring is so significant that simple removal of all detections at that range seems warranted as the number of true detections that may be lost is many times less than the number of anomalous detections (McGrath et al. 2002). Anomalous detections in the less common rings are not removed as their frequency is such that they should not impact the results. b. SCIT filtering Vortex detections induced by ground clutter returns or other forms of anomalous propagation have proven to be the most significant issue in creating large vortex detection datasets (Lee and White 1998; McGrath et al. 2002). Removing very weak detections and those at certain range rings proved ineffective in removing all anomalous detections. There are no attributes provided by the MDA that can give a reliable determination of whether a vortex detection is a result of these anomalies. Information from the Storm Cell Identification and Tracking (SCIT) algorithm is used in conjunction with MDA output to make a determination on whether a vortex detection is associated with real atmospheric phenomena (Johnson et al. 1998). Vortex detections remaining after the initial filtering step, shown in Fig. 1b, are tested to determine whether or not a SCIT-detected storm cell is located within a search radius of 12 km from a vortex detection. The assumption is made that vortices related to a mesocyclone should be associated with a storm detectable by the SCIT algorithm. Since the SCIT algorithm detects the centeroids of storm cells using reflectivity information alone, it should not detect storm cells in and around vortex detections produced from improperly dealiased velocity data in low-reflectivity regions (McGrath et al. 2002). A vortex detection is removed from the dataset if a storm cell cannot be found within a
875
predetermined range from the vortex detection during the same volume scan (Fig. 1c). All vortex detections remaining after filtering are defined as mesocyclone detections. 4. Association of vortex detections with tornadoes a. Tornado dataset Since a ‘‘ground truth’’ dataset for mesocyclones is impractical to produce given current meteorological tools, another ground truth dataset that can be associated with mesocyclones must be used to verify the significance of the mesocyclone detection attributes. The most readily available ground truth severe weather dataset is composed of reports of tornadoes, which many previous works have shown to be associated with mesocyclone detections (Burgess 1976; JDOP 1979; Stumpf et al. 1998; Witt et al. 1998). Only a small percentage of mesocyclones produce tornadoes; however, these ‘‘tornadic’’ mesocyclone may have inherent characteristics that set them apart from non-tornado-producing detections (Stumpf et al. 1998). Detection attributes produced by the MDA may offer a method to make this distinction. Mesocyclone detections are compared against tornado reports in the hope that at least some detection attributes (or a combination thereof ) do show skill at discriminating between tornado-producing and non-tornado-producing detections. Every effort is made to correct the many issues associated with ground truth tornado reports contained in the basic database maintained by the Storm Prediction Center (SPC). Unlike previous algorithm verification works such as Stumpf et al. (1998) and Witt et al. (1998), radar data are not used as a guide to correct the tornado dataset to maintain as independent of a ground truth dataset as possible. Still no tornado dataset can be made perfect, as an unknown number of tornadoes are not reported. One must make an assumption that the number of missed reports is low compared to the total number of reported tornadoes. Otherwise, no meaningful analysis using a tornado dataset could be carried out. Missed tornado reports reduce the number of vortex detections that have the opportunity to be declared tornadic. The result is an underestimation of the number of tornadic detections. Unfortunately, the magnitude of the underestimation remains an unknown. b. Spatial association A beginning and ending location define each tornado track. For short-lived, weak tornadoes these locations are often the same. Since only the beginning and ending locations of a tornado track are recorded, the precise path the tornado took between those points must be interpolated. All tornado tracks are assumed to be linear and any curvature in a tornado track is ignored.
876
WEATHER AND FORECASTING
A symmetric spatial search window around the entire tornado track is defined so that mesocyclone detections occurring within a predetermined search radius from that track are deemed tornadic. Research by Burgess and Lemon (1991) and Jones et al. (2002) suggests that a 10-km search window from the tornado track should be adequate. The search area is extended in the opposite direction of storm motion prior to the beginning location of the tornado. A corresponding extension exists at the ending location. The distance for the extensions of the spatial search window is based on approximate storm motion and the size of the temporal window (described below). Storm motion (speed and direction) for a particular tornadic event is computed using the average distance and direction moved during the lifetime of long-track (AGE . 30 min) mesocyclone detections. c. Temporal association The temporal window is based upon those defined in previous works such as Witt et al. (1998) and Stumpf et al. (1998). These works defined a temporal window of 20 min before the begin time of a tornado report to 6 min after the end time to search for tornadic detections. (From a WSR-88D perspective, this window is roughly four volume scans before a tornado report and roughly one after.) The window is not symmetric since it is designed to account for the predictive ability of mesocyclone detections before a tornado actually formed. The end of the temporal window is designed to take into account temporal errors in the reported end time of a tornado. An enlarged window of 230 min to 110 min is used here to better take into account the temporal errors present in both datasets. Temporal errors associated with the tornado reports are mainly due to errors in reporting and the reporter’s lack of an accurate time. Temporal errors in the mesocyclone detection dataset may be a result of the WSR-88D having an incorrect time stamp. Experience suggests that the date and time stamp on a particular volume scan of data could be off as much as several minutes from the ‘‘true’’ time. Unfortunately, it is not possible to reliably correct for all temporal errors in either the mesocyclone or tornado data using postanalysis techniques. d. Tornadic mesocyclone dataset After spatial and temporal analyses have been completed, mesocyclone detections that survive both tests are hereafter defined as tornadic mesocyclone detections. Those that do not are defined as null mesocyclone detections. One result of automating this process is that multiple mesocyclone detections of various strengths near a tornado report can be classified as tornadic. Stumpf et al. (1998) only considers the strongest one or two detections near a tornado report as the tornadic detections; thus, the results presented here have a larger
VOLUME 19
number of tornadic detections than if the analysis were done by hand. 5. Statistics a. Contingency matrix A tornado is defined as a binary event with one representing a tornado report and zero representing no tornado; thus, an appropriate style of diagnostic verification is the one based on the two-by-two contingency matrix, C (Wilks 1995). The matrix contains four different variables (a, b, c, and d). Where a represents the number of correct yes predictions (hits), b represents the number of incorrect yes predictions (false alarms), c represents the incorrect no predictions (misses), and d represents the correct no predictions (Stumpf et al. 1998): C5
1c d2 . a
b
(1)
Matrix variables are calculated by allowing the threshold value for a particular mesocyclone detection attribute to vary while recording the values of the C matrix at predetermined intervals. The best threshold value for a particular attribute could be found where a and d are maximized and b and c are minimized. For example, using the attribute MSI, the C matrix is computed using threshold values of 0–10 000 with a step interval of 100. A correct forecast (hit) occurs when a tornado is predicted above a certain MSI threshold (e.g., 3000) and a tornado is actually reported to be associated with that particular detection. If a tornado is not associated with a particular detection with MSI . 3000, then that detection is declared a ‘‘false alarm.’’ If a tornado is associated with a mesocyclone with MSI , 3000, then a no-tornado prediction (miss) is made based upon that threshold. Finally, if no tornadoes are associated with detections with MSI , 3000, then they are classified as correct no predictions. In determining values for C, the possibly of a tornado not being associated with any mesocyclone detection is ignored. The argument can be made that if there is no detection (and no associated attributes), no forecast can be made based on mesocyclone detections. The remainder of this work focuses on determining the skill of various mesocyclone attributes associated with detected mesocyclones. Scoring parameters based on the C matrix include probability of detection (POD), false alarm rate (FAR), critical success index (CSI), and Heidke skill score (HSS). Each scoring parameter is described in detail in appendix B. POD, FAR, CSI, and HSS are calculated for a range of threshold values for several mesocyclone detection attributes listed in Table 1. Appendix A provides a brief description of these attributes. Skill scores from selected attributes are discussed in section 7.
OCTOBER 2004
877
JONES ET AL.
TABLE 1. Mesocyclone detection attributes included in PCA are listed. Full description of each attribute is given in appendix A. Underlined attributes are those for which figures of their respective skill at tornado prediction are shown. Also shown is the principal component (PC) dimension each attribute falls into following PCA. Note that the dimension values are the same for both the 2000 and 2001 PCA detection datasets. Name
PC
JULIANpTIME* MESOpAZM (08–3608) MESOpRANGE (km, 0–230) CIRCpTYPE (0–2) BASE (m, 0–12 000) DEPTH (m, 0–13 000) MR (0–25) LLDIA (m, 0–15 000) MXDIA (m, 0–15 000) HMXDIA (m, 0–12 000) LLRV (m s21, 0–65) MXRV (m s21, 0–65) HMXRV (m, 0–12 000) LLSHEAR (1023 s21, 0–175) MXSHEAR (1023 s21, 0–175) HMXSHEAR (m, 0–12 000) LLGTGVD (m s21, 0–130) MXGTGVD (m s21, 0–130) HMXGTGVD (m, 0–12 000) COREpBASE (m, 0–12 000)
NA NA PC3 PC1 PC2 PC2** PC1 PC3 PC3** PC2 PC1 PC1 PC2 PC3** PC3** PC2 PC1 PC1 PC2 PC2
Name COREDEPTH (m, 0–9000) AGE (min, 0–200) MSI (0–13 000) MSIR (0–25) RELpDEPTH (0%–100%) LLCON (m s21, 0–70) MIDCON (m s21, 0–70) NSSLpMCLASS (0–2) NWSpMCLASS (0–2) PLpMCLASS (0–2) LTpMESO (0–2) NNTORN (0%–100%) NNSEVERE (0%–100%) V1pRV (m s21, 0–40) V1pSHEAR (1023 s21, 0–100) V1pGTGVD (m s21, 0–60) MpVORTpCLASS (1–5) VCP (211 or 221) NWSpIRS (2185–51 790) MSIpIRS (0–7490)
PC PC3 PC1 PC1 PC1 PC1 PC3** PC2** PC1 PC1** PC3 PC2 PC1 PC1 PC1 PC3** PC1 PC1 NA PC1** PC1
* JULIANpTIME represents a pseudo-attribute calculated from raw date and time attributes. ** Attribute incorporated into two or more dimensions; PC dimension with the largest loading value listed.
b. Principal component analysis The eigen technique of principal components (PCs) enables the large attribute datasets to be reduced in size to a more manageable number of new variables (or PC scores). An advantage of applying principle component analysis (PCA) is that these new variables can combine information from several correlated attributes producing a smaller number of independent variables, assuming uncorrelated vectors are maintained throughout the entire PC process. Combining highly correlated attribute information into fewer PC scores should produce var-
iables that have a greater ability at a certain threshold to predict the occurrence of tornadoes (Jones et al. 2002). Prior to undertaking PCA, 4D (or trend related) mesocyclone detection attributes (with the exception of the mesocyclone AGE attribute) are removed from the datasets as trend information is deemed unreliable. Environmental attributes are also not included in PCA as the required environmental data were not made available to the authors; thus, only ‘‘place holder’’ values actually exist in the detection datasets. A total of 40 raw attributes are retained, from which PC scores are calculated (Table 1). Appendix B describes the PCA process in detail and the criteria used to determine the proper number of scores. 6. Radar and tornado data a. Level-II data
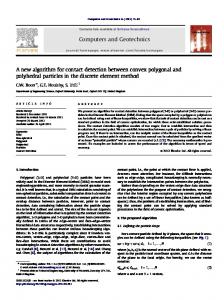
FIG. 2. Geographical locations of the six radars for which level-II data were collected for this research during 2000 and 2001. Rings represent the maximum detection range (234 km) from each radar for which velocity data are available.
WSR-88D level-II data were recorded using methods developed by the Collaborative Radar Acquisition Field Test experiment (CRAFT; Droegemeier et al. 2002). Radars from which data were gathered and processed include Amarillo, Texas, KAMA; Fort Worth, Texas, KFWS; Tulsa, Oklahoma, KINX; Lubbock, Texas, KLBB; Fort Smith, Arkansas, KSRX; and Twin Lakes, Oklahoma, KTLX (Fig. 2). These data represent the period from February 2000 to December 2001 for all six radars. For the 2000 data, approximately 360 h of data are processed representing only a portion of the convective cases for that year and are biased toward convective
878
WEATHER AND FORECASTING
TABLE 2. Tornado data for 2000 and 2001 acquired from the SPC smooth-log database broken up into two separate datasets. Note that the 2001 dataset contains many more tornado reports than the 2000 dataset which is a result of the 2001 level-II dataset being much more complete. Also note that no violent (F4 or F5) tornadoes were observed by the six radars during this 2-yr period. Year
Count
F0
F1
F2
F3
2000 2001
31 145
23 85
5 41
1 15
2 4
events near the KFWS radar. As a result, the concentration of vortex detections is somewhat biased toward KFWS. The only limitation of the 2000 dataset directly affecting this work is that the limited mesocyclone detections from the other five radars prevent single radar detection datasets from being properly analyzed. The 2001 dataset includes over 2000 h of radar data from each radar, which includes nearly all the convective events that occurred within the range of each radar during the year. Any missing events are a result of radar or communication problems that prevented the level-II data from being archived. Since the 2001 dataset is much larger, one multiradar and six single-radar detection datasets are produced. b. Tornado data The 2000 and 2001 tornado data were acquired from the SPC smooth-log severe weather database. The quality of the SPC database is enhanced by verifying date and location information for each tornado using independent data sources where available. After this quality control, 31 tornadoes are found to be observable by the processed 2000 level-II data and 145 by the processed 2001 data. No violent (F4 or F5) tornadoes occurred during either year within range of any of the six radars (Table 2). 7. Results a. Analysis of 2000 and 2001 detections 1) 2000 Processing all available radar data from 2000 produces 15 377 mesocyclone detections after filtering (Table 3). Nearly half, 7682, are detected by the KFWS radar. Since the 2000 detection dataset is biased toward KFWS, the analysis results are not truly valid over the entire southern plain domain. In fact, no tornadoes occurred within range of the KAMA radar and only one was in range of the KLBB radar. Data from both radars are still included in the verification analysis since one of the goals is to differentiate between null and tornadic cases using the mesocyclone detection attributes no matter where they are detected. Spatial and temporal analysis of the 2000 MR $ 1 dataset results in 3.69% (or 568) of the mesocyclone
VOLUME 19
T ABLE 3. Mesocyclone detections for each radar for both the MR $ 1 2000 and 2001 datasets with yearly and specific radar totals also shown. The 2001 data represent a more complete sample of the convective events for that year; thus, they produce larger numbers of detections for all radars. Detections
2000
2001
All
KAMA KFWS KINX KLBB KSRX KTLX All
674 7682 1921 604 1578 2918 15 377
13 152 11 240 15 544 8426 16 579 17 868 82 809
13 826 18 922 17 465 9030 18 157 20 786 98 186*
* All years, all radars’ mesocyclone detection count.
detections being classified as tornadic (Table 4). The large proportion of nontornadic events observed partially accounts for the very low tornadic percentage value reported. One tornado report (out of 31) has no mesocyclone detections associated with it. The missed tornado report is classified as a weak, F0 tornado that lasted less than 5 min. The possibility exists that the parent vortex of this tornado was so transitory in nature that it formed and dissipated within a single radar volume scan making it unobservable. The possibility also exists that the time of the tornado report was enough in error so that a temporal association with nearby detections could not be made. When determining attribute skill at differentiating between tornadic and nontornadic mesocyclone detections, missed tornadoes are ignored. The MSI detection attribute proves to be the best predictive attribute of those analyzed with a maximum HSS of 0.18 using an MSI threshold of 3500 followed by MR, and then NNTORN (Fig. 3; Table 5). For these attributes, POD values are below 0.3 and FAR values exceed 0.8 at the best threshold level. LLDIA (Fig. 3d) shows little, if any, skill. 2) 2001 The 2001 detection dataset consists of 82 809 mesocyclone detections after filtering. Of these detections, 1640 or 1.98% are found to be tornadic (Table 4). The TABLE 4. Total number of mesocyclone detections for all radars and those that are classified as tornadic for several different definitions of a mesocyclone detection. As the MR threshold increases, so does the percentage of remaining detections that are tornadic. Threshold
Detections
2000
MR $ 1 MR $ 3 MR $ 5 MR $ 2; AGE . 0 MR $ 1 MR $ 2; AGE . 0
15 377 5057 1260 5987
568 357 164 342
3.69 7.06 13.02 5.71
82 809 30 155
1640 999
1.98 3.31
2001
Tornadic
Percentage tornadic
Year
OCTOBER 2004
JONES ET AL.
879
FIG. 3. Variable threshold skill score plots for selected mesocyclone detection attributes from the 2000 mesocyclone detection (MR $ 1) dataset. Attributes (b) MR, (c) MXGTG, (e) MSI, and (f ) NNTORN all show some skill at various thresholds with MSI showing the greatest. (a) DEPTH and (d) LLDIA show little skill no matter what threshold value is used.
percentage of tornadic detections is somewhat lower than the 3.69% seen in the corresponding 2000 dataset. Out of 145 observable tornadoes, 17 tornado reports could not be associated with any mesocyclone detections. Most (12) of these ‘‘missed’’ tornadoes are classified as brief F0s with the remaining five being F1s. As for the case of the 2000 misses, the transitory nature of some of the parent vortices may have been unobservable by the radar. It is also likely that a few temporal and spatial errors remain for some tornado reports. All F2 and stronger tornadoes are associated with at least
one or more mesocyclone detections, consistent with Stumpf et al. (1998). Again, MSI proves to be the best predictive attribute with a maximum HSS of 0.168, which is somewhat lower than that found using the 2000 dataset (Fig. 4e; Table 6). The MSI threshold of maximum skill is also higher (4000 versus 3500). While the maximum MSI skill occurs at MSI 5 4000, the skill remains relatively constant for an MSI threshold between 3200 and 4200 with POD and FAR values varying accordingly. After MSI, MR and MXGTG prove to be the next
880
WEATHER AND FORECASTING
TABLE 5. Attribute skill, using best attribute threshold as defined by HSS, for the combined MR $ 1 2000 detection dataset. Attribute
Value
HSS
CSI
POD
FAR
DEPTH MR LLDIA MXSHEAR MXGTG MSI NNTORN PC1
10 700 6 8100 16 34 3500 14 2.3
0.093 0.154 0.022 0.054 0.128 0.178 0.138 0.185
0.068 0.102 0.040 0.052 0.092 0.119 0.098 0.122
0.129 0.181 0.158 0.136 0.227 0.245 0.252 0.229
0.875 0.811 0.950 0.923 0.866 0.813 0.861 0.794
‘‘best’’ attributes with maximum HSS values of 0.166 and 0.136, respectively, ranging from 0.015 to 0.02 below the corresponding 2000 values (Table 6). For all attributes, the best threshold values are higher (stronger) that those for the MR $ 1 2000 dataset. Attributes such as LLDIA and DEPTH again show virtually no skill. b. Redefining a mesocyclone detection 1) 2000 Previously, only very weak vortex detections (MR 5 0) and detections that did not pass the filtering criteria discussed in section 3 were not classified as mesocyclone detections. Previous research has suggested that a stricter definition of a mesocyclone detection is warranted (Burgess et al. 1993). Early work by Burgess only classified vortex detections as mesocyclone if they met or exceeded what is now the attribute value of MR 5 5. With a stricter definition, a greater proportion of detections are likely to be tornadic though a price is paid as some tornadoes may not be associated with such strong mesocyclones. Applying higher detection thresholds of MR $ 3 and MR $ 5 to the 2000 MR $ 1 dataset produces datasets that do not include the weaker detections. As the MR threshold increases, the number of detections decreases sharply. Using a threshold of MR $ 3 eliminates detections associated with three more tornadoes (in addition to the one miss using the MR $ 1 threshold). Using a threshold of MR $ 5 results in 3 additional tornadoes being missed, for a total of 7 out of the 31 reported tornadoes for 2000. As the MR threshold increases, the percentage of detections that are tornadic increases sharply from 3.69% using the MR $ 1 threshold to 13.02% using the MR $ 5 threshold (Table 4). Removing weaker detections results in a dataset of detections more likely to be tornadic. Since stronger mesocyclones are more likely to be associated with a tornado, the increasing percentage observed is a good sign that the strength attributes are providing a good estimate of actual of mesocyclone strength. Despite the removal of many weak detections, the stricter mesocyclone detection definitions produce little improvement in overall skill as defined by HSS (Fig. 5; Table 4). The primary difference is that FAR and
VOLUME 19
POD both decrease and the detection threshold increases. The probability of the MDA missing tornadic detections increases with higher thresholds, but the probability of detection of nontornadic detections also decreases. Finding the right balance between POD and FAR can be quite difficult. One additional modification to the mesocyclone detection threshold is analyzed. Compromising from the results above, all detections with MR # 2 are removed. Also, all detections with an AGE 5 0 are removed resulting in a dataset of 5987 mesocyclone detections. Subjective analysis of the mesocyclone data suggests that removal of detections that are only defined in a single volume scan may result in the loss of a large portion of important vortex detections, especially since each true detection must begin somewhere. Removal of detections with AGE 5 0 does have the advantage of eliminating many of the anomalous (nonatmospheric related) detections remaining after the filtering discussed in section 3 has been performed. Using a detection definition of MR $ 2 and AGE . 0 results in 342 or 5.71% of the detections being classified as tornadic with only 2, out of 31, tornadoes being missed. MSI skill improved when using the MR $ 2 and AGE . 0 threshold with an HSS value exceeding 0.22. For MSI thresholds greater than 3000, HSS values exceeded those produced by the MR $ 1 detection dataset. The most striking statistical improvement is that the MR $ 2 and AGE . 0 thresholds result in a much lower FAR at the best HSS threshold. For MSI, this threshold is 3700 (cf. 3500 previously) with an HSS value of 0.245 and a FAR value of 0.731. For the MR $ 1 dataset HSS is 0.178 and FAR is 0.813. Interestingly POD also improves slightly from 0.245 to 0.281. The MR $ 2 and AGE . 0 detection dataset appears to increase in attribute skill with the only drawback being the possibility of missing tornadoes only associated with very weak and transient vortices. 2) 2001 Using the best detection definition determined from the 2000 data (MR $ 2 and AGE . 0), a dataset of 30 155 mesocyclone detections was derived from the MR $ 2001 detection dataset. Of these, 999 detections (or 3.31%) are classified as tornadic. The number of tornadic detections is reduced from the MR $ 1 dataset. Unfortunately, the number of tornadoes now missed increases to a total of 29. The additional misses being mostly F0s with the addition of one F1 and one F2 miss, respectively. The magnitude of the increase in missed tornadoes (and the miss of a F2) indicates that the MR $ 2 and AGE . 0 thresholds may not be as good as the 2000 data suggest. Further research into various detection classification rules is necessary before an accurate determination can be made. Still, maximum MSI HSS increases from 0.168 using the original 2001 (MR $ 1) mesocyclone detection def-
OCTOBER 2004
JONES ET AL.
881
FIG. 4. Same as Fig. 3 except for 2001 mesocyclone (MR $ 1) detections.
inition to an HSS of 0.173 for the redefined (MR $ 2 and AGE . 0) dataset. This skill is still lower than the HSS of 0.225 seen for the corresponding 2000 dataset. Interestingly, NNTORN is now the best attribute with an HSS of 0.197. The improvement in NNTORN skill did not occur with the corresponding 2000 dataset. c. 2001 individual radar analysis The large size of the 2001 detection dataset with several tornadoes being observable from each radar allows the possibility of a verification analysis using detection data from each separate radar. Table 7 shows the number of detections, using the MR $ 1 definition, from each radar with the corresponding number of tornadic detec-
tions defined using the windowing techniques discussed in section 3. The percentage of tornadic mesocyclone detections varies from 1.56% at KINX to 2.66% at KAMA compared to the 1.98% for the multiradar 2001 detection dataset (Table 7). While the differences may not seem large, they are significant. For each radar, MSI skill is computed and compared (Fig. 6). KINX, KLBB, and KSRX all show HSS values of greater than 0.2 though the threshold values at which maximum skill occurs vary. Possible causes include differences in the nature of convective activity, radar calibration, or VCP usage among each radar. Also, skill does not seem to be directly associated with the percentage of detections that are tornadic. KAMA produces the greatest percentage of tornadic
882
WEATHER AND FORECASTING
VOLUME 19
TABLE 6. Attribute skill, using best attribute threshold as defined by HSS, for the combined MR $ 1 2001 detection dataset. Attribute
Value
HSS
CSI
POD
FAR
DEPTH MR LLDIA MXSHEAR MXGTG MSI NNTORN PC1
10 700 6 8600 17 34 4000 14 3.0
0.093 0.166 0.014 0.053 0.136 0.168 0.126 0.207
0.068 0.103 0.023 0.040 0.087 0.101 0.076 0.126
0.129 0.241 0.123 0.117 0.251 0.182 0.129 0.235
0.875 0.848 0.972 0.942 0.883 0.813 0.844 0.788
detections (2.66), but the best MSI HSS for KAMA is only 0.186, lower than KINX, KLBB, and KSRX values. KSRX produces the best MSI HSS among all radars with a value of 0.236, but with only 1.78% of the detections being tornadic (second lowest among all radars with KINX having the lowest). POD and FAR values associated with the best skill threshold range from 0.14 to 0.28 and 0.71 to 0.90, respectively. KTLX has the second worst MSI skill with a maximum value of 0.141 at MSI 5 4400. Why the KTLX mesocyclone detections show less skill is somewhat unclear, but may be due in part to a slightly greater proportion of null events observed from this radar and possibly due to poor calibration. KFWS is the worst performing radar with a maximum HSS of 0.114 corresponding with an MSI threshold of only 3100. KFWS also has the highest FAR with a value of 0.902. The poor attribute skill from the KFWS detections has a significant impact on the combined dataset skill. Without KFWS data, MSI skill using detections from the five remaining radars reach an average HSS of greater than 0.2. While KFWS has the second highest POD values associated with the maximum MSI skill threshold of any of the radars, it also has the worst FAR at 0.902. The low skill score values result from the best MSI threshold being lower than that of the other radars. Unlike the other radars, skill does not improve as the MSI threshold reaches 4000. Why the mesocyclone detections from the KFWS radar shows much less skill than do those from the other radars is unclear. One possibility suggested by the observations is that over half of the tornadic detections occurred when the radar was in VCP21, or precipitation, mode. Other factors such as the nature of the tornadic storms observed by KFWS and radar calibration issues may be responsible. d. Principal component analysis 1) 2000 The correlation matrix of 40 mesocyclone detection attributes produced from the 2000 MR $ 1 dataset shows moderate (0.5) to high (0.8) correlation among many attributes. The highest correlations (.0.8) occur among the velocity-derived attributes (Table 1). Another set of attributes associated with each other includes
FIG. 5. Variable MSI threshold HSS plot for several different mesocyclone ‘‘definitions’’ computed from 2000 MDA output. Note that as the threshold for classifying a vortex detection as a mesocyclone becomes greater (e.g., MR threshold increases), the number of tornadoes missed also increases. These additional misses are not taken into account in the HSS calculation. Using a stricter mesocyclone detection definition based on MR alone shows little, if any, improvement in skill while increasing the number of missed tornadoes from two to nine. However, a compromise detection definition of MR $ 2 and AGE . 0 exhibits higher HSS values with only four missed tornadoes.
depth and range-related attributes (Table 1). While the correlation values are not as strong (;0.5), depth and range association does appear physically reasonable. Eigenvalues and vectors are calculated to determine how much of the total dataset variance could by explained by each dimension (Fig. 7). The initial eigenvalue exceeds 10, suggesting that the first dimension accounts for over 25% of the total variance. Subsequent (higher order) eigenvalues decrease sharply to values below one around the 10th eigenvalue. Using 10 dimensions explains over 75% of the total dataset variance, though the first three dimensions alone explain 49%. Retaining additional dimensions for the sole propose of explaining a larger fraction of the total variance does not produce useful PC scores since a large portion of the additional variance appears to be a result of random (white) noise (Fig. 7). A large number of attribute loadings with values of 0.2–0.3 are distributed throughout each possible PC score indicating a high degree of noise present in the dataset. Appendix B describes a procedure in which loadings are thresholded in order to reduce random noise. Calculating the sampling error for the eigenvalues provides no useful guide for choosing proper dimensionality. Due to the large size of this dataset, the sampling error for the eigenvalue is two orders of magnitude less than the eigenvalue, leaving no ambiguity for any of the 40 eigenvalues created; G testing proved more useful in determining the proper number of dimensions to create (Overland and Preisendofer 1982). An analysis of the average g value for two through five dimensions reveals that creating two or three dimensions is significantly more advantageous than creating four or five
OCTOBER 2004
JONES ET AL.
883
TABLE 7. Total number of mesocyclone detections from the MR $ 1 2001 dataset for each radar. The variation in the percentage of tornadic detections is significant with KSRX having the smallest and KAMA having the largest. The reasons for the radar-to-radar variation remain unclear. Year
Detections
Tornadic
Percentage tornadic
KAMA KFWS KINX KLBB KSRX KTLX
13 152 11 240 15 544 8426 16 579 17 868
350 229 243 177 295 346
2.66 2.04 1.56 2.10 1.78 1.94
(Fig. 8). The analysis does not include higher dimensions because the physical meaning is unclear and the analysis shown in Fig. 8 does not warrant the use of more than three dimensions. Creating three PC scores provides the best compromise of the tests above; thus, three dimensions are used for the remainder of this work. The result of PCA shows that the first score (PC1) contains a high proportion of the velocity-derived information present in the attribute dataset (Table 1). Attributes such as MSI and MR have rotated loadings exceeding 0.8 in the initial score suggesting that nearly all the information from these attributes is contained within PC1 (Fig. 9). Since both these attributes show skill above many others, this score should perform as well if not better than the separate attributes. The second score (PC2) contains much of the depth-related attribute information (Table 1). While PC2 is the second most important new variable as measured by variance explained, it is not expected to show much, if any, skill since most of the attributes contained within PC2 showed little skill. The third variable (PC3) contains primarily shear and diameter attribute information (Ta-
FIG. 6. Variable MSI threshold HSS plot for each radar using the 2001 MR $ 1 mesocyclone detection dataset. Four radars (KAMA, KINX, KLBB, and KSRX) perform better than the overall average, while two (KFWS and KTLX) perform worse. KFWS has the worst performance and acts to bring down the entire six-radar skill.
FIG. 7. First 10 eigenvalues for the 2000 (MR $ 1) mesocyclone detection dataset. Eigenvalues for using other thresholds for a mesocyclone detection are virtually identical. After the seventh eigenvalue, little explained variance beyond that attributable to random noise is apparent.
ble 1). Again given the single attribute analysis, little skill is expected from PC3. New variable values, or scores, are calculated by applying the loading information to a normalized version of the attribute dataset [Eq. (A6)]. Maximum skill as defined by HSS is shown in Fig. 9 for the three PC scores created using the three-dimensional, Varimax technique described in appendix B. Only PC1 exceeds an HSS of 0.18 at a value of 2.3, or roughly two standard deviations away from the mean. POD and FAR at this value are 0.23 and 0.79, respectively, implying only marginal skill is present. The POD and FAR values from PC1 improve somewhat over those associated with the best skill using the MSI threshold of 3500 (Table 5).
FIG. 8. Coefficient of congruence (G1) for the first variable created using Varimax rotation schemes from 2 to 10 dimensions. For dimensions two–five, the average g value (Ave G) is determined using the g value from the loading information for every dimension present within a particular rotation. Both the first dimension g and the average g values decrease as the number of dimensions increases from three to four indicating that further dimensions would not be desired.
884
WEATHER AND FORECASTING
VOLUME 19
FIG. 9. Variable threshold skill score plots for PC attributes determined using a three-dimensional, Varimax loading technique. PCs 1–3 represent the skill of each PC calculated using (a), (b), (c) 2000 and (d), (e), (f ) 2001 mesocyclone detection (MR $ 1) attributes. For both years, only PC1 shows any significant skill.
For the three-dimensional dataset, skill scores are also calculated for PC2 and PC3 (Fig. 9). As suspected, they show virtually no skill. 2) 2001 The correlation matrix and eigenvalues associated with the 2001 MR $ 1 dataset PCA are nearly identical to those produced by the 2000 MR $ 1 data. A comparison of the rotated loadings with those produced from the corresponding 2000 dataset also shows only minor
differences. The increase in dataset size has little effect on the interactions between different attributes. As a result, the rotated loadings calculated from the 2000 dataset could be applied to future datasets with a high degree of confidence that they would produce physically realistic new variables from new datasets. For 2001, PC1 again proves to be the best and improves skill over the raw MSI attribute. The increase in skill from using PCA is larger for 2001, with HSS increasing from the raw MSI value of 0.168 to PC1’s maximum of 0.207, which is larger than the skill in-
OCTOBER 2004
JONES ET AL.
crease seen in the 2000 PCA. The threshold value at which the maximum HSS occurs for PC1 is 3.0 higher than the threshold seen in the PC1 score of 2.3 created by PCA of the 2000 data. The other two PC scores created again show virtually no skill indicating that velocity information is the prime source of ‘‘highly skilled’’ information (Fig. 9). e. Combined 2000–01 verification analysis Combining 2000 and 2001 mesocyclone (MR $ 1) detection data produces a dataset of 98 186 detections. The attribute skill is calculated for the entire dataset. As for the separate 2000 and 2001 dataset, MSI, MR, and NNTORN proved to be among the best raw attributes. The maximum MSI HSS value is 0.167 at a threshold of 4400, which is similar to that reported using the 2001 (MR $ 1) dataset. Since the 2001 (MR $ 1) dataset is over five times as large as the corresponding 2000 dataset, the skill calculated from the former dominates that produced from the latter. Overall skill is somewhat lower than would otherwise be the case due to very low skill produced from the KFWS detections during 2001. 8. Conclusions The primary result of this work is that the vast majority of vortex detections are not associated with a tornado. Using a low threshold for classifying vortex detections as mesocyclones results in approximately 3% of mesocyclone detections being classified as tornadic. Increasing the threshold leads to a detection dataset in which as many as 10% of detections are classified as tornadic. The proper threshold at which to classify a vortex detection as a mesocyclone detection remains a subjective matter. Lower thresholds allow for a greater number of detections and an increased likelihood of detecting any vortex associated with a tornado. A high detection threshold eliminates vortices not associated with a classical mesocyclone, but also eliminates nonclassical vortex detections that may happen to be associated with (often weak) tornadoes (Brooks et al. 1994). All available radar data are processed in order to produce the various detection datasets. Determining which data to process is not based on the occurrence of tornadoes or other types of severe weather; thus, the radar data include many types of convective events, some in which no severe weather is produced at all. The proportion of nonsevere (and nontornadic) cases used here is therefore much higher than in previous studies, resulting in lower predictive skill than reported by Stumpf et al. (1998). Using their dataset and analysis methods, an MSI threshold of ;3500 produced an HSS in excess of 0.3 with a corresponding POD of nearly 0.5. The best skill reported herein is an HSS of approximately 0.2 with a
885
corresponding POD of 0.25. Using PCA appeared to improve skill over single attributes such as MSI, but not significantly. PCA appears to show that most attribute skill is embodied by velocity-related attributes in PC1 (Table 1). More specifically, 3D attributes such as MSI, MR, and MSIpIRS often only perform slightly worse. Combining various velocity-related attributes using PCA does improve skill, especially with the larger (2001) dataset. The large detection datasets used here may not be large enough to produce long-term statistics. As the mesocyclone dataset increased in size from the 2000 data to the 2001 data, the percentage of detections classified as tornadic decreased. This decrease may well continue for even larger datasets, resulting in the possibility that less than 2% of the mesocyclone detections produced by the MDA are tornadic using the lowest reasonable classification threshold. Using the highest threshold no more than 10%–12% of detections are likely to be tornadic. The high percentage of nontornadic mesocyclone detections is a significant departure from most previous research (Burgess 1976; Burgess and Lemon 1991; Burgess and Doswell 1993). Repeating this work with a much larger dataset several years from now could provide very interesting results. Using a hypothetical ‘‘perfect’’ tornado report dataset would likely increase the number of detections classified as tornadic. Unfortunately, the magnitude of this increase is unknown. The difference in detection characteristics among different radars proved to be quite significant. The technique of combining mesocyclone detections used here does allow for a viable verification process. It does not produce a true mesocyclone detection dataset, as often many detections are repeated by two or three separate radars. To remedy this problem, the mesocyclone detections must be made using a multiradar version of the MDA that is currently in development (Lakshmanan 2002). Temporal issues with radar data from different sites along with radar calibration and scan mode issues also greatly complicate a multiradar effort. The SCIT filter introduced here is only a first step in producing a more representative mesocyclone detection dataset. New techniques to detect and diagnose mesocyclones are being designed that are significantly more robust than those currently used by the MDA. These include using statistical analysis of velocity data to produce a pattern recognition technique to detect mesocyclones. Also, new techniques are being developed that take into account all three moments of radar data allowing a mesocyclone detection to be determined using the combination of reflectivity, velocity, and spectrum width data (Lakshmanan 2002). The combination of reflectivity and velocity data in particular should create new attributes that may have a greater probability of discriminating between tornadic and nontornadic detections. The results of this work show that some statistically significant skill exists between velocity-derived meso-
886
WEATHER AND FORECASTING
cyclone detection attributes (e.g., MSI) and tornadoes, but not enough for use as a reliable automated warning tool. However, several recommendations about the proper use of the MDA can be inferred. 1) Forecasters who use the MDA must realize that the low percentage (;10%) of tornadic detections requires careful inspection and filtering of MDA detections. Forecasters must mentally eliminate very weak detections and those that appear not to be associated with atmospheric phenomena (e.g., SCIT storm cell detection). 2) MSI proves to be the best overall attribute with a value between 3100 and 4400 maximizing HSS. Attributes such as DEPTH and LLDIA show little correlation with the presence of tornadoes and should not be given too much weight in an operational environment. 3) Strong (MR $ 5) mesocyclone detections are more likely to be associated with possible tornadoes, but many tornadoes appear to be associated with detections that do not reach this threshold. When analyzing the possibility that a mesocyclone may be tornadic, the forecaster must note that weak mesocyclone detections can be associated with a tornado even though the probability is low. Acknowledgments. I would like to thank John Snow for providing me the opportunity to work on this research topic. Also, he provided many insights that helped guide parts of this research improving the overall results. Others who proved immensely helpful included Greg Stumpf, Don Burgess, Andy White, Michael Richman, Kelvin Droegemeier, Jason Levit, Josh Palmer, Dan Cecil, and Kevin McGrath. Finally, I would like to thank the Warning Decision Training Branch and the NASA Space Grant Consortium for providing the funding necessary to complete this research. APPENDIX A Mesocyclone Detection Attributes The mesocyclone detection attributes used in this work are taken from the NSSL MDA algorithm using WDSS II to process the initial level-II data. Following is a list and brief description of many of the mesocyclone attributes used in this work. Descriptions of the capitalized attributes were taken from Stumpf et al. (1998) and NSSL (2000) and are listed in Table 1.
VOLUME 19
algorithm defines a 1D shear segment as a series of velocities from adjacent range bins at the same range (gate to gate) where the azimuthal shear is always positive and thus cyclonic. The MDA computes a shear value for each 2D shear region, which is made up of a number of 1D shear segments. Finally, the algorithm combines 2D shear regions into 3D features. The MDA computes the maximum shear values (MXSHEAR), the height (in m) at which the maximum shear occurs (HTMAXSHEAR), and the shear value at the lowest elevation of the 3D feature (LLSHEAR). See Table 1. Forecasters often consider shear values in excess of 30 s 21 as being strong. 2) GATE-TO-GATE-VELOCITY DIFFERENCE The greatest velocity difference between two adjacent velocity values (in adjacent range bins) within a shear segment represents the gate-to-gate velocity difference (GTGVD). The MDA calculates 2D GTGVD values in the same manner as for the 2D shear attribute. Values greater than 40 m s 21 are considered strong. The MDA computes maximum GTGVD (MXGTGVD), the height at which maximum GTGVD occurs (HMXGTGVD), and the GTGVD value at the lowest elevation of the 3D feature (LLGTGVD). 3) ROTATIONAL
VELOCITY
The normalized difference between maximum inbound velocity and maximum outbound velocity from an entire 2D shear region defines rotational velocity (ROTV). Values greater than 30 m s 21 are considered strong. The MDA computes maximum ROTV (MXRV), the height of detection at which maximum ROTV occurs (HMXRV), and the ROTV value at the lowest elevation of a 3D feature (LLRV). 4) MESOCYCLONE
DIAMETER
The diameter of the vortex of each 2D detection defines the mesocyclone diameter attribute. It should be noted that the MDA assumes a perfectly circular mesocyclone ignoring elliptical features. The MDA computes the maximum diameter (MXDIA), the height at which the maximum diameter occurs (HMXDIA), and the lowest diameter of the 3D feature (LLDIA). A lowlevel diameter of less than 4 km is considered significant. b. Three-dimensional attributes
a. Two-dimensional attributes 1) SHEAR The difference in radial velocity over a series of adjacent range bins defines shear. The MDA computes shear by dividing the maximum velocity difference within a 1D shear segment by the segment length. The
1) MESOCYCLONE
DEPTH
The height (in m) above radar level of the vertically integrated 2D vortices defines the mesocyclone depth (DEPTH). The MDA calculates DEPTH by adding the half-power beamwidth to both the top and the base of the 3D vortex feature. (The half-power beamwidth is
OCTOBER 2004
JONES ET AL.
the width of the radar beam in which half of the power is transmitted.) The MDA also computes the height at which the lowest 2D vortex is observed for a 3D feature (BASE). An associated depth-related attribute, COREDEPTH, is defined as the depth of the ‘‘core’’ of the area of strongest rotation within a 3D mesocyclone detection. The MDA also computes the height at which the first 2D feature of the ‘‘core’’ is observed (COREBASE). 2) STORM-RELATIVE
DEPTH
Storm-relative depth (RELpDEPTH) is the percentage of the mesocyclone depth with respect to the parent storm depth as provided by the SCIT algorithm. SCIT values are disregarded in cases where the mesocyclone is too close to the radar (,30 km) to detect its full height. 3) VERTICALLY
INTEGRATED ATTRIBUTES
Two-dimensional values of gate-to-gate velocity difference, rotational velocity, and shear are each integrated over the 3D column of the vortex detection producing vertically integrated (VI) attributes VIpGTGVD, VIpRV, and VIpSHEAR, respectively. 4) MESOCYCLONE
RANK
The MDA assigns a dimensionless 3D strength rank or mesocyclone rank (MR) to each 3D velocity feature by finding the strongest continuous vertical core of 2D features whose 2D strength ranks are greater than or equal to a given strength rank. Each 2D rank is based upon the maximum value of MXGTG or MXSHEAR at a 2D level with the one providing the greater 2D ranking being assigned to the 3D feature. The feature core must be at least 3 km in half-beamwidth depth and reach a height of at least 5 km above radar level. An additional MR-like parameter is calculated using the MSI integration method (MSIR). 5) INTEGRATED
ROTATIONAL STRENGTH INDEX
The integrated rotational strength (IRS) index is similar in nature to MR in that it is based upon the maximum rank of a 2D feature (Lee and White 1998). However, IRS does have the ability to take into account different thresholds for producing a specific rank as range increases, improving its usefulness. The MDA computes both the NSSL and NWS formulations of IRS, (MSIpIRS and NWSpIRS, respectively). 6) MESOCYCLONE
STRENGTH INDEX
The mesoscale strength index (MSI) is a new vertically integrated vortex strength index based on the concept of IRS. Like MR, it relies upon each 2D strength
887
index calculated for each 2D circulation in the 3D vortex. The 2D strength indices are calculated from various maximum values of shear, GTGVD, and ROTV. To create MSI, each 2D feature’s strength rank is multiplied by 1000 and weighted by the average air density at the height of the 2D detection and finally vertically integrated over the whole of the 3D vortex. Each 2D feature is. The value resulting from the integration is divided by the depth to normalize between shallow and deep mesocyclones. Values in excess of 3600 are considered strong. c. Neural network attributes A neural network (NN) is included with the MDA that produces a probability value of tornado and/or severe weather occurrence based on a nonlinear combination of the rest of the mesocyclone attributes (Marzban and Stumpf 1996). In theory, the NN tornado probability parameter should perform better than variables produced through PCA. However, in order for an NN to function, it must first be trained upon a known dataset. The NN present in this incarnation of the MDA was only trained on a limited number of supercell cases resulting in an NN that cannot accurately handle other meteorological situations. The MDA computes both NN tornado probability (NNTORN) and severe weather probability (NNSEVERE). d. Miscellaneous attributes Other attributes computed by the MDA and used in PCA are low-level and midlevel convergence (LLCON and MIDCON) in the vicinity of a mesocyclone calculated using the raw velocity field. Also included is the circulation type (CIRCpTYPE), which is defined as 1 for mesocyclone detections and 3 for collocated mesocyclone and TVS detections as defined by the TDA algorithm (Mitchell et al. 1998). Several mesocyclone ‘‘class’’ attributes exist and include NSSLpMCLASS, NWSpMCLASS, PLpMCLASS, and MpVORTpCLASS. Each class attribute is an attempt by the MDA to classify various detection methods into certain vortex classifications defined by an integer number. These classifications were developed by the NWS and NSSL among others. The LTpMESO attribute signifies whether a vortex detection has ‘‘low-top’’ characteristics or not. Finally, attributes such as mesocyclone date (JULIANpTIME), persistence (AGE), range (MESOpRANGE), azimuth (MESOpAZM), and VCP of each detection are retained to ensure that the PCA process produces physically meaningful results. With the exception of MESOpRANGE, none of these attributes should figure heavily in the PC scores being created.
888
WEATHER AND FORECASTING
APPENDIX B Statistical Procedures a. Skill scores Scoring parameters used in this work include: probability of detection (POD), false alarm rate (FAR), critical success index (CSI), and Heidke skill score (HSS). These parameters are defined below in terms of the contingency matrix [Eq. (1)] shown in section 5: POD 5 a(a 1 c)21 ,
(B1)
FAR 5 b(a 1 b) , 21
(B2)
CSI 5 a(a 1 b 1 c) , 21
and
(B3)
HSS 5 [2(ad 2 bc)] 3 [(a 1 c)(c 1 d) 1 (a 1 b)(b 1 d)]21 .
(B4)
POD represents the probability that a reported tornado will be predicted by a mesocyclone attribute above (or below) a certain threshold. Ideally, POD would equal one, meaning that no tornadoes were missed using a particular threshold. FAR represents the percentage of all mesocyclone detections that were forecast to be tornadic based upon a certain attribute threshold, but have no tornado report associated with them, hence, the term ‘‘false alarm.’’ The ideal FAR value is zero, which would represent a case where no false forecasts were made. CSI has been the traditional forecasting parameter in meteorological forecasting studies (Stumpf et al. 1998). Like POD and FAR, its values range from a minimum of zero to a maximum of one with one being the ‘‘perfect’’ forecast. CSI [Eq. (B3)] does not take into account the number of correct no predictions (or d in the C matrix), a problem that is compounded in a rare-event situation, as is the case here. The number of actual events is much less than the number of nonevents; thus, CSI is only measuring the skill of a particular attribute on a small portion of a rare event dataset. HSS [see Eq. (B4)] utilizes all of the information present in the C matrix; thus, is able to take into account correctly identified events and nonevents, in addition to missed events and false alarms. The resulting HSS score ranges from zero to one like CSI, but is less biased and a better overall measure of skill for the type of datasets being analyzed here. b. Principal component analysis The initial step in PCA is the calculation of a similarity matrix (e.g., correlation matrix), R, using the normalized attribute dataset. Once a correlation matrix is made, eigenvalues and eigenvectors are calculated from the correlation matrix to determine attribute weights (loadings) of each attribute that are assigned to each, independent, PC score. Each eigenvalue and eigenvector
VOLUME 19
is associated with a would-be PC score and defines the physical content of that score via loadings produced from the eigenvectors. Eigenvalues also give an indication of the proper number of dimensions (scores) to create from a given dataset. The larger the eigenvalue, the more dataset variance is explained by the score produced from the associated eigenvector. The number of new dimensions to create can be determined using a variety of other methods. North et al. (1982) suggests using a first-order estimate of eigenvalue error to determine the proper dimensionality. If the sampling error for a particular eigenvalue overlaps with that of a nearby eigenvalue, then the argument can be made that the two eigenvalues are not resolvable from each other; thus, the physical interpretation of the scores produced from this analysis would be questionable. The dimension at which the overlap occurs and those lower would not be considered good dimensions to create loadings due to this ambiguity. The sampling error is defined as
!
2 , N
]D a ø l a
(B5)
where ]D a is the eigenvalue error for dimension a, l a, is the eigenvalue, and N is the sample size assuming no autocorrelation. Overland and Preisendofer (1982) propose another technique that creates a dataset of pseudonumbers with the same number of variables as in this analysis and of length N for which eigenvalues are calculated. The dimension at which a random eigenvalue exceeds that of an eigenvalue calculated from actual data is used as a threshold for the number of dimensions to create. Richman (1986) proposed a fundamentally different idea using the coefficient of congruence, g, to determine the proper number of dimensions to create. The coefficient of congruence is defined using the following relation:
Oab g5 [1O a 21O b 2] n
j
j
j51
n
2 j
j51
1/ 2
n
.
(B6)
2 j
j51
Here, n is the number of attributes from which loadings are calculated. Vector a represents the loading values for a particular dimension. Vector b is defined as the column vector from the correlation matrix, which is associated with the detection attribute containing the greatest absolute loading in a. By comparing a and b in this fashion, it is possible to determine how well the newly created scores are associated with the ‘‘most important’’ detection attribute in a particular score. Excellent associations of | g | . 0.98 correspond to a score that is closely associated with the original attribute implying that the score is physically significant. By extending this technique to multiple dimensions, it is pos-
OCTOBER 2004
889
JONES ET AL.
sible to determine the proper number of dimensions to create by analyzing the average g value for all scores for a given number of created dimensions. Once an appropriate number of eigenvalues and eigenvectors have been determined, the weight that each attribute has in the new PC scores is calculated. These weights are defined as variable loadings (or A in matrix notation) and range from zero to one. A value of one for an attribute means that all the information from that attribute is incorporated into the score. In effect, highly correlated attributes are clustered into a single PC score reducing the number of variables that have to be analyzed further. Once the loadings have been determined, PC scores, defined as F in matrix notation, can then be calculated from the raw attributes. The PC model representation using a normalized dataset is defined as Z 5 FAT .
(B7)
The F matrix represents the new PC component scores while A represents the weighting (or loading) matrix (Richman 1986). The loading matrix, A, is defined from the eigenvectors and correlation matrix, which are known from the dataset using the relation R 5 A fAT
and
R 5 AAT .
(B8) (B9)
The PC score correlation matrix, f, is defined as an identity matrix for uncorrelated loadings like those to be used here; thus, Eq. (B8) simplifies to Eq. (B9). What remains to be determined is the matrix of new scores, F. Solving Eq. (B7) for F results in F 5 ZA(ATA) 21 .
(B10)
Richman (1986) has shown that determining scores from unrotated loadings can lead to questionable results. These problems include nonphysical loadings resulting from noise in the correlation matrix, instability in A as the data domain changes, and important eigenvalues that are similar in value, leading to cross-contamination of A from one score to another. These problems may result in a loading matrix with vectors having little physical meaning and lead to scores that have little potential for meaningful interpretation. All loadings are rotated prior to the formation of new scores. Rotation implies a rotation of the coordinate axes on which the raw loadings are based. The rotation scheme used for the most part in this work is the Varimax scheme developed by Kaiser (1958). The Varimax scheme works by taking the raw loadings and distributing them in such a manner as to maximize the number of large and small loading coefficients. It is generally accepted as the most accurate algebraic orthogonal rotation scheme in widespread use and hence is used for this work in part due to its wide availability (Richman 1986). Since the mesocyclone detection attribute datasets contain a certain amount of noise, methods are being
sought to limit the amount of noise entering PCA. Not limiting this noise could result in scores that are ‘‘muddied’’ by the contribution of random attributes. One solution proposed by Richman and Gong (1999) was to pass the rotated loadings through a predefined threshold before calculating the scores. They showed that a threshold of 0.2–0.3 increased the viability of the resulting scores for a wide range of datasets. Since the mesocyclone attributes contain a high degree of noise, the higher threshold of 0.3 is utilized. REFERENCES Brooks, H. E., C. A. Doswell III, and J. Cooper, 1994: On the environment of tornadic and nontornadic mesocyclones. Wea. Forecasting, 9, 606–618. Brown, R. A., J. M. Janish, and V. T. Wood, 2000: Impacts of WSR88D scanning strategies on severe storm algorithms. Wea. Forecasting, 15, 90–102. Burgess, D. W., 1976: Single Doppler radar vortex recognition: Part 1: Mesocyclone signatures. Preprints, 17th Conf. on Radar Meteorology, Seattle, WA, Amer. Meteor Soc., 97–103. ——, and L. R. Lemon, 1991: Characteristics of mesocyclones detected during NEXRAD test. Preprints, 25th Conf. on Radar Meteorology, Paris, France, Amer. Meteor. Soc., 39–42. ——, and C. A. Doswell, 1993: Tornadoes and tornadic storms: A review of conceptual models. The Tornado: Its Structure, Dynamics, Prediction, and Hazards, Geophys. Monogr., No. 79, Amer. Geophys. Union, 161–172. ——, R. J. Donaldson, and P. R. Desrochers Jr., 1993: Tornado detection and warning by radar. The Tornado: Its Structure, Dynamics, Prediction, and Hazards, Geophys. Monogr., No. 79, Amer. Geophys. Union, 203–221. Desrochers, P. R., and R. J. Donaldson, 1992: Automatic tornado prediction with an improved mesocyclone-detection algorithm. Wea. Forecasting, 7, 373–388. Droegemeier, K. D., and Coauthors, 2002: Project CRAFT: A test bed for demonstrating the real time acquisition and archival of WSR-88D level II data. Preprints, 18th Int. Conf. on Interactive Information Processing Systems (IIPS) for Meteorology, Oceanography, and Hydrology, Orlando, FL, Amer. Meteor. Soc., 136– 139. JDOP, 1979: Final report on the joint Doppler operational project. NOAA Tech. Memo. ERL NSSL-86, National Severe Storms Laboratory, Norman, OK, 84 pp. Johnson J. T., P. L. MacKeen, A. Witt, E. D. Mitchell, G. J. Stumpf, M. D. Eilts, and K. W. Thomas, 1998: The Storm Cell Identification and Tracking (SCIT) algorithm: An enhanced WSR-88D algorithm. Wea. Forecasting, 13, 263–276. Jones, T. A., K. M. McGrath, and J. T. Snow, 2002: Improved methodology for correlating mesocyclone detections with tornadoes. Preprints, 21st Conf. on Severe Local Storms, San Antonio, TX, Amer. Meteor. Soc., 166–169. Kaiser, H. F., 1958: The Varimax criterion for analytic rotation in factor analysis. Psychometrika, 23, 187–200. Lakshmanan, V., 2002: An extensible, multi-source meteorological algorithm developmental interface. Preprints, 21st Conf. on Severe Local Storms, San Antonio, TX, Amer. Meteor. Soc., 134– 137. Lee, R. R., and A. White, 1998: Improvement of the WSR-88D mesocyclone algorithm. Wea. Forecasting, 13, 341–351. Marzban, C., and G. J. Stumpf, 1996: A neural network for tornado prediction based on Doppler radar-derived attributes. J. Appl. Meteor., 35, 617–626. ——, E. D. Mitchell, and G. J. Stumpf, 1998: What are the ‘‘best predictors of tornadoes.’’ Preprints, 19th Conf. on Severe Local Storms, Minneapolis, MN, Amer. Meteor. Soc., 729–732. ——, ——, and ——, 1999: The notion of best predictors: An ap-
890
WEATHER AND FORECASTING
plication to tornado prediction. Wea. Forecasting, 14, 1007– 1016. McGrath, K. M., T. A. Jones, and J. T. Snow, 2002: Increasing the usefulness of a mesocyclone climatology. Preprints, 21st Conf. on Severe Local Storms, San Antonio, TX, Amer. Meteor. Soc., 162–165. Mitchell, E. D., S. V. Vasiloff, G. J. Stumpf, A. Witt, M. D. Eilts, J. T. Johnson, and K. W. Thomas, 1998: The National Severe Storms Laboratory tornado detection algorithm. Wea. Forecasting, 13, 352–366. ——, K. L. Elmore, K. Angle, and C. Hannon, 2000: A radar signature climatology using WSR-88D level II data. Preprints, 20th Conf. on Severe Local Storms, Orlando, FL, Amer. Meteor. Soc., 92– 94. NSSL, 2000: WATADS version 10.2: WSR-88D algorithm testing and display system reference guide. National Severe Storms Laboratory, Norman, OK, 200 pp. North, G. R., T. L. Bell, and R. F. Cahalan, 1982: Sampling errors in the estimation of empirical orthogonal functions. Mon. Wea. Rev., 110, 699–706. Overland, J. E., and R. W. Preisendorfer, 1982: A significance test
VOLUME 19
for principal components applied to cyclone climatology. Mon. Wea. Rev., 110, 1–4. Richman, M. B., 1986: Rotation of principal components. J. Climatol., 6, 293–335. ——, and X. Gong, 1999: Relationships between the definition of the hyperplane width to the fidelity of principal component loading patterns. J. Climate, 12, 1557–1576. Stumpf, G. J., A. Witt, E. D. Mitchell, P. L. Spencer, J. T. Johnson, M. D. Eilts, K. W. Thomas, and D. W. Burgess, 1998: The National Severe Storms Laboratory mesocyclone detection algorithm for the WSR-88D. Wea. Forecasting, 13, 304–326. Trapp, R. J., and G. J. Stumpf, 2002: A reassessment of the percentage of tornadic mesocyclones. Preprints, 21st Conf. on Severe Local Storms, San Antonio, TX, Amer. Meteor. Soc., 198–201. Wilks, D. S., 1995: Statistical Methods in the Atmospheric Sciences. Academic Press, 237 pp. Witt, A., M. D. Eilts, G. J. Stumpf, E. D. Mitchell, J. T. Johnson, and K. W. Thomas, 1998: Evaluating the performance of WSR88D severe storm detection algorithms. Wea. Forecasting, 13, 513–518. Zrnic´, D. S., D. W. Burgess, and L. D. Hennington, 1985: Automatic detection of mesocyclone shear with Doppler radar. J. Atmos. Oceanic Technol., 2, 425–438.