Associations between Screen Time and Physical Activity among Spanish Adolescents Jose A. Serrano-Sanchez1*, Sara Martı´-Trujillo1, Angela Lera-Navarro3, Cecilia Dorado-Garcı´a1, Juan J. Gonza´lez-Henrı´quez2, Joaquı´n Sanchı´s-Moysi1 1 Department of Physical Education, University of Las Palmas de Gran Canaria, Campus Universitario de Tafira s/n, Las Palmas de Gran Canaria, Spain, 2 Department of Mathematics, University of Las Palmas de Gran Canaria, Campus Universitario de Tafira s/n, Las Palmas de Gran Canaria, Spain, 3 Department of Physical Education, University of A Corun˜a, A Corun˜a, Spain
Abstract Background: Excessive time in front of a single or several screens could explain a displacement of physical activity. The present study aimed at determining whether screen-time is associated with a reduced level of moderate to vigorous physical activity (MVPA) in Spanish adolescents living in favorable environmental conditions. Methodology/Principal Findings: A multi-stage stratified random sampling method was used to select 3503 adolescents (12–18 years old) from the school population of Gran Canaria, Spain. MVPA, screen-time in front of television, computer, video game console and portable console was assessed in the classroom by fulfilling a standardized questionnaire. Bivariate and multivariate logistic regression analyses adjusted by a set of social-environmental variables were carried out. Forty-six percent of girls (95% CI62.3%) and 26% of boys (95% CI62.1%) did not meet the MVPA recommendations for adolescents. Major gender differences were observed in the time devoted to vigorous PA, video games and the total time spent on screen-based activities. Boys who reported 4 hoursNweek21 or more to total screen-time showed a 64% (OR = 0.61, 95% CI, 0.44–0.86) increased risk of failing to achieve the recommended adolescent MVPA level. Participation in organized physical activities and sports competitions were more strongly associated with MVPA than screen-related behaviors. Conclusions/Significance: No single screen-related behavior explained the reduction of MVPA in adolescents. However, the total time accumulated through several screen-related behaviors was negatively associated with MVPA level in boys. This association could be due to lower availability of time for exercise as the time devoted to sedentary screen-time activities increases. Participation in organized physical activities seems to counteract the negative impact of excessive time in front of screens on physical activity. Citation: Serrano-Sanchez JA, Martı´-Trujillo S, Lera-Navarro A, Dorado-Garcı´a C, Gonza´lez-Henrı´quez JJ, et al. (2011) Associations between Screen Time and Physical Activity among Spanish Adolescents. PLoS ONE 6(9): e24453. doi:10.1371/journal.pone.0024453 Editor: Malcolm Gracie Semple, University of Liverpool, United Kingdom Received April 20, 2011; Accepted August 11, 2011; Published September 1, 2011 Copyright: ß 2011 Serrano-Sanchez, et al. This is an open-access article distributed under the terms of the Creative Commons Attribution License, which permits unrestricted use, distribution, and reproduction in any medium, provided the original author and source are credited. Funding: This work was supported by Cabildo of Gran Canaria (contract nu 35/03/22034)(www.grancanaria.es). The funder had no role in study design, data collection and analysis, decision to publish, or preparation of the manuscript. Competing Interests: The authors have declared that no competing interests exist. * E-mail:
[email protected]
has been linked to an increased risk of insulin resistance [19,20], alterations in lipid profile [21,22], back pain and headaches [23], and respiratory symptoms [24] in children and adolescents. Since sedentary habits increase during adolescence [25,26], several countries have established recommendations to limit screen time. In the USA, the American Academy of Pediatrics (AAP) recommends less than 2 hours per day of TV-watching [27]. In Australia and Canada, similar recommendations targeting children and adolescents have been issued [28,29]. It has been suggested that the relationship between adiposity and cardiovascular risk with screen-time is in part due to the substitution of some PA by sedentary behaviors [30,31]. In young Finns, Tammelin et al. [32] found that boys and girls who devoted more than 4 hours per day (hNd21) to TV-watching had respectively a 1.4- to 2.5-fold increased risk of not achieving the appropriate level of MVPA compared to a group watching TV for less than 1 hNd21. In contrast, others have postulated that PA and sedentary behaviors should not be considered as opposite ends of
Introduction Increasing moderate to vigorous physical activity (MVPA) in children and adolescents is one of the major public health strategies advised to reduce obesity and its associated morbidity [1–3]. In these populations, MVPA is associated with health benefits, including lower fat accumulation, cardiovascular risk reduction and greater bone mass acquisition [4–6]. Despite the slight increase in free time physical activity (PA) in the past decades, sedentary behaviors have also raised potentially blunting the benefits of PA [7,8]. Sedentary screen-time, especially television (TV)-associated screen-time, is the main contributor to total inactivity in children and adolescents [9–12]. It has been suggested that the relationship between screen-time and obesity may be of little clinical significance in children and youth [13,14]. However, longitudinal studies have shown that screen-time, particularly TV time, increased the risk of being overweight or obese [15–18]. Moreover, the excessive TV time PLoS ONE | www.plosone.org
1
September 2011 | Volume 6 | Issue 9 | e24453
Physical Activity, Screen-Time and Adolescents
dium of Physical Activities [39,40]. The time and energy spent in moderate PA (3.5–5.9 MET-min), vigorous PA ($6 MET-min) and the total PA ($3.5 MET-min) were calculated from the responses given in the questionnaire. The MLTPAQ has been validated in adolescents against doubly labeled water (r = 0.49 and r = 0.74, when sedentary activities such as time in front of screens and sleep were included) [41]. To determine associations between MVPA and screen-time, we used a dichotomous variable that classified the adolescents into two MVPA categories using the recommendation of 60 minutes of daily activity as the cutoff point [42–44]. Adolescents were classified as sufficiently active if they met the following three conditions: 1) at least 5 days per week (dNw21) of MVPA ($3.5 MET), 2) at least 300 minutes per week (minNw21) of MPVA and 3) at least 1,800 MET-minNs21 (300 minNw21 N6 MET-min medium-intensity) of MPVA; otherwise participants were classified as insufficiently active. Sedentary screen-time was measured with the specific items on the Television and Video Measures (TVM) questionnaire [45]. The TVM records the daily hours and minutes spent on TV, computer and video games in a typical week. The screen items have been validated in American children (aged 11–13 years) and Mexican children (aged 10–14 years) with correlation coefficients of 0.54 and 0.53, respectively, using a criterion of 24-hour recall [45,46]. In our study, we specifically asked for the number of days a week and the average time per day spent on TVs, computers, video games and portable mini-consoles in weekdays and weekends. This procedure has been tested for reliability in young Australians (aged 11–15 years) showing correlation coefficients between 0.72 and 0.90 [47]. We used the total hours per weak (hNw21) as the output variable for behaviors in front of screens. Intraclass correlation coefficients (ICC) between the first and second measurements for the logarithm of the number of hNw21 for each of the behaviors in front of screens were ICCTV = 0.86, ICCcomputer = 0.81, ICCvideogames = 0.88, ICCmini-consoles = 0.90 and ICCtotal = 0.84. The relative importance of screen-time compared to other social environmental factors associated with MVPA [48,49] was assessed. The following characteristics were surveyed and coded: 1) gender (1. boy and 2. girl), 2) age (continuous, 12 to 18 years), 3) PA of the father (1. regularly [$3 dNw21 for 30 minutes or more], 2. sporadically [$1 dNw21 for 10 minutes or more] and 3. inactive (,1 dNw21), 4) PA of the mother (same criteria than for the father), 5) organized participation (1. organized [directed by an instructor] and 2. not organized), 6) participation in sports competitions in the previous year (1. at least one and 2. none), 7) appeal of the physical education classes (1. I do not like them at all, 2. I do not like them, 3. indifferent, 4. I like them and 5. I like them a lot; coded into three groups: 1–2–3. low appeal, 4. medium appeal and 5. high appeal) and 8) access to PA spaces (1. indoor 2. outdoor 3. both and 4. none).
the same continuum, as they may be compatible with each other and independent in their relationship to health [33–36]. Thus, issuing of recommendations to limit screen-time may not be the best strategy in all countries for increasing adolescent PA levels [37]. In fact, in regions with excellent weather conditions, like Canary Islands, the amount and intensity of physical activities of adolescents may be sufficient to counteract the time expended in front of screens. Therefore, the aim of the present study was to determine whether screen-time (TV, computer, video games and portable mini-consoles) is associated with a reduced level of MVPA in adolescents living in a region with a climate ideal for physical activity. We hypothesized that adolescents accumulating higher daily screen-times, in total or through a single screen such as TV or computer, would have a greater risk of not achieving the recommended levels of MVPA.
Materials and Methods Sample and data collection The study took place in Gran Canaria (Spain), which has a stable climate throughout the year, with average annual temperatures between 18–24uC, 21 rainy days per year, and 65– 70% environmental humidity levels. A cross-sectional sample of 4000 adolescents (12–18 years-old) from the school population were selected by a multi-stage stratified random sampling method. Sample size was calculated following the procedure described by Bennet et al. [38]. Schools were considered as the basic sample units. A sample error below 2% at a confidence level of 95% was assumed for estimations of the recommended PA. The surveys were stratified proportionally to the adolescents population in local counties and municipalities (20 strata in total). Schools in each stratum were randomly sampled and from each school one or two classrooms were randomly selected for the study. Overall, 127 schools and 227 classrooms with an average of 17.6 pupils per classrooms were interviewed in June 2004. Interviews were carried out in the classroom by trained interviewers using a selfadministered questionnaire. The role of interviewers was to present and explain the questionnaire, offering support in the classroom to the participants. The reliability of the questionnaire was tested 2–4 weeks later by repeating the questionnaire in 150 adolescents. After data collection, 12% of surveys were discarded due to lack of PA data or inconsistent responses. The resulting 3,503 surveys provided an overall sampling error of 1.7% at a confidence level of 95.5%. The gender subgroups had a sampling error of 2.4%. The study was performed in accordance with the Helsinki Declaration of 1975, last modified in 2000, as regards the conduct of clinical research. The bioethics committee of the University of Las Palmas de Gran Canaria approved the study. Authorization for the access to school classrooms was previously obtained from the General Director of Education Department. Participants were informed about the objectives of the survey and verbal consent was obtained from them, and written consent from their parents. Data were analyzed anonymously.
Statistical analysis Statistical analysis were conducted separately for boys and girls. Since MVPA time and time engaged in screen-based behaviors (hNw21) did not follow a normal distribution percentiles and medians were calculated. The 95% confidence interval (95% CI) of the median was calculated using the Daly and Bourke formula [50]. Differences between boys and girls in the prevalence of the recommended levels of screen-time and MVPA were tested with chi-square test. Associations between MVPA and screen-based behaviors were analyzed using unconditional multiple logistic regression, with the activity level of the subjects as the binary dependent variable (sufficiently versus insufficiently active). The logistic regressions were unadjusted (bivariate) and adjusted for all
Measurements MVPA was assessed with the Minnesota Leisure Time Physical Activity Questionnaire (MLTPAQ), and the assessment period was limited to activities in the month preceding the interview. The questionnaire registered the number of days and the average duration of 58 recreational and occupational MVPAs lasting a minimum of 10 minutes. The physical activities of the MLTPAQ are classified according to their level of intensity expressed in metabolic equivalents (MET-min.), obtained from the CompenPLoS ONE | www.plosone.org
2
September 2011 | Volume 6 | Issue 9 | e24453
Physical Activity, Screen-Time and Adolescents
differences were small in jogging, swimming, treadmill and racquet sports (excluding table tennis).
screen-based behaviors in addition to the social environmental variables listed above, including age and municipality size. To assess the assumption of a linear relationship, two types of logistic regression analyses were performed: one, using a continuous variable of screen-time (hNd21) and the other, classifying the participants into 3 categories according to screen-time (#2 hNd21, .2 hNd21 and $4 hNd21). The #2 hNd21 category was used as the reference category. The odds ratio, the associated 95% CI and the goodness of fit with the Hosmer and Lemeshow test (HL test) were determined. Statistical analysis was performed with the SPSS v 15.0 software [51]. Statistical significance was assumed when p,0.05.
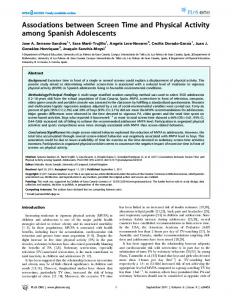
Physical activity and screen-time The boys achieved a higher median of total MVPA time (3.7 hNw21 more than girls, p,0.05) (Figure 1) due to the higher levels of vigorous PA of boys (p,0.05). The median of vigorous PA time was 6 hNw21 (95% CI 6.0–6.0) and 2.5 hNw21 (95% CI, 2.3– 3.0), in boys and girls, respectively (p,0.05). Both sex showed almost identical levels of moderate PA time (Figure 1). The TV screen-time median was 10.5 hNw21 (95% CI, 10.5– 10.5) and 14 hNw–1 (95% CI, 10.5–14.0) in boys and girls, respectively (Figure 2). In total, 34% boys (95% CI, 32–36%) and 43% of girls (95% CI, 40–45%) were above the recommended time for TV-watching (.2 hNd21 or .14 hNw21) (p,0.05) (Table 2). Computer use was the second most prevalent screenbased behavior among adolescents and reached a similar level in boys and girls (3–4 hNw21). Fifteen percent of boys (95% CI, 14– 17%) and girls (95% CI, 13–17%) were above 2 hNd21 of computer use (Table 2). Although for boys the weekly median video game playing time was 1.2 hNw21 (95% CI, 1.0–1.8), approximately 40% of them had not played any video games in the previous month (Figure 2), and 7% reported more than 2 h.d21. For girls, video game playing was uncommon; 1.1% of girls (95% CI, 0.6–1.6%) reported more than 2 hNd21 of video game playing. The interest in the use of portable mini-consoles was below 15% in boys and girls (12–18 years-old). Boys devoted about 3 hNw21 more time than girls to total screen time (p ,0.05). In total, 38% of boys (95% CI, 36–40%) and 31% of girls (95% CI, 29–33%) reported spending $4 hNd21 (28 hNw21) in front of screens (p,0.05). The time spent watching TV represented 55% (95% CI, 53–56%) and 66% (95% CI, 65– 68%) of the total screen time in boys and girls, respectively (p,0.05). Boys spent 2.2-fold more time in front of screens than in MVPA (95% CI, 2.1–2.4), while the corresponding value for girls was 3.0-fold (95% CI, 2.7–3.2).
Results Sample The final sample was compared with previously collected Spanish census data (Table 1). Age, gender and grade groups presented differences ranging from 0.5 to 4.8% compared to the national census data (2008). The data for all socio-demographic groups, with the exception of one, had a sampling error for the 95% CI that was within62.4–3.5%.
Physical activity levels Table 2 reports the levels of the MVPA and the main PA of the adolescent participants. In total, 26.2% of boys (95% CI, 24.1– 28.3%) and 46% of girls (95% CI, 43.7–48.3%) did not reach the recommended levels of MVPA. Walking (10 minutes or more) was the most prevalent PA in girls (80.3%, 95% CI, 78.5–82.1%). In boys, the most prevalent MVPA was playing soccer (66.2%, 95% CI, 63.9–68.5%), followed by walking (57.5%, 95% CI, 55.1– 59.9%). Thirty seven percent of subjects participated in fitness activities in gyms in the previous month. Compared to girls, boys had a 2.5 to 12.7-fold higher MVPA participation in biking, outdoor activities, weight-lifting training, soccer, motor sports and combat sports (p ,0.05). Girls had a 1.4 to 28-fold higher MVPA participation in walking, dancing, roller sports and aerobics than boys (p,0.05). There were no between-sex differences or the
Associations between screen-time and physical activity Logistic regression results are presented in Table 3. Results of bivariate analysis showed that boys who achieved $4 hNd21 in either TV watching, computer use, video game playing or total screen time had significantly increased probability of being not sufficiently active. In girls, there were no significant bivariate associations between screen-related behaviors and achievement of the recommended levels of MVPA. In boys, after adjustment, all screen-time-associated variables lost their association when analyzed separately, except total screen-time. For each one hour increase in total screen-time, the MVPA level fell by 7.5% (OR = 0.93, 95% CI, 0.88–0.99) in boys. The group which had a total screen-time $4 hNd21 was the main contributor to this association, showing a 64% risk (OR = 0.61, 95% CI, 0.44–0.86) of failing to meet the recommended level of MVPA. The HL goodness-of-fit-test for the adjusted model with categorical variables of screen-time achieved values of 0.44 and 0.21 in boys and girls, respectively. For the adjusted model with the continuous variable of total screen-time, the HL was 0.58 and 0.32 in boys and girls, respectively. The percentage of correctly predicted cases was between 65–77%. Social environmental variables were more strongly associated with MVPA than total screen-time. Participation in sports competitions and organized participation (physical activities directed by an instructor) demonstrated the most consistent association with achievement of the recommended MVPA in boys (Table 3). The appeal of physical education classes was
Table 1. Characteristics of age, gender and municipality size of study participants.
National Census
Sample N
%
% error
%
Gender Male
1 695
48.4
62.4
51.4
Female
1 808
51.6
62.4
48.6
Age 12 - ,14
920
26.3
63.3
26.8
14 - ,16
1173
33.5
62.9
28.7
16–18
1410
40.3
62.7
44.4
Municipality size #20,000 inhab.
1189
34.0
62.9
34.9
20,001–50,000 inhab.
823
23.5
63.5
15.4
50,001–100,000 inhab.
374
10.7
65.2
11.3
$100,001 inhab.
1117
31.9
63.0
38.4
doi:10.1371/journal.pone.0024453.t001
PLoS ONE | www.plosone.org
3
September 2011 | Volume 6 | Issue 9 | e24453
Physical Activity, Screen-Time and Adolescents
Table 2. Prevalence of physical activities and screen-related behaviors among adolescent participants in Gran Canaria Physical Activity Study.
Overall n
Boys %
95% CI
n
Girls %
95% CI
n
%
95% CI
Total of screen-time * #2 h/day
1138
33.4
61.6
488
29.5
62.2
650
37.1
62.3
.2,4 h/day
1085
31.9
61.6
532
32.2
62.3
553
31.6
62.2
$4 h/day
1180
34.7
61.6
633
38.3
62.3
547
31.3
62.2
Television * #2 h/day
2099
61.6
61.6
1093
65.9
62.3
1006
57.5
62.3
.2 h/day
1311
38.4
61.6
566
34.1
62.3
745
42.5
62.3
Computer #2 h/day
2960
84.9
61.2
1425
84.7
61.7
1535
85.0
61.6
.2 h/day
527
15.1
61.2
257
15.3
61.7
270
15.0
61.6
Video-games * #2 h/day
3350
96.0
60.7
1565
92.9
61.2
1785
98.9
60.5
.2 h/day
140
4.0
60.7
120
7.1
61.2
20
1.1
60.5
Portable mini-console* #2 h/day
3463
99.2
60.3
1663
98.5
60.6
1754
99.8
60.2
.2 h/day
29
0.8
60.3
25
1.5
60.6
4
0.2
60.2
Physical activity level
* a
Sufficiently active
2228
63.6
61.6
1251
73.8
62.1
977
54.0
62.3
Insufficiently active
1275
36.4
61.6
444
26.2
62.1
831
46.0
62.3
Physical activities Walking
2426
69.3
61.5
975
57.5
62.4
1451
80.3
61.8
Occupational
1787
51.0
61.7
686
40.5
62.3
1101
60.9
62.2
Recreational
1373
39.2
61.6
547
32.3
62.2
826
45.7
62.3
1324
37.8
61.6
491
29.0
62.1
833
46.1
62.3
631
18.0
61.3
21
1.2
60.5
610
33.7
62.2
464
13.2
61.2
221
13.0
61.6
243
14.0
61.6
Fitness Aerobics
b
Static cycling, treadmill Weight lifting Soccer Others team sports
c
416
11.9
61.1
298
17.6
61.8
118
6.5
61.1
1429
40.8
61.6
1122
66.2
62.3
307
17.0
61.7
1199
34.2
61.6
664
39.2
62.3
535
29.6
62.1
1130
32.3
61.5
313
18.5
61.8
817
45.2
62.3
Footing, jogging
845
24.1
61.4
403
23.8
62.0
442
24.4
62.0
d
638
18.2
61.3
405
23.9
62.0
233
12.9
61.5
343
9.8
61.0
178
10.5
61.4
165
9.1
61.3
600
17.1
61.2
264
15.6
61.7
336
18.6
61.8
Dancing
Racquet sports
Excluding table tennis Swimming PA in natural environments
e
Cycling
543
15.5
61.2
453
26.7
62.1
90
5.0
61.0
371
10.6
61.0
297
17.5
61.8
74
4.1
60.9
Ocupational
277
7.9
60.9
221
13.0
61.6
56
3.1
60.8
Recreational
161
4.6
60.7
131
7.7
61.3
30
1.7
60.6
307
8.8
60.9
48
2.8
60.8
259
14.3
61.6
181
5.2
60.7
127
7.5
61.3
54
3.0
60.8
140
4.0
60.6
129
7.6
61.3
11
0.6
60.4
Roller sports and PA Combat sports Motor sports
f
g
h
a
5 days per week of AFMV +300 minutes per week +1,800 MET per week; Aerobics, step and similar; Basketball, handball, volleyball, rugby, field hockey, baseball; d Tennis, badminton, paddle, squash, table tennis; e Surfing, windsurfing, diving, hunting, canoeing, rowing, sailing; f Skateboard, skate; g Judo, karate, taekwondo, fencing, wrestling; h Motocross, trial, motorcycling in track, karts; * p,0.05 for differences between boys and girls. doi:10.1371/journal.pone.0024453.t002 b c
PLoS ONE | www.plosone.org
4
September 2011 | Volume 6 | Issue 9 | e24453
Physical Activity, Screen-Time and Adolescents
Figure 1. Percentiles of time dedicated to moderate, vigorous and total of physical activities among adolescents participants. doi:10.1371/journal.pone.0024453.g001
positively associated with MVPA in boys and girls who answered that they liked the classes a lot compared to the adolescents who said they felt indifferent or low-attracted for the physical education classes. For each increase of 1 point (in a scale going from 1 to 5, being 5 the maximum level of appeal) the likelihood of achieving a sufficient level of MVPA increased by 25% in boys (p ,0.05) and 32% in girls (p ,0.05). Regular PA ($3 dNw21) of the father in case of boys and the mother in case of girls was positively associated with the likelihood of being sufficiently active (Table 3). The perceived access to PA spaces to a combination of outdoor and indoor facilities was positively associated with the likelihood of being sufficiently active in girls. To assess the relative contribution of each of the variables in the final variance explained by the multivariate analysis, we calculated the change (percentage) in the coefficient of determination (Nagelkerke’s pseudo R2) [52] using a step by step analysis. The variables that explained most of the variance of the multivariate analysis (pseudo R2) for the boys were participation in competitions (33%) and organized participation (20%). The corresponding variables in girls were organized participation (30%) and the appeal of the PE school courses (27%). Additionally, we checked the effect of removing organized participation and participation in competitions from the multivariate model. We noted that the associations between each sedentary behavior and MVPA levels tended to recover their value before adjustment in boys (Table 2). We also performed a series of logistic regression analyses using the recommended time for each screen-based activity (#2 hNd21) as dependent variables. Results showed that participation in organized PA decreased the risk of excessive use of TV by 33% in both sexes and video games by 59% in boys (all p,0.05). PLoS ONE | www.plosone.org
Discussion In agreement with our hypothesis, the total time spent in front of screens was associated with reduced physical activity in adolescents. However, this was not the case when each type of screen-related activity was analyzed separately, after adjustment for social environmental variables. The latter implies that the association between TV-watching and obesity should be explained by additional mechanisms apart from displacement of PA. For example, increased energy intake while watching TV associated with advertising persuasion to consume energy-rich foods [53–55]. In agreement, a small reduction in BMI, skinfold thickness and waist circumference was observed in an intervention study aiming at reducing the screen-time in children, even though no statistically significant differences in MVPA were observed between the intervention and the control group [56]. Our findings also concur with the study by Feldman et al. [57], who found no association between PA and the amount of time spent in sedentary screen-based activities in young Canadian high school students. Studies conducted with Portuguese and Turkish children and adolescents showed that screen-time and TV viewing did not discriminate between the active and inactive adolescents [58,59]. Similarly, a study with European adolescents found no associations between MVPA (measured with accelerometers) and the amount of time spent watching TV (assessed by questionnaire), suggesting that these two factors independently influence health [60]. It has been reported that inactivity is associated with several sedentary behaviors apart from TV-watching [37]. Our study support that the excess time accumulated in front of screens is negatively associated with MVPA. Consequently, making recom5
September 2011 | Volume 6 | Issue 9 | e24453
Physical Activity, Screen-Time and Adolescents
Figure 2. Percentiles of time dedicated to television, computer, video-game, portable mini consoles and total of screen-related behaviors among adolescents participants. doi:10.1371/journal.pone.0024453.g002
an increase of video game time, for example, would not necessarily affect occupational MVPAs. In our study, occupational activities, primarily walking, contributed markedly to the total MVPA. This could explain the lack of association between MVPA and individual screen-based sedentary activities in the present investigation. However, if the accumulation of time in screenbased activities occurs during different periods of day, a reduction of MVPA is more likely. In the present study, unadjusted screen-related behaviors were associated with MVPA among boys (as this was not the case among girls). However, these associations disappeared after accounting for the participation in organized PA, which was the principal contributor to the variance of MVPA. Participation in sport competitions in boys, and the appeal of PE classes in girls, were also associated independently to MVPA. These variables accounted for more than 50% of the value of the pseudo-R2. By removing these variables from the model, the association between excessive TV-watching ($4 hNd21), computer time, or playing video games with insufficient MVPA was statistically significant
mendations to limit the time in front a single screen (i.e., TV) may not be effective in increasing MVPA [35], since adolescents may replace the screen time by other sedentary behaviors. Paradoxically, computer-use time has been positively associated with PA [37,57,59]. In the present investigation computer use was only associated with reduced PA in the group with more than 4 h.d21 of computer use. However, this association was not significant after adjustment. Differences in the associations between MVPA and screenbased behaviors depending on the type of analysis (each behavior separately or all screen-based behaviors together) may be due to the time management of adolescents and children. Hager et al. [61] reported a negative association in 9- to 12-year-old children between screen-time and PA (measured with accelerometers) after school time periods but not in other moments, suggesting a displacement of PA only at certain times of day. This is consistent with the organization and management of time by children and adolescents according to mandatory, occupational and recreational activities depending on the different times of the day [62]. Thus, PLoS ONE | www.plosone.org
6
September 2011 | Volume 6 | Issue 9 | e24453
Physical Activity, Screen-Time and Adolescents
Table 3. Odds ratio for being sufficiently active in relation to screen-related behaviors and social environments variables among adolescents participants in Gran Canaria Physical Activity Study.
Unadjusted
Adjusted
Boys OR Total of screen-time
a
Girls 95% CI
95% CI
1.00
(0.96,
1.00
(ref.)
95% IC
0.93
(0.88,
1.00
(ref.)
95% IC
1.03
(0.98,
1.00
(ref.)
(0.91, (ref.)
.2 ,4 h/day
0.84
(0.63,
1.12)
1.05
(0.83,
1.32)
0.76
(0.58,
0.99) *
1.06
(0.81,
1.40)
$4 h/day
0.76
(0.58,
0.99)
*
1.00
(0.79,
1.25)
0.61
(0.44,
0.86) *
1.13
(0.85,
1.49)
0.98)
*
0.96
(0.90,
1.03)
0.91
(0.83,
1.01)
1.01
(0.94,
1.10)
1.00
(ref.)
1.00
(ref.)
1.00
(ref.)
0.77
(0.58,
1.03)
0.66
(0.41,
1.06)
1.09
(0.75,
1.58)
1.06
(0.98,
1.14)
0.90
(0.81,
1.00)
1.02
(0.93,
1.12)
1.00
(ref.)
1.00
(ref.)
1.00
(ref.)
1.42
(0.83,
2.44)
0.56
(0.31,
1.01)
1.18
(0.61,
2.29)
1.21
(0.97,
1.51)
1.08
(0.93,
1.26)
1.11
(0.97,
1.37)
1.00
(ref.)
1.00
(ref.)
1.00
(ref.)
1.70
(0.15,
18.8)
1.11
(0.36,
3.39)
0.86
(0.05,
14.9)
0.90
(0.60,
1.34)
0.76
(0.55,
1.05)
0.66
(0.39,
1.11)
1.00
(ref.)
1.00
(ref.)
1.00
(ref.)
0.28
(0.03,
0.60
(0.16,
2.21)
0.14
(0.01,
1.00
(ref.)
1.00
(ref.)
1.00
(ref.)
1.74
(1.38,
1.47
(1.03,
2.11) *
1.23
(0.92,
1.00
(ref.)
1.61)
1.36
(1.02,
1.00
(ref.)
2.78) *
2.12
(1.66,
$4 h/day Computer
a
0.90
(0.83,
1.00
(ref.)
0.60
(0.42,
0.88) 1.02)
0.94
(0.86,
1.00
(ref.)
0.55
(0.35,
0.87)
1.00
(0.89,
1.12)
1.00
(ref.)
0.47
(0.23,
0.97)
0.89
(0.69,
1.15)
#2 h/day
1.00
(ref.)
.2 a ,4 h/day
0.86
(0.36,
Inactive
1.00
(ref.)
Regular ($3 d/w-1)
1.76
(1.34,
Inactive
1.00
(ref.)
Regular ($3 d/w-1)
1.52
(1.16,
Non organized
1.00
(ref.)
Organized
2.93
(2.33,
#2 h/day $4 h/day Video-game
a
#2 h/day $4 h/day Portable mini-console
a
*
*
*
2.10)
2.72)
0.99) *
OR
0.95
#2 h/day
1.05)
OR
1.00
a
*
OR
Girls
#2 h/day
Television
0.99)
Boys
1.08)
1.63)
PA of father
2.31)
*
1.00
(ref.)
1.98)
*
1.71
(1.37,
1.00
(ref.)
3.68)
*
2.90
(2.39,
2.19)
*
1.00
(ref.)
2.14)
*
1.13
(0.79,
1.00
(ref.)
3.52)
*
2.07
(1.54,
1.65)
PA of mother
1.82)
*
2.71)
*
Organized participation
Sports competitions None
1.00
(ref.)
1.00
(ref.)
1.00
(ref.)
1.00
(ref.)
At least one (last year)
3.15
(2.51,
3.97)
*
2.66
(2.07,
3.42)
*
2.42
(1.81,
3.24) *
1.83
(1.33,
2.52)
*
b
1.42
(1.25,
1.61)
*
1.42
(1.28,
1.57)
*
1.25
(1.07,
1.47) *
1.32
(1.16,
1.49)
*
Low
1.00
(ref.)
1.00
(ref.)
1.00
(ref.)
1.00
(ref.)
Medium
1.14
(0.76,
1.70)
High
2.14
(1.51,
3.03)
None
1.00
(ref.)
Outdoor
1.25
(0.79,
Indoor
1.25
(0.69,
Outdoor and Indoor
1.83
(1.18,
2.84)
Appeal of PE classes
1.32
(0.99,
1.76)
2.43
(1.85,
3.20)
1.00
(ref.)
1.97)
1.58
(1.08,
2.31)
2.24)
1.54
(1.02,
2.33)
2.62
(1.86,
3.68)
*
0.90
(0.54,
1.49)
1.21
(0.86,
1.72)
1.52
(1.07,
2.37) *
1.97
(1.40,
2.77)
1.00
(ref.)
1.00
(ref.)
*
0.98
(0.55,
1.77)
1.36
(0.83,
*
1.04
(0.50,
2.20)
1.22
(0.73,
2.05)
*
1.42
(0.81,
2.50)
1.85
(1.20,
2.86)
*
*
Access to PA spaces
*
2.20)
*
a
For each increase of 1 hour per day; For each increase of 1 point in scale (0 = I don’t like it at all, 5 = I like it a lot); *p,0.05. doi:10.1371/journal.pone.0024453.t003 b
again. Our results showed that the likelihood of achieving a sufficient level of MVPA was twice as high for boys and girls participating in organized PA, regardless of participation in sports competitions. In agreement, children and adolescents who participated in organized activities had a higher level of PA than those in unorganized PA [63–65]. Participation in organized
PLoS ONE | www.plosone.org
sports has also been associated with reduced adiposity, improved lipid profile and enhanced cardio-respiratory fitness [5,66,67], as well as better performance in fundamental movement skills when compared to participation in unorganized PA [68]. Our study indicates that participation in organized MVPA and in sports competitions diminishes the risk of an insufficient level of
7
September 2011 | Volume 6 | Issue 9 | e24453
Physical Activity, Screen-Time and Adolescents
MVPA, even in adolescents spending excessive time in front of TV or video-games. In agreement, Vicente-Rodrı´guez et al. [69] reported that excessive use of TV ($3 hNd21) lost its association with decreased bone mass in adolescents who participated in organized sports. The present study underscores the importance of attractive PE courses, as previously reported [65,70–73]. Some activities associated with a masculine stereotype, such as the recommended use of weights to improve muscle strength and health [1,74], was hardly achieved by girls from this cohort. In agreement with other studies, approximately 2/3 of our adolescents followed the recommendations for TV-watching [32,37,75,76]. The 38 and 31% of boys and girls exceeding 4 hNd21 of total screen time had 64% higher risk of failing to achieve the recommended level of MVPA in the present study. Recommendations to limit the total time spent in front of screens [77] are supported by the present study. For cardiovascular risk prevention, the recommendations should account for the total time spent in sedentary activities, including also non-screen-based sedentary activities [34].
the schools present in Gran Canaria. As strengths, the evaluation of the involvement in sedentary screen-based activities was based on questionnaires, which have the advantage of analyzing separately the different screen-related behaviors (e.g., TV, computer use). In addition, our study includes a large number of participants and is the first study, to our knowledge, to evaluate the association between sedentary screen-based activity and MVPA among Spanish adolescents.
Conclusions Adolescents from Gran Canaria, despite the excellent all year around weather conditions, expend seated in front of screens as much time as that reported in other European countries. The girls were the main group at risk of physical inactivity, representing almost two-thirds of the inactive group. Part of the daily physical activity appears to be replaced by total screen time. Participation in organized physical activities and sports competitions seems to counteract the negative impact of excessive time in front of screens on physical activity. Therefore, it may be advisable to implement policies aiming at increasing the participation in organized physical activities, like sports and competitions.
Limitations and strengths This study has some limitations. The cross-sectional design impedes achievement of causal conclusions. MVPA and sedentary behaviors were assessed with questionnaires, which have lower validity and reliability than objective measures. Despite the limitations, the associations found between MVPA and environmental variables were consistent. The study population is only representative of the Island of Gran Canaria, which is culturally and ethnically comparable to the rest of the Spanish population. The sample was not stratified by the public or private adscription of the schools. Nevertheless, all schools had the same selection possibilities and the sample of schools studied is representative of
Acknowledgments The authors thank Orlando Rodrı´guez for his excellent technical assistance.
Author Contributions Conceived and designed the experiments: JASS SMT JSM CDG ALN. Performed the experiments: JASS SMT CDG JJGH. Analyzed the data: JASS SMT JJGH JSM CDG ALN. Contributed reagents/materials/ analysis tools: JASS SMT CDG ALN . Wrote the paper: JASS SMT JJGH JSM CDG ALN.
References 12. Hardy LL, Dobbins T, Booth ML, Denney-Wilson E, Okely AD (2006) Sedentary behaviours among Australian adolescents. Aust N Z J Public Health 30: 534–540. 13. Biddle SJ, Gorely T, Marshall SJ, Murdey I, Cameron N (2004) Physical activity and sedentary behaviours in youth: issues and controversies. J R Soc Health 124: 29–33. 14. Marshall SJ, Biddle SJ, Gorely T, Cameron N, Murdey I (2004) Relationships between media use, body fatness and physical activity in children and youth: a meta-analysis. Int J Obes Relat Metab Disord 28: 1238–1246. 15. Berkey CS, Rockett HR, Gillman MW, Colditz GA (2003) One-year changes in activity and in inactivity among 10- to 15-year-old boys and girls: relationship to change in body mass index. Pediatrics 111: 836–843. 16. Elgar FJ, Roberts C, Moore L, Tudor-Smith C (2005) Sedentary behaviour, physical activity and weight problems in adolescents in Wales. Public Health 119: 518–524. 17. Jago R, Baranowski T, Baranowski JC, Thompson D, Greaves KA (2005) BMI from 3-6 y of age is predicted by TV viewing and physical activity, not diet. Int J Obes (Lond) 29: 557–564. 18. Parsons TJ, Manor O, Power C (2007) Television viewing and obesity: a prospective study in the 1958 British birth cohort. Eur J Clin Nutr 62: 1355–1363. 19. Hardy LL, Denney-Wilson E, Thrift AP, Okely AD, Baur LA (2010) Screen time and metabolic risk factors among adolescents. Arch Pediatr Adolesc Med 164: 643–649. 20. Sardinha LB, Andersen LB, Anderssen SA, Quiterio AL, Ornelas R, et al. (2008) Objectively measured time spent sedentary is associated with insulin resistance independent of overall and central body fat in 9- to 10-year-old Portuguese children. Diabetes care 31: 569–575. 21. Martinez-Gomez D, Rey-Lopez JP, Chillon P, Gomez-Martinez S, VicenteRodriguez G, et al. (2010) Excessive TV viewing and cardiovascular disease risk factors in adolescents. The AVENA cross-sectional study. BMC Public Health 10: 274. 22. Aadahl M, Kjaer M, Jorgensen T (2007) Influence of time spent on TV viewing and vigorous intensity physical activity on cardiovascular biomarkers. The Inter 99 study. Eur J Cardiovasc Prev Rehabil 14: 660–665. 23. Torsheim T, Eriksson L, Schnohr CW, Hansen F, Bjarnason T, et al. (2010) Screen-based activities and physical complaints among adolescents from the Nordic countries. BMC Public Health 10: 324.
1. Cavill N, Biddle S, Sallis JF (2001) Health Enhancing Physical Activity for Young People: Statement of the United Kingdom Expert Consensus Conference. Pediatr Exer Sci 13: 12–25. 2. Pate RR, Davis MG, Robinson TN, Stone EJ, McKenzie TL, et al. (2006) Promoting physical activity in children and youth: a leadership role for schools: a scientific statement from the American Heart Association Council on Nutrition, Physical Activity, and Metabolism (Physical Activity Committee) in collaboration with the Councils on Cardiovascular Disease in the Young and Cardiovascular Nursing. Circulation 114: 1214–1224. 3. World Health Organization (2006) Promoting physical activity in schools: an important element of a health-promoting school. Geneva WHO. 4. Ara I, Vicente-Rodriguez G, Jimenez-Ramirez J, Dorado C, SerranoSanchez JA, et al. (2004) Regular participation in sports is associated with enhanced physical fitness and lower fat mass in prepubertal boys. Int J Obes Relat Metab Disord 28: 1585–1593. 5. Ara I, Vicente-Rodriguez G, Perez-Gomez J, Jimenez-Ramirez J, SerranoSanchez JA, et al. (2006) Influence of extracurricular sport activities on body composition and physical fitness in boys: a 3-year longitudinal study. Int J Obes 30: 1062–1071. 6. Sallis JF, Patrick K (1994) Physical Activity Guidelines for Adolescents: Consensus Statement. Pediatr Exer Sci 6: 302–314. 7. Brownson RC, Boehmer TK, Luke DA (2005) Declining rates of physical activity in the United States: what are the contributors? Annu Rev Public Health 26: 421–443. 8. Spanier PA, Marshall SJ, Faulkner GE (2006) Tackling the obesity pandemic: a call for sedentary behaviour research. Can J Public Health 97: 255–257. 9. Currie C, Roberts C, Morgan A, Smith R, Settertobulte W, et al. (2004) Young people’s health in context. Health Behaviour in School-aged Children (HBSC) study international report from the 2001/2002 survey. Copenhagen: World Health Organization. 10. Gorely T, Marshall SJ, Biddle SJ, Cameron N (2007) The prevalence of leisure time sedentary behaviour and physical activity in adolescent girls: An ecological momentary assessment approach. Int J Pediatr Obes. pp 1–8. 11. Marshall SJ, Biddle SJ, Sallis J, Mckenzie TL, Conway TL (2002) Cluster of sedentary behaviours and physical activitiy among youth: a cross-national study. Med Sci Sports Exer 34: 129.
PLoS ONE | www.plosone.org
8
September 2011 | Volume 6 | Issue 9 | e24453
Physical Activity, Screen-Time and Adolescents
24. Tsai HJ, Tsai AC, Nriagu J, Ghosh D, Gong M, et al. (2007) Associations of BMI, TV-watching time, and physical activity on respiratory symptoms and asthma in 5th grade schoolchildren in Taipei, Taiwan. J Asthma 44: 397–401. 25. Brodersen NH, Steptoe A, Boniface DR, Wardle J (2007) Trends in physical activity and sedentary behaviour in adolescence: ethnic and socioeconomic differences. Br J Sports Med 41: 140–144. 26. Gordon-Larsen P, Nelson MC, Popkin BM (2004) Longitudinal physical activity and sedentary behavior trends: adolescence to adulthood. Am J Prev Med 27: 277–283. 27. American Academy of Pediatrics (2001) Children, adolescents, and television. Pediatrics 107: 423–426. 28. Department of Health and Aging (2004) Australia’s Physical Activity Recommendations from 12–18 year olds. Canberra: Commonwealth of Australia. 29. Public Health Agency of Canada (2002) Canada’s Physical Activity Guide. Family guide to physical activity for youth. Otawa: Public Health Agency of Canada. 30. Robinson TN (1998) Does television cause childhood obesity? Jama 279: 959–960. 31. Vandewater EA, Shim MS, Caplovitz AG (2004) Linking obesity and activity level with children’s television and video game use. J Adolesc 27: 71–85. 32. Tammelin T, Ekelund U, Remes J, Nayha S (2007) Physical activity and sedentary behaviors among Finnish youth. Med Sci Sports Exerc 39: 1067–1074. 33. Biddle SJ, Marshall SJ, Gorely T, Cameron N, Murdey I (2003) Sedentary behaviors, body fatness and physical activity in youth: a meta-analysis. Med Sci Sports Exer 35: S178. 34. Martinez-Gomez D, Eisenmann JC, Gomez-Martinez S, Veses A, Marcos A, et al. (2010) Sedentary behavior, adiposity and cardiovascular risk factors in adolescents. The AFINOS study. Rev Esp Cardiol 63: 277–285. 35. Pate RR, O’Neill JR, Lobelo F (2008) The evolving definition of "sedentary". Exerc Sport Sci Rev 36: 173–178. 36. Taveras EM, Field AE, Berkey CS, Rifas-Shiman SL, Frazier AL, et al. (2007) Longitudinal relationship between television viewing and leisure-time physical activity during adolescence. Pediatrics 119: e314–319. 37. Melkevik O, Torsheim T, Iannotti RJ, Wold B (2010) Is spending time in screenbased sedentary behaviors associated with less physical activity: a cross national investigation. Int J Behav Nutr Phys Act 7: 46. 38. Bennett S, Woods T, Liyanage WM, Smith DL (1991) A simplified general method for cluster-sample surveys of health in developing countries. World Health Stat Q 44: 98–106. 39. Ainsworth BE, Haskell WL, Leon AS, Jacobs DRJ, Montoye HJ, et al. (1993) Compendium of physical activities: classification of energy cost of human physical activities. Med Sci Sports Exer 25: 71–80. 40. Ainsworth BE, Haskell WL, Whitt MC, Irwin ML, Swartz AM, et al. (2000) Compendium of physical activities: an update of activity codes and MET intensities. Med Sci Sports Exerc 32: S498–504. 41. Slinde F, Arvidsson D, Sjoberg A, Rossander-Hulthen L (2003) Minnesota leisure time activity questionnaire and doubly labeled water in adolescents. Med Sci Sports Exerc 35: 1923–1928. 42. Biddle SJ, Sallis JF, Cavill NA (1998) Young and Active? Young People and Health Enhancing Physical Activity—Evidence and Implications: A Report of the Health Education Authority Symposium, Young and Active? LondonUK: Health Education Authority. 43. Logstrup S, ed (2001) Children and young people – the importance of physical activity. Brussels: European Heart Health Initiative. 44. World Health Organization (2007) Promoting physical activity for health - a framework for action in the WHO European Region. Steps towards a more physically active Europe. Geneva: WHO, Regional Office for Europe 10: EUR/ 06/5062700/10 EUR/06/5062700/. 45. Gortmaker SL, Peterson K, Wiecha J, Sobol AM, Dixit S, et al. (1999) Reducing obesity via a school-based interdisciplinary intervention among youth: Planet Health. Arch Pediatr Adolesc Med 153: 409–418. 46. Hernandez B, Gortmaker SL, Laird NM, Colditz GA, Parra-Cabrera S, et al. (2000) [Validity and reproducibility of a questionnaire on physical activity and non-activity for school children in Mexico City]. Salud publica de Mexico 42: 315–323. 47. Hardy LL, Booth ML, Okely AD (2007) The reliability of the Adolescent Sedentary Activity Questionnaire (ASAQ). Prev Med 45: 71–74. 48. Ferreira I, van der Horst K, Wendel-Vos W, Kremers S, van Lenthe FJ, et al. (2007) Environmental correlates of physical activity in youth - a review and update. Obes Rev 8: 129–154. 49. Gordon-Larsen P, McMurray RG, Popkin BM (2000) Determinants of adolescent physical activity and inactivity patterns. Pediatrics 105: E83.
PLoS ONE | www.plosone.org
50. Daly LE, Bourke GJ (2000) Interpretations and Uses of Medical Statistics. Fifth Edition. BodminCornwall: Blackwell Science. pp 109–110. 51. SPSS (2006) Statistical Package for Social Science, Base 15.0 User’s Guide. Chicago: IL: SPSS Inc. 52. Nagelkerke NJD (1992) Maximum likelihood estimation of functional relationships. Berlin: Springer-Verlag. 53. Borzekowski DL, Robinson TN (2001) The 30-second effect: an experiment revealing the impact of television commercials on food preferences of preschoolers. J Am Diet Assoc 101: 42–46. 54. Matheson DM, Killen JD, Wang Y, Varady A, Robinson TN (2004) Children’s food consumption during television viewing. Am J Clin Nutr 79: 1088–1094. 55. Robinson TN (2001) Television viewing and chilhood obesity. Pediatr Clin North Am 48: 1017–1725. 56. Robinson TN (1999) Reducing children’s television viewing to prevent obesity: a randomized controlled trial. Jama 282: 1561–1567. 57. Feldman DE, Barnett T, Shrier I, Rossignol M, Abenhaim L (2003) Is physical activity differentially associated with different types of sedentary pursuits? Arch Pediatr Adolesc Med 157: 797–802. 58. Karaca A, Caglar E, Bilgili N, Ayaz S (2010) Screen time of adolescents in an economically developing country: The case of Turkey. Ann Hum Biol 37. 59. Santos MP, Gomes H, Mota J (2005) Physical activity and sedentary behaviors in adolescents. Ann Behav Med 30: 21–24. 60. Ekelund U, Brage S, Froberg K, Harro M, Anderssen SA, et al. (2006) TV viewing and physical activity are independently associated with metabolic risk in children: the European Youth Heart Study. PLoS medicine 3: e488. 61. Hager RL (2006) Television viewing and physical activity in children. J Adolesc Health 39: 656–661. 62. Mora´n M, Caride J (2005) [School day in usual day of children] La jornada escolar en la vida cotidiana de la infancia. Cuadernos de Pedagogı´a. pp 64–69. 63. Saar M, Jurimae T (2007) Sports participation outside school in total physical activity of children. Percept Mot Skills 105: 559–562. 64. Mota J, Esculcas C (2002) Leisure-time physical activity behavior: structured and unstructured choices according to sex, age, and level of physical activity. Int J Behav Med 9: 111–121. 65. Garcia Bengoechea E, Sabiston CM, Ahmed R, Farnoush M (2010) Exploring links to unorganized and organized physical activity during adolescence: the role of gender, socioeconomic status, weight status, and enjoyment of physical education. Res Q Exerc Sport 81: 7–16. 66. Dowda M, Ainsworth BE, Addy CL, Saunders R, Riner W (2001) Environmental influences, physical activity, and weight status in 8- to 16-yearolds. Arch Pediatr Adolesc Med 155: 711–717. 67. Manios Y, Yiannakouris N, Papoutsakis C, Moschonis G, Magkos F, et al. (2004) Behavioral and physiological indices related to BMI in a cohort of primary schoolchildren in Greece. Am J Hum Biol 16: 639–647. 68. Okely AD, Booth ML, Patterson JW (2001) Relationship of physical activity to fundamental movement skills among adolescents. Med Sci Sports Exerc 33: 1899–1904. 69. Vicente-Rodriguez G, Rey-Lopez JP, Martin-Matillas M, Moreno LA, Warnberg J, et al. (2008) Television watching, videogames, and excess of body fat in Spanish adolescents: the AVENA study. Nutrition 24: 654–662. 70. Centers for Disease Control and Prevention (1997) Guidelines for school and community programs to promote lifelong physical activity among young people. National Center for Chronic Disease Prevention and Health Promotion, Centers for Disease Control and prevention. J Sch Health 67: 202–219. 71. Pate RR, Hohn RC (1994) ‘Health-related Physical Education – A direction for the 21st century’. In :Pate R, Hohn RC, eds. Health and Fitness Through Physical Education. ChampaignIL: Human Kinetics. pp 215–217. 72. Pate RR, O’Neill JR (2009) After-school interventions to increase physical activity among youth. Br J Sports Med 43: 14–18. 73. Pate RR, Saunders R, Dishman RK, Addy C, Dowda M, et al. (2007) Longterm effects of a physical activity intervention in high school girls. Am J Prev Med 33: 276–280. 74. Ortega FB, Ruiz JR, Castillo MJ, Sjostrom M (2008) Physical fitness in childhood and adolescence: a powerful marker of health. Int J Obes (Lond) 32: 1–11. 75. Marshall SJ, Gorely T, Biddle SJ (2006) A descriptive epidemiology of screenbased media use in youth: a review and critique. J Adolesc 29: 333–349. 76. Rey-Lopez JP, Vicente-Rodriguez G, Ortega FB, Ruiz JR, Martinez-Gomez D, et al. (2010) Sedentary patterns and media availability in European adolescents: The HELENA study. Prev Med 51: 50–55. 77. Rey-Lopez JP, Vicente-Rodriguez G, Biosca M, Moreno LA (2008) Sedentary behaviour and obesity development in children and adolescents. Nutr Metab Cardiovasc Dis 18: 242–251.
9
September 2011 | Volume 6 | Issue 9 | e24453