BIOINFORMATICS APPLICATIONS NOTE Systems biology
Vol. 27 no. 9 2011, pages 1339–1340 doi:10.1093/bioinformatics/btr138
Advance Access publication March 16, 2011
AStream: an R package for annotating LC/MS metabolomic data Arnald Alonso1 , Antonio Julià1,∗ , Antoni Beltran2,3 , Maria Vinaixa2,3 , Marta Díaz3,4 , Lourdes Ibañez3,4 , Xavier Correig2,3 and Sara Marsal1,∗ 1 Grup
de Recerca de Reumatologia, Institut de Recerca de l’Hospital Universitari Vall d’Hebrón (Univ. Autònoma de Barcelona), Barcelona, 2 Metabolomics Platform, URV-IISPV, Tarragona, 3 CIBERDEM (CIBER de Diabetes y Enfermedades Metabólicas Asociadas), 4 Endocrinology Unit, Hospital Sant Joan de Déu (UB), Barcelona, Spain
Associate Editor: Trey Ideker
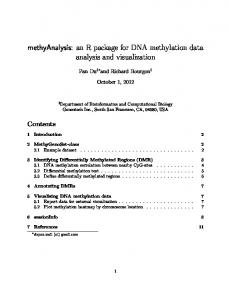
Fig. 1. Flowchart depicting AStream processing steps. Received on December 16, 2010; revised on February 25, 2011; accepted on March 9, 2011
1
INTRODUCTION
Recent improvements in chromatographic technologies and spectrometry analysis techniques have increased the use of metabolomics for disease diagnosis and in systems biology (Kaddurah-Daouk et al., 2008). Liquid chromatography mass spectrometry (LC/MS) is a powerful and widely used method for identifying and quantifying metabolites in biological samples. After applying a data pre-processing algorithm, a large set of feature peaks is usually obtained for each sample; each feature is characterized by a particular retention time, mass-to-charge (m/z) value and an intensity measurement that is correlated with the relative concentration of the particular metabolite. Bioinformatic methods such as XCMS (Smith et al., 2006) can perform these complex pre-processing steps. However, once the set of feature peaks is obtained, a time-consuming and error-prone manual curation step is required, particularly when an untargeted metabolomic analysis needs to be performed. The main objectives of the curation step are to reduce redundancy between the various chemical forms detected in one compound (e.g. carbon isotopes, adducts, fragments) and to identify characteristics with a higher probability of being true biological features rather than being generated by noise artifacts or potential sample contamination. ∗ To
whom correspondence should be addressed.
AStream has been developed in order to facilitate the curation step of the analytical flow of metabolomic experiments. Using robust measures from relational patterns, AStream quickly identifies the set of metabolites that most reliably represents the metabolomic profile of each sample.
2
METHODS
AStream was built using the ‘R’ open-source statistical programming environment and can be easily integrated into typical metabolomics data analysis pipelines (Fig. 1). In particular, it can be integrated with the processed metabolomic data objects generated by the XCMS R-package, which is a commonly used open-source LC/MS processing data software. In addition, the end user can import feature data from other available data pre-processing methods. Outliers can have dramatic effects on the quality of the results obtained from high-throughput analyses. Before identifying redundant sets of pairs, AStream performs a quality control step to identify potential outlier samples. By comparing the global intensity distributions from all the samples, those samples with an overly distinct metabolomic profile can be traced and discarded (Supplementary Material and Supplementary Figure S1). The AStream package allows users to modify the threshold levels for outlier detection according to the experimental stringency applied. Once outliers are discarded, AStream performs a pairwise correlation analysis on all the features present in the data. This correlation is computed over the feature peak intensities of all the samples and, from this, a confidence measure is obtained which is proportional to the feature pair probability of being chemical forms of one same metabolic compound. While other approaches (Tautenhahn et al., 2007) analyze the individual chromatogram
© The Author 2011. Published by Oxford University Press. All rights reserved. For Permissions, please email:
[email protected]
[18:27 5/4/2011 Bioinformatics-btr138.tex]
Downloaded from http://bioinformatics.oxfordjournals.org/ at UNIVERSITAT ROVIRA I VIRGILI on October 2, 2013
ABSTRACT Summary: AStream, an R-statistical software package for the curation and identification of feature peaks extracted from liquid chromatography mass spectrometry (LC/MS) metabolomics data, is described. AStream detects isotopic, fragment and adduct patterns by identifying feature pairs that fulfill expected relational patterns. Data reduction by AStream allows compounds to be identified reliably and subsequently linked to metabolite databases. AStream provides researchers with a fast, reliable tool for summarizing metabolomic data, notably reducing curation time and increasing consistency of results. Availability: The AStream R package and a study example can be freely accessed at http://www.urr.cat/AStream/AStream.html. Contact:
[email protected];
[email protected] Supplementary information: Supplementary data are available at Bioinformatics online.
1339
Page: 1339
1339–1340
A.Alonso et al.
correlations, we chose to use the intensity correlations across samples. This new approach has the advantage that it does not require the raw LC/MS data (i.e. only feature intensities) and it uses the data of all the samples, which results in both in a decrease of the computational load and the exploitation of the joint information between samples. In AStream, only feature pairs having high correlation values and low retention time differences will be kept for further analysis (Supplementary Figure S1 and Supplementary Table S1). The next step identifies feature pairs corresponding to carbon isotopes of the same compound. Isotope identification has two practical advantages, namely, (i) the reduction of the final number of features by removing redundant isotopic features and (ii) the increase of the annotation reliability due to the presence of multiple isotopic peaks from one same metabolite (Theodoridis et al., 2008). This search is performed by identifying the feature pairs having both the expected m/z differences and the expected concentration ratios between isotopic peaks (Supplementary Table S2 and Supplementary Figure S2). Searching for metabolite adducts is the last analytical step of AStream. Once the features with isotopic patterns have been identified, the m/z values are compared against m/z values of all the features of the previously filtered feature set. For this objective, AStream provides a default list of common adducts. However, the group of expected metabolite adducts is related to the particular LC/MS experimental setup, and the user can import their own reference list. Using prior knowledge of the expected m/z differences between protonated compounds (i.e. [M+H+]) and their corresponding adducts, AStream can identify them by searching for peaks within the expected m/z values of each adduct with respect to the m/z value of the protonated feature. The filtered feature set is created by excluding the feature pairs with low correlation and/or high retention time differences. Therefore, the feature pairs matching the expected adduct m/z differences have an increased probability of being true positives (Supplementary Figure S3). Although the presence of at least one isotopic peak is an important confidence measure to identify true biological compounds, AStream also allows the user to search for adducts without restricting the identification to the features having isotopic patterns. In order to facilitate visualization of results relating to curated data, AStream summarizes them and exports them in a tabulated file. This results file demonstrates that AStream has fulfilled two main objectives of metabolomics data workflow: (i) reduction of the excessive redundancy present in typical metabolomics datasets; and (ii) discrimination of features with a higher probability of representing true biological compounds from those caused by noise artifacts or experimental contamination.
3
RESULTS
An LC/MS dataset obtained from 20 human serum samples was used to evaluate AStream performance (Ibañez,L. and Correig,X., unpublished data). For illustration purposes, the samples were randomly assigned as n = 10 controls and n = 10 cases (of note, randomization does not influence AStream metabolite annotation, only the significance value for differential expression). After raw data processing analysis had been applied using the XCMS package, a total of n = 3148 features were generated. This pre-processed metabolomic dataset is included in the AStream library. Using this dataset, AStream was used to process the large feature list into a curated, non-redundant metabolite set. The quality control step allowed one serum sample to be identified displaying an outlying feature distribution and this was automatically discarded from further analyses (Supplementary Figure S1). In addition, the observed retention time differences and correlation histograms of all feature pairs (Supplementary Material) were used to select the optimal feature pair selection thresholds. On the basis of this information, a maximum retention time difference of 3 s and a minimum correlation value of 0.75 were used in the present analysis (Supplementary Material and Supplementary Table S1).
Fig. 2. These features correspond to the 12 C/13 C isotopes and to different adducts generated from one same metabolite (3-Methylsuberic acid). Noticeably, the high degree of similarity of the intensity distributions in all n = 19 samples is a clear evidence in favor of this being a true positive and supports the robustness of AStream’s feature curation approach.
The final number of feature pairs passing the filters was n = 11 317 from a total of n = 4 953 378 possible pairs (i.e. 0.23%). After the mass to charge ratio (m/z) tolerance for isotope and adduct searching was set to 3e - 3 (according to the precision of the particular LC/MS equipment used), a total of 431 isotope patterns were obtained (Supplementary Figure S2 and Supplementary Table S2). Of these 431 isotope patterns, 68 patterns were linked to other features corresponding to different adducts present in the samples (Supplementary Figure S3). In the final curated set of metabolomic compounds generated by AStream (Supplementary Table S3) all features were characterized by a minimum of two isotopic peaks (Fig. 2), thereby increasing confidence in the metabolite annotation. In conclusion, applying AStream to the present dataset resulted in a >7-fold reduction (i.e. from n = 3148 features to n = 431 annotated compounds) in the number of metabolite features. Importantly, this non-redundant set of features fulfilled the expected relational patterns associated with LC/MS analysis and had an increased probability of being true positive signals. AStream allows researchers interested in performing LC/MS metabolomic studies to use a practical and robust tool for analyzing data obtained from this type of experiment. Funding: Ministerio de Ciencia e Innovación Strategic Project (grant number PSE-010000-2006-6). Conflict of Interest: none declared.
REFERENCES Kaddurah-Daouk,R. et al. (2008) Metabolomics: a global biochemical approach to drug response and disease. Ann. Rev. Pharmacol. Toxicol., 48, 653–683. Smith,C.A. et al. (2006) XCMS: processing mass spectrometry data for metabolite profiling using nonlinear peak alignment, matching, and identification. Anal. Chem., 78, 779–787. Tautenhahn,R. et al. (2007) Annotation of LC/ESI-MS mass signals. In Hochreiter,S. and Wagner,R. (eds) Bioinformatics Research and Development. Springer, Berlin/Heidelberg, pp. 371–380. Theodoridis,G. et al. (2008) LC-MS-based methodology for global metabolite profiling in metabonomics/metabolomics. Trends Anal. Chem., 27, 251–260.
1340
[18:27 5/4/2011 Bioinformatics-btr138.tex]
Page: 1340
1339–1340