Astronomy & Astrophysics
A&A 407, 735–740 (2003) DOI: 10.1051/0004-6361:20030894 c ESO 2003
Dynamics of the solar chromosphere IV. Evidence for atmospheric gravity waves from TRACE R. J. Rutten and J. M. Krijger Sterrekundig Instituut, Postbus 80 000, 3508 TA Utrecht, The Netherlands e-mail:
[email protected];
[email protected] Received 23 July 2002 / Accepted 6 June 2003 Abstract. We study the low-frequency brightness modulation of internetwork regions in the low solar chromosphere using
simultaneous ultraviolet and white-light image sequences from the Transition Region and Coronal Explorer (TRACE). The ultraviolet sequences exhibit a slowly varying brightness pattern in internetwork regions on which the more familiar acoustic three-minute oscillation is superimposed, with about half of the peak brightness reached in internetwork grains contributed by the low-frequency background. We address the nature of the latter, applying two-dimensional Fourier filtering to isolate it from the acoustic modulation. Spatio-temporal comparisons and selective time-delay scatter correlations between the ultraviolet and white-light low-frequency sequences establish that reversed granulation constitutes at most a minor part of the ultraviolet background. Fourier analysis shows that the meso-scale contribution dominates and consists of atmospheric gravity waves. Key words. Sun: photosphere – Sun: chromosphere – Sun: oscillations
1. Introduction This paper addresses oscillations of the quiet solar atmosphere in internetwork regions. It is a sequel to Krijger et al. (2001, henceforth Paper III) which used ultraviolet image sequences from the Transition Region and Coronal Explorer (TRACE) to study acoustic oscillations in the low chromosphere. We now concentrate on the striking low-frequency brightness pattern in these images and consider the contributions by reversed granulation and internal gravity waves1 . The general context of quietSun oscillations was reviewed in Paper III. We only summarize the pertinent literature on reversed granulation and atmospheric gravity waves here. Reversed granulation was first diagnosed from the partial contrast reversal in the inner wings of Ca H & K by Evans & Catalano (1972, cf. Suemoto et al. 1987, 1990). Subsequent spectrometry using weaker lines established that the granulation pattern reverses in intensity already at height h ≈ 150 km and is replaced by “something else”, possibly gravity waves, above h ≈ 300 km (e.g., Deubner 1988; Balthasar et al. 1990; Komm et al. 1991; Kucera et al. 1995; Espagnet et al. 1995; Hanslmeier et al. 2000). Solar-atmosphere gravity waves were studied theoretically by e.g., Whitaker (1963), Lighthill (1967), Stein (1967) and Send offprint requests to: R. J. Rutten, e-mail:
[email protected] 1 We call these “atmospheric gravity waves” to distinguish them from the elusive global g-modes at the suggestion of D. Banerjee.
Schmieder (1977), culminating in the comprehensive analyses of Mihalas & Toomre (1981, 1982). The upshot is that gravity waves should be copiously excited by convective overshoot, should be abundantly present in the upper photosphere and low chromosphere, and should gain large brightness amplitude at their breaking height. However, they are not easily detected because they combine long periods with short wavelengths, comparable to and hard to disentangle from granulation, and because they propagate preferentially in slanted directions, producing only small radial Dopplershifts and quickly moving off a high-resolution pixel or spectrometer slit. Observationally, the strongest evidence of gravity-wave presence in the middle photosphere has been presented by Straus & Bonaccini (1997) using wavenumber- and frequency-resolved (kh , f ) phase-difference spectra and horizontal propagation diagrams. Before that, mid-photospheric gravity waves were similarly noted in (kh , f ) diagrams by Kneer & von Uexk¨ull (1993) and suggested on the basis of various other diagnostics by Frazier (1968), Schmieder (1976), Cram (1978), Brown & Harrison (1980), Durrant & Nesis (1981), Staiger et al. (1984), Staiger (1987), Deubner & Fleck (1989), Bonet et al. (1991), and Komm et al. (1991). The internetwork regions of quiet-sun ultraviolet images show a low-frequency brightness modulation pattern similar to the wispy mesh pattern observed in Ca H or K filtergrams (Fig. 3 of Lites et al. 1999). It was attributed to gravity waves in Paper III on the basis of downward phase propagation in ultraviolet (kh , f ) phase-difference diagrams. TRACE’s
736
R. J. Rutten and J. M. Krijger: Gravity waves from TRACE
ultraviolet passbands are especially suited to gravity-wave diagnosis because they sample layers well above the photospheric granulation at about the wave breaking height (Sect. IVc of Mihalas & Toomre 1981), do so in intensity rather than velocity (Sect. IVe of Mihalas & Toomre 1982), and permit dual wavelength phase-difference evaluation with the small difference in formation height (about 50 km) and spatial resolution (1 arcsec) that are appropriate to track gravity-wave packets at slanted propagation (Sect. IIIc of Mihalas & Toomre 1981). In this paper we combine similar ultraviolet (kh , f ) phasedifference measurements (Fig. 3) with comparisons with simultaneously taken TRACE white-light images (Figs. 1, 2, 4, 5). The latter serve to quantify the contribution of reversed granulation to the ultraviolet background pattern. We find that it constitutes only a minor part, and that the major part is due to meso-scale atmospheric gravity waves.
2. Observations and reduction The TRACE observations and their reduction are detailed in Paper III. Here we use the October 14, 1998 data since on this date white-light imaging was added to the cyclic 1700 Å, 1600 Å and 1550 Å bandwidth selection. The field of view covered a very quiet area at disk center (Fig. 3 of Paper III). The four image sequences were aligned and corrected for solar rotation, yielding four co-spatial and co-temporal data cubes. Each consists of 611 images of 512 × 512 px2 at 0.5 arcsec/px spatial scale covering a duration of 3.7 hours at 22 s cadence. In some displays below three-dimensional spatio-temporal “Fourier cone” filtering is employed to remove all brightness modulation components with apparent horizontal speeds below 6 km s−1 (supersonic, “high-pass”) or in excess of this value (subsonic, “low-pass”). The high-pass filter selects the acoustic p-mode and three-minute oscillations, the low-pass filter removes these. Fourier ringing is avoided by applying cosine edge tapers, for the cone filter over v = 6−7 km s−1 , for the data cubes over the first and last 12 spatial and temporal samples. The measured intensities were converted into approximate brightness temperatures to calibrate the modulation scales in Fig. 2. The temperature scale was defined by equating the cube means to T b = 5929 K for white light and to T b = 4453 K for 1700 Å on the basis of the solar spectrum compilation in Vernazza et al. (1976). Only small parts of the data cubes are used in Fig. 1 to gain sufficient magnification. The scatter diagrams in Fig. 2 are measured from 256 × 256 px2 subfields after removal of the taper zones and 3×3 px2 boxcar smoothing to suppress noise, cosmic ray hits, and pointing jitter. The Fourier analyses in Figs. 3–5 are based on the full unsmoothed data cubes.
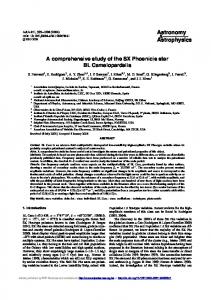
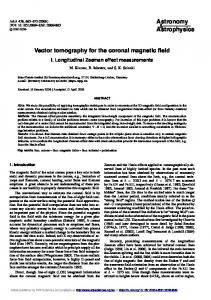
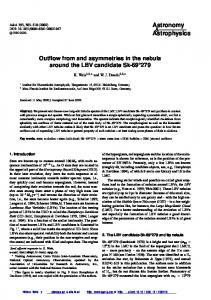
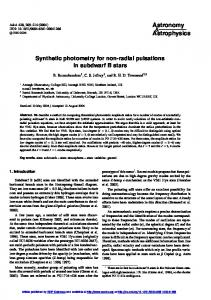
3. Analysis and results Space-time representations. Figure 1 compares the whitelight scene and its evolution at left with the co-spatial and co-temporal 1700 Å scene and its evolution at right. The two images in the top panels show grainy patterns with comparable grain sizes. The distinction between dark internetwork and
Fig. 1. Image and time-slice samples. Left: white-light intensity. Right: co-temporal and co-spatial 1700 Å intensity. The X and Y coordinates are angles from solar disk center on the sky, with Y directed toward the solar north pole. The time of observation is halfway the time slices in the lower two rows (white markers). The slices show the temporal intensity evolution during 30 min of observation for a horizontal cut through an internetwork area (white markers in top panels). The greyscale is linear for the upper four panels but clipped at 50% for the 1700 Å panels to enhance the internetwork contrast. The bottom slices are low-pass filtered and show brightness temperature, at left on a reversed linear scale, at right on a logarithmic scale.
bright network is obvious in the ultraviolet image even at 50% brightness clipping. The white-light time slice in the second row displays granular evolution plus five-minute p-mode modulation. The ultraviolet slice has a bright streak near X = −100 arcsec marking a weak network element. Elsewhere it shows intermittent internetwork grains comparable to Ca K2V grains (Rutten et al. 1999). In high-resolution Ca K data, the latter occur in three-minute oscillation sequences which are superimposed on a more extended and slower-evolving “wispy” background pattern (Cram & Dam´e 1983; Lites et al. 1999; Fig. 10 of Paper III). A similar superposition of three-minute internetwork grains and a lower-frequency modulation pattern is seen here. The subsonic low-frequency components are isolated in the bottom panels of Fig. 1 through low-pass filtering after conversion into brightness temperature. The white-light greyscale
R. J. Rutten and J. M. Krijger: Gravity waves from TRACE
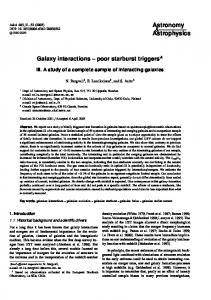
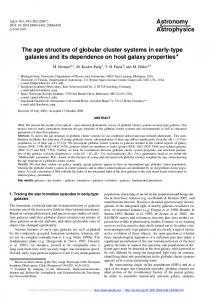
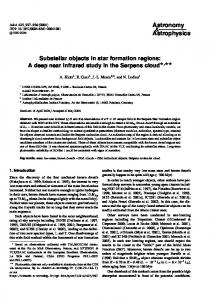
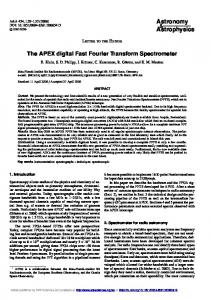
Fig. 2. Time-delay scatter correlations. First column: unfiltered UV(t+ ∆t) against WL(t) for the whole field. Second column: low-pass UV(t + ∆t) against low-pass WL(t) for internetwork pixels only. Third column: unfiltered UV(t + ∆t) against low-pass UV(t) for internetwork pixels only. Scales: approximate brightness temperature in Kelvin, at left for the first column, at right for the second and third columns. The time delay ∆t is specified at left in each panel, the overall correlation coefficient at right. The solid curves in the top panels show the occurrence distributions on inverted normalized scales. The dashed curves show the first moments of the sample density distributions over x and y bins. They become perpendicular in the absence of correlation between the x and y quantities.
is reversed to indicate how reversed granulation should appear. The internetwork background streaks in the ultraviolet slice are noticeably shorter than the intergranular ones, and show larger horizontal displacements (tilts). There is no obvious correspondence between reversed granulation at left and low-frequency internetwork modulation at right. They differ intrinsically. Time-delay scatter representations. Figure 2 compares the white light (WL) and 1700 Å (UV) images in the form of pixelby-pixel correlation plots. Each plotted sample represents the brightness values specified along the x and y axes at a given pixel location in the field. In order to obtain good statistics such pairwise comparisons are made for millions of pixels using
737
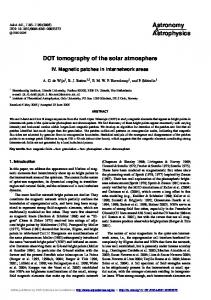
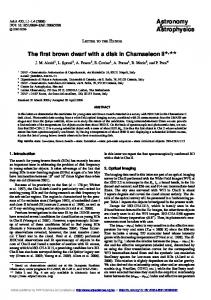
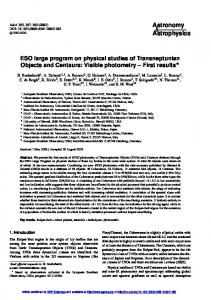
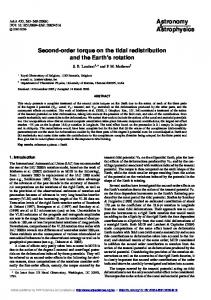
Fig. 3. Two-dimensional Fourier spectra. Upper panel: 1700 Å intensity power. Lower panel: ∆φ(1700− 1600) intensity phase difference. Axes: horizontal wavenumber kh and temporal frequency f . The corresponding wavelengths and periodicities are specified along the top and the righthand sides of each panel. Greyscale: power and phase difference coding specified in the bars above the panels. The white curves along the sides are the temporal and spatial means, on linear scales in arbitrary units (with zero phase difference indicated by a thinner line at right in the lower panel). The slanted black line in the upper panel is the Lamb line f = (1/2π) cs kh for cs = 7.1 km s−1 . The contours in the lower panel specify 1700–1600 Å coherence at values C = 0.4, 0.6, 0.8 and 0.95 with the ticks directed to lower values. The columnar pattern in the upper panel is an artifact from TRACE data compression.
sequential image pairs. Plot saturation is avoided by plotting the central parts as sample density contours. From the top down, the column panels are for increasing time delay between the two pixel samplings (UV after WL). The UV–WL sequence in the first column shows some persistent bright-bright correlation, slight anticorrelation for low WL at ∆t = 3 min, and subsequent lack of persistent correlation at low UV brightness. This UV–WL cross-correlation is partially decomposed in the other columns. Both are limited to internetwork areas only, using a stringent mask derived in Paper III which designates only a third of the observed field as internetwork. The removal of the network reduces the upward
738
R. J. Rutten and J. M. Krijger: Gravity waves from TRACE
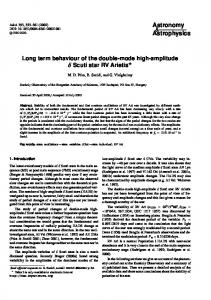
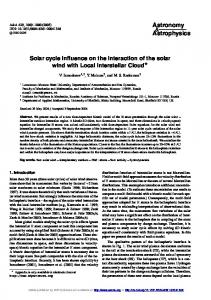
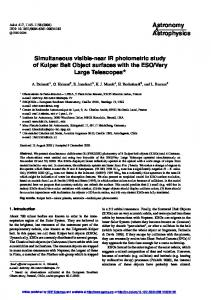
Fig. 4. Temporal Fourier spectra for white light and 1700 Å intensity, spatially averaged over internetwork only. Abscissa: temporal frequency, corresponding periodicity specified along the top. Solid curves in the lower half: logarithmic power spectra (scale at right) with 1σ estimates (the lower ones drop below the abscissa). Solid curve near the top: coherence C between white light and 1700 Å, with 1σ estimates (dotted), scale at right. Random noise has C = 0.45. Scatter diagram in the middle: phase differences ∆φ(WL−1700), scale at left, positive values corresponding to white light intensity leading 1700 Å intensity, with normalized cross-power greyscale weighting. The jagged curve, with 1σ companions, is the spatial vector average. See Paper III for computational detail.
distribution tail. The ultraviolet brightness temperature range diminishes accordingly (scale at right). The second column displays the UV–WL internetwork correlation after low-pass filtering. The removal of the threeminute oscillation reduces the UV modulation amplitude, but not by much. This sequence shows that the slight anticorrelation in the first column is set by the slow components, namely a tendency for bright UV background to be located above intergranular lanes. This anticorrelation increases initially with the sampling time delay, reaches C = −0.23 at ∆t ≈ 5 min, and survives even longer. However, the anticorrelation is only weak. Most of the UV background pattern in these data is therefore not reversed granulation. Note that although TRACE doesn’t resolve granulation very well (the WL distribution along the top of the first panel has a halfwidth of only 70 K), the anticorrelation signature of reversed granulation would survive spatial smearing if there isn’t something else contributing brightness patterning at these temporal frequencies. Note also that Fig. 5, discussed below, establishes that the weak anticorrelation is due to larger than granular scales. The third column of Fig. 2 correlates unfiltered UV with low-pass filtered UV in order to demonstrate the importance of the low-frequency ultraviolet background to internetwork grain formation. The high initial correlation shows that ultraviolet internetwork brightness extrema occur preferentially in phase with the slow-changing internetwork background. The 2:1 slope shows that the low-frequency background and the acoustic three-minute oscillation share about equally in the total variation, including the production of the brightest internetwork grains. This summation survives over about five minutes,
Fig. 5. Two-dimensional ∆φ(WL − 1700) phase difference spectrum between white light intensity and 1700 Å intensity. Format as in Fig. 3. The contours specify coherence levels C = 0.1, 0.2 and 0.5, with the ticks directed to lower values.
corresponding to the vertical streak lengths in the bottom-right slice in Fig. 1. The UV modulation contours in the third column show vertical and horizontal asymmetries which indicate nonlinearities. When plotted as intensity, the scatter clouds stretch much higher due to the non-linear Wien response of the Planck function in the ultraviolet; our conversion to brightness temperature circularizes the contours considerably. The non-linear intensity response explains partially why internetwork grains appear as “superimposed” enhancements (Foing & Bonnet 1984, Fig. 6 of Paper III), with the remainder likely to reflect nonlinear shock buildup. The horizontal asymmetry may indicate wave breaking. We have plotted similar scatter sequences for many other selective combinations. High-pass UV against low-pass WL shows only very weak correlation between the occurrence of internetwork grains and dark intergranular lanes, conform the conclusion of Hoekzema et al. (2002) that only a slight (but significant) correlation exists between excessively bright Ca K2V grains and specific large-amplitude acoustic wave sources (“flux events”) in the underlying photosphere. High-pass UV against high-pass WL confirms that the fiveminute oscillation provides initial bright-bright correlation. Network correlations confirm that the persistent upward brightbright correlation in the first column of Fig. 2 is due to magnetic elements. Fourier representations. The (kh , f ) diagrams in Fig. 3 decompose the ultraviolet intensity modulations in both temporal frequency f (vertical) and spatial wavenumber kh (horizontal), using annular averaging over the (k x , ky ) spatial transform domain. They are comparable to Figs. 23 and 24 of Paper III. Since the October 14 data contain almost no network, these Fourier patterns are set by internetwork behavior.
R. J. Rutten and J. M. Krijger: Gravity waves from TRACE
The power spectrum in the upper panel displays acoustic ridges and pseudo-ridges that are discussed in Sect. 4.4 of Paper III; here, we concentrate on the low-frequency domain. The power increases both to low temporal and to low spatial frequency (curves along the panel sides). A large blob of enhanced power marks the gravity-wave domain below the Lamb line. The ∆φ(1700−1600) phase difference spectrum in the lower panel contains a prominent wedge-shaped signature of negative phase propagation over a large kh range below the Lamb line. It extends over kh = 0.5−3.5 arcsec−1 , or Λ = 2−10 arcsec in wavelength, i.e., the meso-scale range between granulation and supergranulation. It has high coherence between 1700 and 1600 Å modulation. Its sign, location, and shape strongly suggest atmospheric gravity waves. Figure 4 plots internetwork phase differences ∆φ(WL − 1700) in the compact format used in Figs. 18–22 of Paper III to diagnose ultraviolet and Ca H phase difference behavior. It demonstrates that the internetwork UV and WL intensities are virtually independent in their temporal Fourier signatures. The coherence (top curve) is nowhere significantly above the random noise value, even in the five-minute band. The phase difference spread is large everywhere. The negative average phase difference at the start is the Fourier counterpart of the anticorrelation in the middle column of Fig. 2. It similarly pertains to only part of the data. Finally, Fig. 5 decomposes the ∆φ(WL−1700) phase differences measured for the whole field in two-dimensional (kh , f ) format. The result is very noisy but has some features of interest. A meso-scale patch of negative phase difference appears for kh = 0.5−2 arcsec−1 and f < 1 mHz, comparable to the corresponding part of the wedge in Fig. 3 but with much larger amplitude due to the much larger difference in sampling height. This meso-scale signal dominates the initial dip of the mean phase difference curve in Fig. 4. The sign and mean value of this patch correspond also to the time-delayed anticorrelation in the second column of Fig. 2, which must therefore be attributed to meso-scale, not granular-scale, brightness reversal. The granular domain itself, around kh = 3 arcsec−1 , shows a patch of small positive phase differences outlined by a C = 0.1 contour which corresponds to the bright-bright network correlation tail in the first column of Fig. 2. The granular-scale patch of negative phase difference in the acoustic three-minute region corresponds to the weak but significant time-delay correlation between intergranular lanes and internetwork grains established by Hoekzema et al. (2002), with about one minute sound travel time between the two sampling heights.
4. Conclusion and discussion Ultraviolet images from the low solar chromosphere show a low-frequency brightness pattern in quiet-sun internetwork regions that constitutes a background and co-localiser to acoustic internetwork grains. Figures 1 and 2 illustrate and quantify that reversed granulation plays a minor role at most in this background. Figures 4 and 5 confirm this result. Another agent dominates at longer, meso-scale wavelengths. Although it contributes most of the anticorrelation in the middle column
739
of Fig. 2, it has only slight correspondence to the underlying photosphere. It is principally characterized by the dark phasedifference wedge in the lower panel of Fig. 3. The negativity of this wedge, its (kh , f ) location, and its Lamb-line delimitation identify the meso-scale agent as atmospheric gravity waves. The large corresponding power and coherence imply that these waves dominate the ultraviolet internetwork background in TRACE images. Why meso-scale? Granular upwellings hitting the overlaying radiative-equilibrium regime are likely to be the major contributer of photospheric gravity-wave emission. However, the slightly larger upwellings in the meso-scale convection regime may produce waves that are less susceptible to radiative pattern smoothing. Also, since the waves spread in slanted directions from their sources and should brighten considerably at their breaking height, wave interference is likely to occur and to cause low-chromosphere modulation at source separation scales without much pattern correspondence to the underlying photosphere. Bound-free scattering in the UV continua may also wash out the smaller scales. Numerical simulation may address these scale and topology issues beyond speculation, and may also elucidate the role of gravity waves in the chromospheric energy balance, basal flux emission, and magnetic canopy interactions. Acknowledgements. We are indebted to T. D. Tarbell for programming and scheduling TRACE for these observations and to T. J. Bogdan, B. Fleck, S. S. Hasan, O. V. Khomenko, R. I. Kostik, N. G. Shchukina, G. Severino, R. F. Stein and Th. Straus for inspiring discussions, some enabled by NATO grant PST.CLG.97501, INTAS grant 00-00084, and the EC–TMR European Solar Magnetometry Network. J. M. Krijger’s research was funded by The Netherlands Organization for Scientific Research (NWO). Both authors thank the Leids Kerkhoven–Bosscha Fonds for frequent travel support.
References Balthasar, H., Grosser, H., Schr¨oter, C., & Wiehr, E. 1990, A&A, 235, 437 Bonet, J. A., Marquez, I., V´azquez, M., & W¨ohl, H. 1991, A&A, 244, 492 Brown, T. M., & Harrison, R. L. 1980, ApJ, 236, L169 Cram, L. E. 1978, A&A, 70, 345 Cram, L. E., & Dam´e, L. 1983, ApJ, 272, 355 Deubner, F. L. 1988, A&A, 204, 301 Deubner, F.-L., & Fleck, B. 1989, A&A, 213, 423 Durrant, C. J., & Nesis, A. 1981, A&A, 95, 221 Espagnet, O., Muller, R., Roudier, T., Mein, N., & Mein, P. 1995, A&AS, 109, 79 Evans, J. W., & Catalano, C. P. 1972, Sol. Phys., 27, 299 Foing, B., & Bonnet, R. M. 1984, A&A, 136, 133 Frazier, E. N. 1968, ApJ, 152, 557 Hanslmeier, A., Kuˇcera, A., Ryb´ak, J., Neunteufel, B., & W¨ohl, H. 2000, A&A, 356, 308 Hoekzema, N. M., Rimmele, T. R., & Rutten, R. J. 2002, A&A, 390, 681 Kneer, F., & von Uexk¨ull, M. 1993, A&A, 274, 584 Komm, R., Mattig, W., & Nesis, A. 1991, A&A, 252, 827 Krijger, J. M., Rutten, R. J., Lites, B. W., et al. 2001, A&A, 379, 1052 (Paper III)
740
R. J. Rutten and J. M. Krijger: Gravity waves from TRACE
Kuˇcera, A., Ryb´ak, J., & W¨ohl, H. 1995, A&A, 298, 917 Lighthill, M. J. 1967, in Aerodynamical Phenomena in Stellar Atmospheres, ed. R. N. Thomas, IAU Symp., 28, 429 Lites, B. W., Rutten, R. J., & Berger, T. E. 1999, ApJ, 517, 1013 Mihalas, B. W., & Toomre, J. 1981, ApJ, 249, 349 Mihalas, B. W., & Toomre, J. 1982, ApJ, 263, 386 Rutten, R. J., de Pontieu, B., & Lites, B. W. 1999, in High Resolution Solar Physics: Theory, Observations, and Techniques, ed. T. R. Rimmele, K. S. Balasubramaniam, & R. R. Radick, Procs. 19th NSO/Sacramento Peak Summer Workshop, ASP Conf. Ser., 183, 383
Schmieder, B. 1976, Sol. Phys., 47, 435 Schmieder, B. 1977, Sol. Phys., 54, 269 Staiger, J. 1987, A&A, 175, 263 Staiger, J., Mattig, W., Schmieder, B., & Deubner, F. L. 1984, Mem. Soc. Astron. It., 55, 147 Stein, R. F. 1967, Sol. Phys., 2, 385 Straus, T., & Bonaccini, D. 1997, A&A, 324, 704 Suemoto, Z., Hiei, E., & Nakagomi, Y. 1987, Sol. Phys., 112, 59 Suemoto, Z., Hiei, E., & Nakagomi, Y. 1990, Sol. Phys., 127, 11 Vernazza, J. E., Avrett, E. H., & Loeser, R. 1976, ApJS, 30, 1 Whitaker, W. A. 1963, ApJ, 137, 914