May 27, 1971 - Messenger Ribonucleic Acid. LOLA MARGULIES ..... RN.Akl-eaue3N. 2m)wsa-. 0. 4 ms. 0. 0 rconnce 9ttb 19.Rcvr a ecnaeo. 40.1. 15. 20. 25.
JOURNAL OF BACTERIOLOGY, Sept. 1971, p. 610-617 Copyright 0 1971 American Society for Microbiology
Vol. 107, No. 3 Printed in U.S.A.
Asymmetric Template Function of Microbial Deoxyribonucleic Acids: Transcription of Messenger Ribonucleic Acid LOLA MARGULIES, VIRGILIJA REMEZA, AND RIVKA RUDNER Department of Biological Sciences, Hunter College of the City University of New York, New York, New York 10021
Received for publication 27 May 1971
In Bacillus subtilis and Escherichia coli, pulse-labeled ribonucleic acid (RNA) synthesized during step-down growth hybridized preferentially with the heavy (H) strand of methylated albumin-Kieselguhr-fractionated deoxyribonucleic acid (DNA). At high RNA inputs, the ratio of RNA hybridized with the H strand to that hybridized with the light (L) strand was 8.7 for B. subtilis and 2.0 for E. coli. At high DNA inputs, the H/L hybridization ratio increased by a factor of two. This change in the hybridization ratio was attributable to the fraction of the pulselabeled RNA which is in stable RNA components. The hybridization peak of pulse-labeled RNA was specifically located in the late-eluting region of the absorbance profile of the H strand. This region was considered to represent the most actively transcribing H strand templates.
We have shown in a previous communication (17) that in Bacillus subtilis, Escherichia coli, and Salmonella typhimurium 16 and 23S ribosomal ribonucleic acid (rRNA) species are transcribed exclusively from the pyrimidine-rich (or cytosine-rich) H strand of deoxyribonucleic acid (DNA). All the soluble RNA (4S) in B. subtilis and approximately 70% of the 45 RNA in E. coli are also transcribed from the H strand of DNA. These findings obtained from hybridization studies were made possible by previous work reported by one of us (22, 24) on the fractionation of denatured DNA of several bacterial species into, reproducibly, two distinct components [designated light (L) and heavy (H)J from columns of methylated albumin-Kieselguhr (MAK). It was concluded on the basis of several criteria (12, 13, 22-24) that the L and H components could be regarded as complementary representatives of the original DNA strands. In view of our observations on the asymmetric transcription of stable cellular components of (RNA) in vivo, it appeared of interest to study by a similar approach the transcription pattern of total messenger RNA (mRNA). The hybridization behavior of mRNA with respect to strand selection was compared in the following two bacterial species: (i) B. subtilis representing a DNA type where the chemical asymmetry between the strands involves both purines and pyrimidines and (ii) E. coli representing a DNA with a lim610
ited chemical asymmetry of only guanine and cytosine (24). Any correlation between the extent of chemical asymmetry and the bias in the transcription pattern may elucidate the type of control that enforces the asymmetry of transcription in the cell. In the present communication, we present evidence that in B. subtilis and E. coli mRNA synthesized after a nutritional shift-down growth is preferentially transcribed on the H strand of DNA. Of the hybridizable mRNA of B. subtilis, almost 90% anneals to the H strand and 10% to the L strand. In E. coli, on the other hand, 70% hybridizes with the H strand and 30% with the L strand. Detailed hybridization tests on the entire MAK elution profile of denatured DNA reveal a bias in the distribution of the most actively transcribing DNA templates. MATERIALS AND METHODS Bacterial strains. The strains of B. subtilis and E. coli have been described previously (17). Labeling nedia. Low-uridine media for B. subtilis and E. coli have been described previously. The concentration of vitamin-free Casamino Acids (Difco) was increased from 0.04 to 0.1 % for the growth of E. coli. No vitamin-free Casamino Acids were added to the medium of B. subtilis. Preparation of 3H-pulse-labeled RNA from shiftdown cultures. B. subtilis A26u- was grown at 37 C with constant shaking in 500 ml of veal infusion broth (Difco) supplemented with 0.5% yeast extract (Difco).
VOL. 107, 1971
ASYMMETRIC TRANSCRIPTION OF RNA
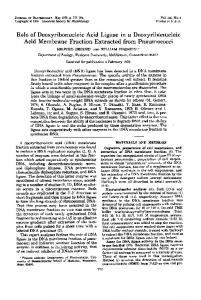
When the culture reached a Klett reading of 185, the cells were collected, washed twice, and suspended in 300 ml of low-uridine medium at a Klett reading of 54. The culture was incubated again at 37 C with constant shaking; at the end of the lag period (ca. 60 min after shift-down), 7 mCi of uridine-5-8H (specific activity, 8.0 Ci/mmole, Schwarz BioResearch) was added for a pulse period of 90 sec. At the end of the pulse, the culture was pured over an equal volume of crushed ice. The cells were washed twice with TM buffer [0.01 M tris(hydroxymethyl)aminomethane-0.005 M MgCl2, pH 7.4], and the pellet was frozen over dry ice-acetone. RNA was extracted by the method of Oishi and Sueoka (21). E. coli strain 3050 ura4 was grown similarly in enriched medium. Washed cells were suspended in 750 ml of low-uridine medium and, at the end of the lag period (ca. 25 min. after shift-down), 10 mCi (and 4.5 mCi in another experiment) of uridine-5-8H (specific activity, 8.0 Ci/mmole) was added for a pulse period of 2 min. RNA from E. coli was extracted by the procedure described previously (17). The integrity of the mRNA preparations was checked by MAK chromatography of I mg of RNA by a procedure described previously (17). The radioactivity of the MAK fractions was determined by assaying the trichloroacetic acid-precipitable RNA in the presence of 100 Ag of bovine serum albumin. A typical heterogenous message fraction was obtained as illustrated in Fig. 1. Unfractionated RNA was stored at -15 C in TM buffer containing 0.005% sodium lauryl sulfate. Just before use, the RNA was diluted and dialyzed against 0.01 x SSC (SSC = 0.15 M NaCI-0.015 M sodium citrate, pH 7.0). Isolation, dematuration, and strand separation of DNA. The isolation of bacterial DNA preparations and their separation, after alkali denaturation, into L and H components were previously described in detail (22, 24, 25). For some experiments, further purification of the L components was carried out as follows. (i) The L component of B. subtilis DNA was subjected to rechromatography on 0.25 MAK as outlined previously (24). (ii) The L component of E. coli was first subjected to self annealing (ca. 15 Mg of DNA/ml in 2x SSC at 68 C for 4 hr) followed by rechromatography on 0.25
611
through a second filter and treated similarly. In B. subtilis, the percentage of hybrids retained on the first filter was 96 to 98 at an RNA/DNA ratio of 30/1 and 86 to 89 at an RNA/DNA ratio of 1/100. In E. coli, the percentage of hybrids retained on the first filter was 85 to 98 at an RNA/DNA ratio of 40/1 and 82 to 100 at an RNA/DNA ratio of 1/100. Filters were counted in Bray's solution (1) by using liquid scintillation spectrometers (Tri-Carb, Packard Instrument Co., Inc., or Nuclear-Chicago Corp.) with a tritium counting efficiency of 35 to 50%. Control tubes containing no DNA were assayed simultaneously and gave a background of 0.03 to 0.13% of the total acid-precipitable radioactive RNA input.
RESULTS Hybridizability of L and H strands of B. subtilis DNA with pulse-labeled RNA: general characteristics. The in vivo template function of L and H DNA strands was investigated by examining their hybridization capacity to pulse-labeled RNA. In order to efficiently assess the transcription pattern of the genome with respect to strand selection, it is desirable to increase the proportion of mRNA in the rapidly labeled RNA preparation. Cultures undergoing a "step-down" transition (4, 5, 10) from complete to synthetic medium were pulse-labeled with the hope of enriching the message fraction. RNA was prepared from B. subtilis cells labeled for 90 sec during step-down growth. The MAK chromatographic profile of the pulse-labeled RNA thus obtained was found to be heterogeneous in size, as shown in Fig. 1. The distribution of label between 0.4
E
0' O
(0(D 0.32
8
MAK column.
Hybridization of isolated L and H strandsWith 3Hpulse-labeled RNA. The liquid hybridization technique (20) was employed as modified by Kennell and Kotoulas (15). Two sets of hybridization experiments were performed: (i) at high RNA/DNA inputs (5 to 50) and (ii) at low RNA/DNA inputs (1/10 to 1/100). In addition, competitive hybridization assays were performed at low RNA/DNA inputs (1/75) in the presence of a 50-fold excess of unlabeled rRNA (16 + 23S). Competing rRNA was prepared from cells grown in minimal medium which were treated at the end of growth with actinomycin D (10 gg/ml for 10 min). After incubation in 6x SSC at 67 C (the same temperature optimum was found in hybridization with either the L or the H strand) for 18 hr, the hybrids were diluted with 15 ml of 2x SSC, collected on filters, washed, and treated with ribonuclease as outlined by Gillespie and Spiegelman (6). To check the efficiency of hybrid retention on filters when high concentrations of nucleic acids were used, the filtrate was passed
o
00 F5
(1)
0
0
~~~2
d
10
20
30
40
50
60
70
80
NUMBER FIG. 1. MAK chromatographic profile of 3H-pulselabeled RNA from a Bacillus subtilis step-down culture. Isolated RNA (0.6 mg, specific activity, 2,500 counts per min per Mg) was applied to a 0.50 MAK column and eluted by means of a linear salt gradient of 0.3 to 1.3 M NaCl (total volume, 450 ml). Optical density, solid line; radioactivity, dashed line. The circles indicate each fraction assayed for radioactivity estimated by precipitating 0.5-ml portions with trichloroacetic acid. TUBE
612
MARGULIES, REMEZA, AND RUDNER
rRNA and mRNA species was estimated by hybridization-competition experiments (see below). Since mRNA species are known to vary in abundance (9, 14), the efficiency of hybridization depends greatly upon the relative and absolute amounts of DNA and RNA in the annealing mixture and the method employed for hybrid formation. The annealing reactions were carried out in liquid over a relatively wide range of RNA/DNA inputs. Evidence presented in a previous communication (17) showed that the use of separated complementary strands of DNA completely eliminated any competition from DNADNA reannealing which occurs more readily in liquid. The in vivo transcribing function of the H strand relative to the L strand is defined here as the asymmetry ratio. It is based on the ratio of pulse-labeled RNA hybridized with the H strand to that hybridized with the L strand only at high RNA/DNA inputs. A reasonable estimate of the asymmetry ratio can be achieved only if high RNA/DNA inputs are used so as to avoid any significant hybridization of stable RNA components. On the other hand, the maximum fraction of pulse-labeled RNA that can be detected as hybrid can only be attained at high DNA/RNA inputs. At these ratios, the efficiency of hybridization is high, but the percentage of RNA that forms hybrids reflects not only the labeled mRNA species but also the stable RNA components present in the pulse-labeled preparation. The proportion of pulse-labeled RNA hybridizable to the separated L and H strands of B. subtilis DNA was determined at increasing amounts of 3H-pulse-labeled RNA. As shown in Fig. 2A, at levels approaching saturation (RNA/DNA = 30-40), 84% of the hybridizable pulse-labeled RNA annealed with the H strand and 16% with the L strand. The hybridization behavior of various strand fractionations derived from four separate B. subtilis DNA preparations was compared at the same input ratio of RNA/DNA = 50. As presented in Table 1, the variations in the extent of hybrid formation between the preparations were limited to the H strand. The amount complexed to the L strand was nearly constant between the different preparations. This variation which changed the asymmetry ratio from 8.7 to 5.3 can be attributed in part to deficits in column recoveries of the most actively transcribing H components which elute last during MAK chromatography (see below; 17, 22). Taking these variations into account, we consider the H/L hybridization ratio of 8.7 obtained with DNA preparation I (see Table 1) to reflect most closely the extent of asymmetric transcription that exists in the B. subtilis cell during shift-down growth. Table I further shows that rechromatography of the L strand through
J. BACTERIOL.
MAK did not alter the extent of hybrid formation (compare L and L2 in Table 1, and see Fig. 6). One may conclude that the initial MAK fractionation produced relatively pure L and H fractions with respect to their hybridization properties. The maximum fraction of pulse-labeled RNA that can be detected as hybrid with either the L or H strand was determined by annealing at high DNA/RNA inputs. The results are illustrated in Fig. 2B. At levels approaching saturation (DNA/RNA = 100), 68% of the input RNA formed hybrids, 62.5% annealed to the H strand and 5.8% to the L strand. This value (68% of input RNA) represents a high efficiency of hybridization and compares favorably with published values (5, 8, 14). A comparison of Fig. 2A with 2B illustrates that the H/L hybridization ratio is clearly different under the two annealing conditions. The H/L ratio at high levels of RNA or DNA was 5.3 and 10.9, respectively (Fig. 2A and 2B), and with another DNA preparation (preparation no. 4 in Table 1) it was 6.9 and 13.5. The change in the H/L hybridization ratio was largely due to the fraction of label that is in stable RNA components which, from our previous studies (17), are known to hybridize exclusively to the H strand of B. subtilis DNA. This fraction hybridized to the H strand at extremely low efficiences at low DNX/RNA ratios (1/50) but hybridized progressively more effectively as the input of the H strand increased to a ratio of 100/1. To obtain further information about the distribution of label in the various RNA components, unlabeled rRNA was added to hybridization mixtures to assess the degree of competition for binding sites on the H strand. The competing rRNA (16 and 23S species) was purified from B. subtilis cells which were treated with actinomycin D for 10 min. Table 2 shows that 41% of the hybrids formed between DNA-H and pulse-labeled RNA (DNA/RNA = 75/1) were eliminated in the presence of a 50-fold excess of unlabeled rRNA. As expected, rRNA did not compete for binding sites on the L strand (see Table 2). Furthermore, as shown in Table 2, the H/L hybridization ratio decreased from 21.5 to 10.3 in the presence of the competing rRNA. Thus the step-down RNA preparation contained approximately 40% of the pulse label in rRNA. Since transfer RNA which may contribute 7.5% of the label (assuming that 15% of stable RNA is transfer RNA) must also be included in the estimate of the fraction that is stable RNA, our RNA preparation contained approximately 55% of the pulse label in mRNA. One may therefore conclude that the fraction of stable RNA in the pulse-labeled preparation can account for most of the change in the H/L hybridization ratio
'0 60
E 0
>. /
15
0
H
K
-41
H
40 I
10
a
m z
lx
asymmetry between the strands. The hybridizing capacity of the E. coli strands to mRNA synthesized during a nutritional shift-down growth was similarly investigated under the two saturation conditions. The results of the hybridization ex-
periments performed at high RNA/DNA inputs
B
-9
613
ASYMMETRIC TRANSCRIPTION OF RNA
VOL. 107, 1971
5
20D D
su*u~~u
IL 40
20
60
CA
pg RNA ADDED
120
uu
tuu
20 40 60 D 100 p9 DNA ADDED
FIG. 2. Hybridization of total L and H strands of Bacillus subtilis DNA with 3H-pulse-labeled RNA as a function of RNAIDNA inputs. A, Hybridization at increasing 3H-RNA inputs. Equal volumes of all MAK fractions of L DNA or H DNA were pooled and dialyzed. Each reaction mixture (1.2 ml) contained 3 sg of L or H DNA and the indicated amount of 3H-RNA (specific activity, 2,000 counts per min per Mg). B, Hybridization at increasing DNA inputs. Total L or H strand fractions were concentrated to 280 Mg/iml. Each reaction mixture (0.72 ml) contained I gg of 3H-RNA (specific activity, 2,400 counts per min per Mg) and the indicated amount of DNA.
TABLE 1. Hybridizability oflight (L) and heavy (H) strands of Bacillus subtilis DNA to WH-pulse-labeled RNA DNA prepn
DNA
Counts/min complexed after ribo-
3H-RNA hybridized (%
1,070
n.strands" no. ~~nucleaseb
1 2
Asymmetry ratio H/L H/L,
L H
9,310
0.32 2.82
8.7
L H
1,170 7,076
0.35 2.14
60
L H
1,100 5,850
0.33 1.77
53
L H
650 4,770 4'692
0.50
are shown in Fig. 3A and Table 3. At levels at proaching saturation, 67% of the hybridizable 3Hpulse-labeled RNA annealed to the H strand and TABLE 2. Competition of unlabeled ribosomal RNA with 3H-labeled RNA for hybridization sites on the light (L) and heavy (H) strands of Bacillus subtilis DNA Expt DNA 50 x no. strandsa rRNA0
1
2
Counts/min complexed after nboanucleasec
3H-RNA
hybrdized (%
Hybrdization ratio
(H/L)
65 1,395
3.0 63.4
21 21.5
+
80
+
825
3.6 37.5
10.3
L H
-
L H
a DNA preparation no. 4 (see Table 1) was used in this experiment. The L- and H-strand fractions were concentrated by chromatography on 0.25 MAK column. I Unlabeled rRNA was extracted from actinomycin D-treated cells; 16 and 23S RNA obtained after MAK chromatography. c Reaction mixtures contained, in 2.0 ml: 75 Mg of DNA and I Mg of 9H-RNA (specific activity, 2.200 counts per min per Mg) in the absence and presence of 50 Mg of unlabeled rRNA.
6.0
0
3 4
L,
3.7069 6.9 0.54
a L2 refers to the rechromatographed L-strand fraction (see Fig. 5 for additional information). I The reaction mixtures for DNA preparations I to 3 contained 150 Mg of 3H-RNA (specific activity, 2,200 counts per min per jig) and 3 Mg of DNA in a 1.2-ml volume. For DNA preparation 4, 30 Mg of 3H-RNA (specific activity, 4,300 counts per min per Mg) and I Mg of DNA were used in a 0.4-ml volume.
observed at high DNA/RNA inputs. Hybridization of L and H strands of E. coli DNA with pulse-labeled RNA: general characteristics. The transcription pattern with respect to strand selection was investigated in E. coli representing a DNA type with a limited chemical
W N
15
E
0
406-8 04 20 08 LL
zL 20
40
pq
RNA
ADDED
40 pg
60 D NA
80
100
ADDED
FIG. 3. Hybridization of total L and H strands of Escherichia coli DNA with 3H-pulse-labeled RNA as a function of RNA/DNA inputs. A, Hybridization at increasing 3H-RNA inputs. Each reaction mixture (0.72 ml) contained 2 Mg of DNA and the indicated amount of 3H-RNA (specific activity, 1,000 counts per min per ug). B, Hybridization at increasing DNA inputs. Each reaction mixture (0.72 ml) contained I Mg of 3H-RNA (specific activity, 4,000 counts per min per yg) and the indicated amount of DNA. For additional
details, see legend ofFig. 1.
614
MARGULIES, REMEZA, AND RUDNER
33% to the L strand (Fig. 3A). The extent of variation in the H/L hybridization ratio between various MAK fractionations of two E. coli DNA preparations and two pulse-labeled RNA specimens were very small (compare experiments 1 to 3 in Table 3). At inputs of RNA/DNA = 40, the H/L ratio remained nearly constant at a value of 2.0. It was desirable to ascertain the homogeneity of the L strand since the fraction of label that formed hybrid with L was considerably greater in E. coli than in B. subtilis. Two Lstrand preparations were subjected to self-annealing (in 2x SSC at 68 C for 4 hr) followed by rechromatography on MAK designed to eliminate any contamination of polynucleotide segments derived from the H strand. This additional purification resulted in a relatively small reduction (15 to 18%) in the hybridizing capacity of the L component (see experiments 4 and 5 in Table 3 and Fig. 6). Thus, the H/L hybridization ratio changed only slightly, from 2.0 to 2.4. On the basis of these findings, one may conclude that in E. coli the asymmetry of transcription is not as extensive as in B. subtilis. The contribution of the L transcripts to the various mRNA species synthesized during shift-down growth of E. coli is approximately three times greater than in B. subtilis. Hybridization experiments performed at high TABLE 3. Hybridizability of light (L) and heavy (H) strands of Escherichia coli DNA to 3H-pulse-labeled RNA 3H-RNA
Asymmetry
hybridized
ratio
nuclease5
(%)
H/L H/L2
Expt
DN A
Counts/min complexed
no.
strandsa
after ribo-
I
L H
1,069 2,197
0.82 1.68
2.06
2
L H
1,182 2,089
0.90 1.60
17
L H
499 900 411
0.76 1.38 0.63
1.80
620
0.94 1.96 0.80
2.06
3
L2 4
L H
1,279
1.77 21
21
24
24 L2 524 a L2 refers to rechromatographed L-strand fractiouis. Two different DNA preparations were used: preparation 1 in experiment no. 1 and preparation 2 in experiments 2 to 4.
bReaction mixtures in experiments 1 and 2 contained, in 0.72 ml: 80 ug of 3H-RNA (specific activity, 1,600 counts per min per Mg) and 2 ,ug of DNA. In experiments 3 and 4, 40 ug of 3H-RNA and 1 ,ug of DNA were used in a 0.36-ml volume.
J. BACTERIOL.
DNA/RNA inputs showed, as in B. subtilis. an increase in the H/L hybridization ratio. The results for E. coli are illustrated in Fig. 3B. At levels approaching saturation (DNA/RNA = 100), 57.6% of input RNA formed hybrids, 47.9% with the H strand and 9.7% with the L strand. The H/L ratio for E. coli at high levels of RNA or DNA was 2.0 and 4.9, respectively (compare Fig. 3A and 3B). As in B. subtilis, this change reflects the binding of stable RNA components to the H strand as the DNA/RNA input ratios are increased. Limited competitive hybridizations were carried out in the E. coli system employing unfractionated cold step-down RNA as a competitor. For example, annealing at an input ratio of DNA-H/RNA = 70/1 in the presence of a 10-fold excess of unlabeled step-down RNA resulted in a 30% elimination of the hybrids. Clearly, the results from this competition experiment would yield an underestimate of the fraction of label that is stable RNA since the ratio of competing RNA to 3H-RNA was 10/1 in E. coli as compared to 50/1 in B. subtilis. In summary, in E. coli as in B. subtilis, the increase in the H/L hybridization ratio observed at high DNA/RNA inputs can be attributed largely to the fraction of the pulse-labeled RNA which is stable RNA. Hybridization patterns of individual L and H fractions along the MAK elution proffle with pulse-labeled RNA. In a previous communication (17), we demonstrated that the hybridization peak for rRNA was preferentially located in the late-eluting region of the H strand and that the early-eluting region of the L strand selectively inhibited the hybridization between the peak and rRNA. On the basis of the annealing patterns and because of the high content of the guanylic acid in rRNA, we postulated that along the MAK eluting profile of fragmented L and H strands there exists a gradient in the distribution of cytosine-rich sequences. We were similarly interested in ascertaining whether pulse-labeled RNA anneals preferentially to certain regions of the MAK elution profile of denatured DNA of B. subtilis and E. coli. All the L and H MAK fractions were first normalized to the same DNA concentration and then annealed to 8H-pulse-labeled RNA at an input ratio of RNA/DNA = 5. The hybridization profiles obtained for B. subtilis and E. coli are illustrated in Fig. 4 and 5, respectively. Both annealing patterns revealed a considerable displacement of the hybridization peaks from the absorbance peaks. The shift occurred in the same direction for both the L and the H strands and was more pronounced in E. coli than in B. subtilis (compare Fig. 4 and 5). The degree of displacement in the hybridization
ASYMMETRIC TRANSCRIPTION OF RNA
VOL. 107, 1971
615
sumed to be the richest in cytosine. The displacement in the hybridization peak found for the L fraction is of particular interest L E 20 rz o 0-5 4~~~~~~~~~~~~~~~~~~~~~~~~~~~~~~~~~~~ since it may reflect the rare occurrence of cytotD 2 sine-rich clusters on that strand. It was desirable 0.4 15 >to establish the reproducibility of the shift in the 5 i2 hybridization peak along the L absorbance pro4 m 10 49 file. The hybridization pattern of E. coli L-strand was checked again after a self-anpreparation 6~~~~~ treatment followed by rechromatography nealing 4C I I 71 6 through MAK. The original and the rechromatographed L fractions were adjusted to the same DNA concentration and then annealed at an TU8E NUMBER ratio of RNA/DNA = 10. As shown in input FIG. 4. Hybridization of individual L- and H-strand the initial (L1) and the rechromatoFig. 6, fractions of Bacillus subtilis DNA with 3H-pulse-labeled RNA. Alkali-denatured DNA (1.1 mg) was ap- graphed (L2) annealing profiles revealed essenplied to a 0.25 MAK column and eluted with an inter- tially no gross differences in the shifted position mittent salt gradient between 0.7 and 1.5 M NaCl (total of the hybridization peak. The small peak (L2') volume, 400 ml). The gradient was cut at tube 16 and was considered to represent some contamination reconnected at tube 19. Recovery (as percentage of from the early-eluting H fraction which was not input DNA): total, 88; L, 43.5; H, 44.5. Each reaction removed effectively by the self-annealing treatmixture (I contained 3 DNA and
H
B. subtilis
25
-4
3
o
w
z
0.3
0
0.2
a
0.1
s
20
15
30
25
ml) Mg of 3H-RNA (specific activity, 2,000 counts Mg). E.coli
per
15 Mg of min per
3
06-
ID
n!
30
:
L
14 4
0
a,
202
345 6
ment. The extent of hybrid formation to that L2'
fraction was comparable to the values obtained for the two early fractions (H1 and H2) of the H strand presented in Fig. 5. One may conclude that the observed shift in the hybridization peak along the absorbance profile of the L strand was real and was not due to artifacts produced by impurities from the H strand. The apparent re0o6 Ecoli
ms E
0
064
H
-2
0
0
40.1
15
25
T U BE
C
35
z
NUMBER
of individual L- and H-strand rconnce Hybridization 9ttb 19.Rcvr a ecnaeo Escherichia coli DNA with 3H-pulse-laFIG.
~2 0.2 -5
2ee 2m)wsaRN.Akl-eaue3N 20 40a ct 5.
0
Lt
U)~~~~~~~~~~~ 20 3 4
fractions of
beled RNA. Alkali-denatured DNA (2 mg) was apPlied to 0.50 MAK column and eluted with intermittent salt gradient between 0.6 and 1.5 m NaCl (total a
dolume
an
420
ml).
reconnected
The
tube
gradient
was
cut at
tube 13 and
19.
Recovery (as percentage of DNA): total, 82; L, 40; H, 42. Each reaction mixture (1 contained 3 Mg of DNA and of at
input
ml)
'H-RNA (specific
Ag). Pooled number
peak
on
can
hg
activity, 6,400
fractions
the elution
to
designated
are
by
mn per
the
same
profile.
be calculated
hybridizable
counts per
the
from
the
two extreme
absorbance profile. In the
case
the ratio of H7/H,
3.0
ratio
of RNA
sides of the H
of E. coli
(Fig. 5), compared to a value of 52 calculated previously for the hybridization peak of 23S RNA (17). Despite the diversity of an mRNA fraction, it appears that the bulk of the mRNA species is transcribed from H templates which fractionate in the region prewas
as
4 2040
T UB E
NUMBER
FIG. 6. Effect of rechromatography of the L strand of Escherichia coli DNA on the pattern of hybridization with 'H-pulse-labeled RNA. Top profile represents the initial separation, in which alkali-denatured DNA (2.1 mg) was applied to a 0.25 MAPK column and eluted as described in Fig. 4. The gradient was cut at tube 20 and reconnected at tube 26. Recovery (as percentage of input DNA): total, 66; L,, 37; H,, 29. Bottom profile represents the rechromatography of the L fraction: tubes 21 to 30 (see top profile) were pooled, self-annealed, dialyzed, and applied (10.2 optical density at 260 nm) to a 0.50 MAK column. The gradient was cut at tube 20 and reconnected at tube 24. Recovery (as percentage of input DNA): total, 78; L2, 53; L2', 10. All the hybridization mixtures (0.8 ml) contained 3 ug of DNA and 30 Ug of 3H-pulse-labeled RNA (specific activity, 1,600 counts per min per Mg).
616
MARGULIES, REMEZA, AND RUDNER
semblance between the mRNA and rRNA (17) hybridization profiles to H strands observed both in B. subtilis and E. coli suggests the involvement of certain common sequences. We postulate that the degree of interaction with mRNA along the MAK elution profile of denatured DNA is similarly dictated by the distribution of strand fragments which are increasingly richer in cytosine sequences. DISCUSSION Similar to viral systems, bacteria exhibit a highly suggestive correlation between the distribution of pyrimidine-rich sequences and the transcribing function of the complementary strands of DNA. The studies presented here and the base analyses reported previously (23, 24) indicate that the extent of asymmetric transcription in vivo can be correlated with the degree of bias in the distribution of purines and pyrimidines between the strands. Our investigations as well as an earlier report on B. megaterium (8) show that members of the genus Bacillus represent an extreme example of this correlation. In these organisms mRNA species are transcribed predominantly from the H strands which are considerably richer in cytosine and thymine. E. coli, on the other hand, represents an example where a limited bias in the transcription pattern corresponds to a limited chemical asymmetry between the complementary strands of DNA. Table 4 presents a comparison between the purine/pyrimidine ratio determined in the isolated strands of these bacteria and the H/L asymmetry ratio of transcription in vivo. Although only three bacterial species are presented in Table 4, the correlation between the relatively higher content of pyrimidine in the H strands and the extent of their transcribing function is borne out in the comparison. A remarkable correlation between pyrimidine-rich sequences and transcription has been reported in viral system (see review, 30); especially impressive are cases like T7 and a in which transcription is confined exclusively to the heavy DNA strand of the genome (7, 29, 32). TABLE 4. Comparison between in vivo asymmetry ratio of transcription and the purine/pyrimidine ratio in DNA strands of three bacterial species Bacterial species
Bacillus subtilis B. megateriumb Escherichia coli
..... ..... .....
Molar ratio: Pu/Pya
Asymmetry ratio
Strand L Strand H
(H/L)
1.16 1.12 1.07
0.88 0.89 0.95
8.7 6-9 2.0
a Reported in Rudner et al., 1969 (31). L, light; H, heavy. b Reported in Habich et al., 1966 (8).
J. BACTERIOL.
Studies with bacteriophage A, on the other hand, have shown that transcription in vivo and interaction with guanine-rich ribopolymers are merely preferential (1 1, 32). It is appropriate to mention in this connection that the transcription pattern and the purine/pyrimidine ratio in separated A strands (19) resemble the values obtained for the bacterial host E. coli. A more direct correlation between the number of mRNA species and pyrimidine oligonucleotides of length 11 to 13 ,um was made recently by Mushynski and Spencer (18, 19). The authors noted that in T7 DNA a dozen components in isostichs 12 and 13, found exclusively on the transcribing strand (r), equal the number of mRNA species known to be transcribed off the T7 genome in vivo (28). The length and composition of pyrimidine clusters in bacterial DNA released from each strand by degradation with diphenylamineformic acid (2) are currently being investigated in this laboratory. The analysis of the transcription patterns in viral and bacterial systems and the distribution of pyrimidine clusters determined directly by chemical techniques or by binding with guanine-rich ribopolymers (16) support the specific proposal (31) that pyrimidine runs comprise the promotor sites in the DNA. Although these studies are consistent with this proposal, further experimental refinements are required to prove it. The common occurrence of pyrimidine clusters in DNA from a variety of sources (16) suggests that these sequences may serve as a general signal for the initiation of transcription, whereas other as yet unspecified sequences would perhaps allow one recognition site to be distinguished from another. In the studies reported here, the overall transcription pattern of the bacterial genome with respect to strand selection has been assessed. The asymmetry ratio of mRNA populations from randomly growing B. subtilis and E. coli undergoing a step-down transition has been estimated. Over the range of RNA abundancies examined, the bulk of the mRNA mass saturated its gene sites. It is unlikely that the asymmetry ratio would change significantly under conditions (extreme input ratios) which would permit the full titration of all sites on the bacterial genome. To gain further insight into the control mechanisms which enforce the assymmetry of transcription in the cell, it would be more useful to explore bacterial systems undergoing a differential transcription of the genome. During the synchronous growth of bacteria or bacterial morphogenesis (sporulation or germination), one may be able to demonstrate significant fluctuations in the asymmetry ratio of transcription. In earlier studies reported by one of us (26, 27),
VOL. 107, 1971
ASYMMETRIC TRANSCRIPTION OF RNA
rhythmic alternations were observed in the rate of synthesis and the composition of pulse-labeled RNA synthesized at consecutive segments of a synchronous growth cycle of E. coli. Similar periodic changes in the relative transcription activity of individual segments of the E. coli genome were reported by Cutler and Evans (3). Experiments now in progress are designed to inquire whether, during the synchronous growth of bacteria (E. coli and germinating B. subtilis spores), the asymmetry ratio of transcription exhibits periodic fluctuations. ACKNOWLEDGMENTS This investigation was supported by Public Health Service research grant GM 16059-02 from the National Institute of General Medical Sciences, and by grant E-534 from the American Cancer Society.
1.
2. 3.
4. 5. 6. 7.
8.
9.
10.
11.
12.
13.
14.
LITERATURE CITED Bray, G. A. 1960. A simple efficient liquid scintillator for counting aqueous solutions in a liquid scintillation counter. Anal. Biochem. 1:279-285. Burton, K., and G. B. Petersen. 1960. The frequencies of certain sequences in nucleotides in deoxyribonucleic acid. Biochem. J. 75:17-27. Cutler, R. G., and J. E. Evans. 1967. Relative transcription activity of different segments of the genome throughout the cell division cycle of Escherichia coli. The mapping of ribosomal and transfer RNA and the determination of the direction of replication. J. Mol. Biol. 26.'9-105. Doi, R. H., and R. T. Igarashi. 1964. Genetic transcription during morphogenesis. Proc. Nat. Acad. Sci. U.S.A. 52: 755-762. Edlin, G., and P. Broda. 1968. Physiology and genetics of the "ribonucleic acid control" locus in Escherichia coli. Bacteriol. Rev. 32:206-226. Gillespie, D., and S. Spiegelman. 1965. A quantitative assay for DNA-RNA hybrids with DNA immobilized on a membrane. J. Mol. Biol. 12:829-842. Guiduschek, E. P., G. P. Tocchini-Valentini, and M. T. Sarnat. 1964. Asymmetric synthesis of RNA in vitro: dependence on DNA continuity and conformation. Proc. Nat. Acad. Sci. U.S.A. 52:486-493. Habich, A., C. Weissmann, M. Libonati, and R. C. Warner. 1966. Isolation of a fraction of Bacillus megaterium DNA enriched in "minus" sequences. J. Mol. Biol. 21:255-264. Hansen, J. N., G. Spiegelman, and H. 0. Halvorson. 1970. Bacterial spore outgrowth: its regulation. Science 168: 1291-1297. Hayashi, M., and S. Spiegelman. 1961. The selective synthesis of informational RNA in bacteria. Proc. Nat. Acad. Sci. U.S.A. 47:1564-1580. Hradecna, Z., and W. Szybalski. 1967. Fractionation of the complementary strands of coliphage X DNA based on the asymmetric distribution of poly I, G-binding sites. Virology 32:633-643. Karkas, J. D., R. Rudner, and E. Chargaff. 1968. Separation of B. subtilis DNA into complementary strands. II. Template functions and composition as determined by transcription with RNA polymerase. Proc. Nat. Acad. Sci. U.S.A. 60.915-920. Karkas, J. D., R. Rudner, and E. Chargaff. 1970. Template properties of complementary fractions of denatured microbial deoxyribonucleic acids. 1970. Proc. Nat. Acad. Sci. U.S.A. 65:1049-1056. Kennell, D. 1968. Titration of the gene sites on DNA by
617
DNA-RNA hybridization. II. The Escherichia coli chroJ. Mol. Biol. 34:85-103. 15. Kennell, D., and A. Kotoulas. 1968. Titration of the gene sites on DNA by DNA-RNA hybridization. J. Mol. Biol. 34:71-84. 16. Kubinski, H., Z. Opara-Kubinska, and W. Szybalski. 1966. Patterns of interaction between polyribonucleotides and individual DNA strands derived from several vertebrates, bacteria and bacteriophage. J. Mol. Biol. 20:313-329. 17. Margulies, L., V. Remeza, and R. Rudner, 1970. Asymmetric template function of microbial deoxyribonucleic acids: transcription of ribosomal and soluble ribonucleic acids. J. Bacteriol. 103:560-568. 18. Mushynski, W. E., and J. H. Spencer. 1970. Nucleotide clusters in deoxyribonucleic acids V. The pyrimidine oligonucleotides of strands r and I of bacteriophage T7 DNA. J. Mol. Biol. 52.:91-106. 19. Mushynski, W. E., and J. H. Spencer. 1970. Nucleotide clusters in deoxyribonucleic acids. VI. The pyrimidine oligonucleotides of strands r and I of bacteriophage lambda DNA. J. Mol. Biol. 52:107-120. 20. Nygaard, A. P., and B. D. Hall. 1963. A method for the detection of RNA-DNA complexes. Biochem. Biophys. Res. Commun. 12.98-104. 21. Oishi, M., and N. Sueoka. 1965. Location of genetic loci of ribosomal RNA on Bacillus subtilis chromosome. Proc. Nat. Acad. Sci. U.S.A. 54:483-491. 22. Rudner, R., J. D. Karkas, and E. Chargaff. 1968. Separation of B. subtilis DNA into complementary strands. 1. Biological properties. Proc. Nat. Acad. Sci. U.S.A. 60: 630-635. 23. Rudner, R., J. D. Karkas, and E. Chargaff. 1968. Separation of B. subtilis DNA into complementary strands. III. Direct analysis. Proc. Nat. Acad. Sci. U.S.A. 60:921922. 24. Rudner, R., J. D. Karkas, and E. Chargaff. 1969. Separation of microbial deoxyribonucleic acids into complementary strands. Proc. Nat. Acad. Sci. U.S.A. 63:152159. 25. Rudner, R., H. J. Lin, S. E. M. Hoffman, and E. Chargaff. 1967. Studies on the loss and the restoration of the transforming activity of the deoxyribonucleic acid of Bacillus subtilis. Biochim. Biophys. Acta 149:199-219. 26. Rudner, R., B. Prokop-Schneider, and E. Chargaff. 1964. Rhythmic alternations in the rate of synthesis and the composition of rapidly labeled ribonucleic acid during the synchronous growth of bacteria. Nature (London) 203:479-483. 27. Rudner, R., E. Rejman, and E. Chargaff. 1965. Genetic implications of periodic pulsations of the rate of synthesis and the composition of rapidly labeled bacterial RNA. Proc. Nat. Acad. Sci. U.S.A. 54:.904-91 1. 28. Summers, W. C. 1969. The process of infection with coliphage T,. I. Characterization of T7 RNA by polyacrylamide gel electrophoretic analysis. Virology 39:175-182. 29. Summers, W. C., and W. Szybalski. 1968. Totally asymmetric transcription of coliphage T, in vivo: correlation with poly G binding sites. Virology 34:.9-16. 30. Szybalski, W., K. Bovre, M. Fiandt, A. Guha, Z. Hradecna, S. Kumar, H. A. Lozeron, Sr.. V. M. Maher, H. J. J. Nijkamp, W. C. Summers, and K. Taylor. 1969. Transcriptional controls in developing bacteriophages. J. Cell. Physiol. 74:Suppl. 1, 33-70. 31. Szybalski, W., H. Kubinski, and P. Sheldrick. 1966. Pyrimidine clusters on the transcribing strand of DNA and their possible role in the initiation of RNA synthesis. Cold Spring Harbor Symp. Quant. Biol. 31:123-127. 32. Taylor, K., Z. Hradecna, and W. Szybalski. 1967. Asymmetric distribution of the transcribing regions on the complementary strands of coliphage X DNA. Proc. Nat. mosome.
Acad. Sci. U.S.A. 57:1618-1625.