Mol Neurobiol DOI 10.1007/s12035-017-0583-6
Atg7-Mediated Autophagy Is Involved in the Neural Crest Cell Generation in Chick Embryo Guang Wang 1,2 & En-ni Chen 1 & Chang Liang 1 & Jianxin Liang 1,2 & Lin-rui Gao 1 & Manli Chuai 3 & Andrea Münsterberg 4 & Yongping Bao 5 & Liu Cao 6 & Xuesong Yang 1
Received: 13 February 2017 / Accepted: 27 April 2017 # Springer Science+Business Media New York 2017
Abstract Autophagy plays a very important role in numerous physiological and pathological events. However, it still remains unclear whether Atg7-induced autophagy is involved in the regulation of neural crest cell production. In this study, we found the co-location of Atg7 and Pax7+ neural crest cells in early chick embryo development. Upregulation of Atg7 with unilateral transfection of full-length Atg7 increased Pax7+ and HNK-1+ cephalic and trunk neural crest cell numbers compared to either Control-GFP transfection or opposite neural tubes, suggesting that Atg7 over-expression in neural tubes could enhance the production of neural crest cells. BMP4 in situ hybridization and p-Smad1/5/8 immunofluorescent staining demonstrated that upregulation of Atg7 in neural tubes suppressed the BMP4/Smad signaling, which is considered to promote the delamination of neural crest cells. Interestingly, upregulation of Atg7 in neural tubes could significantly accelerate cell progression into the S phase, implying that Atg7 modulates cell cycle progression. However, βcatenin expression was not significantly altered. Finally, we
demonstrated that upregulation of the Atg7 gene could activate autophagy as did Atg8. We have also observed that similar phenotypes, such as more HNK-1+ neural crest cells in the unilateral Atg8 transfection side of neural tubes, and the transfection with full-length Atg8-GFP certainly promote the numbers of BrdU+ neural crest cells in comparison to the GFP control. Taken together, we reveal that Atg7-induced autophagy is involved in regulating the production of neural crest cells in early chick embryos through the modification of the cell cycle. Keywords Neural crest . Atg7 . Autophagy . Cell cycle
Introduction Autophagy is a highly coordinated cellular program through lysosomal degradation of the cytosolic components that play crucial roles during early embryonic development and in
Guang Wang, En-ni Chen, and Chang Liang contribute to the work equally. Electronic supplementary material The online version of this article (doi:10.1007/s12035-017-0583-6) contains supplementary material, which is available to authorized users. * Liu Cao
[email protected] * Xuesong Yang
[email protected]
3
Division of Cell and Developmental Biology, University of Dundee, Dundee DD1 5EH, UK
4
School of Biological Sciences, University of East Anglia, Norwich NR4 7TJ, UK
1
Division of Histology & Embryology, Key Laboratory for Regenerative Medicine of the Ministry of Education, Medical College, Jinan University, Guangzhou 510632, China
5
Norwich Medical School, University of East Anglia, Norwich, Norfolk NR4 7UQ, UK
2
Chinese Medicine College, Jinan University, Guangzhou 510632, China
6
Key Laboratory of Medical Cell Biology, China Medical University, Shenyang 110001, China
Mol Neurobiol
maintaining adult cell homeostasis [1]. In other words, autophagy functions as a housekeeper which prevents harmful protein accumulation within cells through removing dead or damaged organelles [1]. It is also a catabolic process by which the energy from lysosomal degradation of cell components is supplied to embryonic development or adult cells in response to any nutrition stress [2–4]. The autophagy process begins when portions of cytoplasm are surrounded by the membrane, and ends when the contents are degraded by lysosomes through autophagy membrane traffic and ultimately funneled into autophagosomes and lysosomes [4]. Autophagosomes appear during the early stages of autophagy, and are then fused with lysosomes and endocytic components. After degradation, the metabolic products can be recycled to the cytoplasm as cellular building blocks [5]. Rapid autophagy is generally motivated by starvation stress, which activates AMPK and inactivates the mTOR complex 1 (mTORC1) pathway [6]. The convergent AMPK and mTORC1 pathways phosphorylate ULK1/2, the key components of autophagy regulatory complex including autophagy-related gene 13 (Atg13), Atg10, and Rb1CC1, which will ultimately promote the formation of autophagosomes. Besides, Atg5, Atg7, and Atg8 (LC3) also participate in the autophagy process at different stages [7, 8]. It was reported that Atg5 and Atg7 mutant mice could survive and develop during the embryonic period but die soon after birth [7, 8]. Accumulating evidence indicates that there is a wide range of physiological and pathological roles of autophagy under diverse contexts during developmental and adult stages [5]. Neural crest cells (NCCs) are pluripotent cells, derived from the neural plate border (NPB) of the ectoderm. We might say that they are at the dorsal region of the developing neural tube. According to their origin, NCCs can be divided into four domains, which are cranial, trunk, vagal and sacral, and cardiac neural crest. NCCs undergo extensive processes including induction, delamination, epithelial-mesenchymal transition, migration, and differentiation and eventually give rise to a remarkable range of cells in vertebrates. These cells comprise neurons and glial cells in sensory, sympathetic, and parasympathetic nervous systems in the trunk [9]. Cranial neural crest cells (CNCC) contribute to bone, cartilage, nerve, and connective tissue components of the head including craniofacial skeleton and cerebral ganglion of the sensory nervous system [10, 11]. NCCs are deemed to be so important that they are often considered as the fourth germ layer in addition to ectoderm, endoderm, and mesoderm. The abnormal development of the neural crest could result in numerous congenital malformations, such as neural tube defects (NTDs), atrioventricular septal defect, patent ductus arteriosus, and Waardenburg syndrome [12–14]. Although the signaling pathways that control the migration and differentiation of neural crest cells still remain elusive, BMP and Wnt signaling as well as adhesion molecules are
deemed to be crucial factors that modulate NCC production spatiotemporally [15]. The current hypothesis regarding the function of autophagy during embryo development is that autophagy is involved in cellular autolysis and self-clearance when programmed cell death is accompanied by insufficient availability of engulfment cells [16], or autophagy is required for cavitations of solid embryonic structure [17, 18]. In this study, we investigated whether or not Atg7-induced autophagy functions on the development of neural crest in early chick embryo through manipulating the levels of Atg7 and Atg8 gene expression at developing neural tubes. As a classical model for studying neural crest development, chick embryos have been widely used to study the effect of various external factors on embryo development and determine the functions of genes during embryogenesis [19, 20], which are also often employed in our recent studies.
Materials and Methods Chick Embryos Fertilized leghorn eggs were acquired from the Avian Farm of South China Agriculture University. The eggs were incubated in a humidified incubator (Yiheng Instruments, Shanghai, China) set at 38 °C and 70% humidity until the embryos reached the desired developmental stage. Gene Transfection The control plasmids pEGFP-C2 and pCMV-Myc were supplied by Prof. Liu Cao [21]. Morpholino Atg7 (Mo-Atg7) was purchased from Gene Tools, LLC, USA (working solution 1 mM). Atg7 (GenBank locus: BC000091) was ligated into the pCMV-My vector (FL-Atg7) [21]. LC3 was ligated into the pEGFP-C2 vector (FL-Atg8-GFP). The plasmid DNAs were prepared and concentrated to 2 μg/μl using a Tiangen DP107-02 kit. The following strategy was designed for transfecting the different constructs into different stages of chick embryos according to experimental requirements. For the in ovo electroporation, plasmid DNAs were microinjected into the lumen of the neural tube of HH10 stage chick embryos. To track the FL-Atg7 and Mo-Atg7 transfection, we cotransfected FL-Atg7, Mo-Atg7, or the control plasmid along with a pEGFP-C2 marker (1:1) in the half-side neural tube of HH10 chick embryos. The electroporation parameters used for achieving maximum transfection efficiency were as previously described [19, 20, 22]. The transfected chick embryos were then incubated at 38 °C with 70% humidity until the embryos reached the HH13 stage. In order to determine how many cells were in the S phase, embryos were exposed to BrdU (Sigma-Aldrich 10 μg/ml) for 2 h in early chick (EC) culture [23]. To analyze neural crest generation, we used the
Mol Neurobiol
portions of neural tubes between the 8th and the 13th pairs of somites (rostral to caudal). Immunohistochemistry Immunohistochemical staining was performed as previously described on whole mount chick embryos to determine Atg7, Pax7, HNK-1, Phospho-Smad1/5/8 (p-Smad1/5/8), BrdU, and β-catenin expression [24, 25]. Briefly, all embryos were fixed in 4% paraformaldehyde at 4 °C overnight and then washed with PBS. The embryos were then blocked with 2% bovine serum albumin (BSA) + 1% Triton-X + 1% Tween 20 in PBS for 2 h at room temperature to prevent unspecific immunoreaction. Following several washes in PBS, the embryos were incubated with primary monoclonal antibody specific for Atg7 (Sigma-Aldrich 1:100), Pax7 (DSHB 1:100), HNK-1 (Sigma-Aldrich 1:200), GFP (Novus Biologicals, 1:1000), p-Smad1/5/8 (Cell Signaling 1:100), LC3B (Cell Signaling 1:100), and β-catenin (Abcam 1:100) overnight at 4 °C on a rocker. After extensive washing, the embryos were incubated with anti-mouse or anti-rabbit Alexa Fluor 555 antibody (2 μg/ml, Invitrogen) overnight at 4 °C on a rocker to reveal the primary antibody staining. Some embryos were pretreated with BrdU (Sigma-Aldrich 10 μg/ml) for 2 h followed by immunohistochemical staining with BrdU antibody (BD Biosciences, 1:200). All embryos were counterstained with DAPI (5 μg/ml, Invitrogen) for 1 h at room temperature. Subsequently, the embryos were sectioned on a cryostat microtome (Leica CM1900). The sections were mounted onto glass slides using Mowiol mounting solution (Sigma-Aldrich) and sealed with coverslips. Western Blotting Western blotting was performed in accordance with a standard procedure using polyclonal antibodies that specifically recognize PCNA, Atg7, LC3B, β-catenin, and β-actin. Protein from the HH10 chick neural tubes, which were cotransfected with FL-Atg7, Mo-Atg7, or the control plasmid along with a pEGFP-C2 marker (N > 15 embryos in each group), was isolated from tissue homogenates or cell lysates using a radioimmunoprecipitation assay (RIPA, Sigma, MO, USA) buffer supplemented with protease and phosphatase inhibitors. The protein concentrations were quantified with the BCA assay. The extracted protein was separated by 10% SDS-PAGE and transferred onto a polyvinylidene difluoride (PVDF) membrane (Millipore, MA, USA). The membrane was blocked with 5% non-fat milk and then was incubated with PCNA (Santa Cruz 1:1000), Atg7 (Sigma-Aldrich 1:1000), β-catenin (Abcam 1:1000), and LC3B (1:1000 Cell Signaling) in TBS buffer at 4 °C overnight. The loading control was β-actin antibody (Cell Signaling 1:3000). After incubation with the secondary antibody, either HRP goat anti-
rabbit IgG (1:3000; EarthOx, 7074S, Millbrae, USA) or HRP goat anti-mouse IgG (1:3000; EarthOx, 7076S, Millbrae, USA), the blots were developed with the SuperSignal™ West Femto Chemiluminescent Substrate (Thermo Fisher, Rockford, USA), Gel Doc™ XR+ System (Bio-Rad, CA, USA). Quantity One (Bio-Rad, CA, USA) software was used to capture the chemiluminescent signals and analyze the data.
Cell Lines and Primary Explant Culture A human neuroblastoma cell line (SH-SY5Y) was obtained from the American Type Culture Collection (ATCC, CLR2266, USA). The cells were cultured in a humidified incubator with 5% CO2 at 37 °C in six-well plates (1 × 10⁶ cells/ml) containing DMEM (Gibco, USA) supplemented with 10% fetal bovine serum (Gibco, Australia). For the gene transfection, the SH-SY5Y cells were transfected with a pEGFP-C2 + pCMV-My vector or pEGFP-C2 + FL-Atg7 assisted by Lipofectamine 3000 (Invitrogen, CA, USA). The prepared plasmid DNA-lipid complexes were added when cells were 50–70% confluent. After 48 h incubation, the cells were immunofluorescent stained for β-catenin (Epitomics 1:100). The neural tubes of chick embryos (at stage HH10) transfected with FL-Atg7 were excised from the embryos at somite levels 1–10 and then incubated in DMEM-F12 culture medium (Gibco) at 37 °C and 5% CO2. After 72 h incubation, immunofluorescent staining against Atg7 (Sigma-Aldrich 1:100) was performed on the primary explants. Before harvest, the primary explants were stained using phalloidin Alexa Fluor 555 (1:200, Invitrogen, USA) at room temperature for 2 h to detect F-actin. A minimum of five images were assayed per treatment group.
In Situ Hybridization BMP4 antisense probes were synthesized as previously described [26]. Whole mount in situ hybridization of chick embryos was performed according to a standard in situ hybridization protocol [27]. Briefly, the embryos were fixed with 4% PFA overnight at 4 °C, dehydrated in a graded series of methanol, and stored at −20 °C (overnight). The following day, the embryos were hybridized with BMP4 digoxigenin and then labeled with antisense probe overnight at 65 °C. Following hybridization, the bound RNA probe was visualized by incubation with alkaline phosphatase-conjugated anti-digoxigenin antibodies and the color was developed in BCIP and NBT (Roche). The whole mount-stained embryos were photographed and then prepared for cryo-sectioning to a thickness of 15–20 μm on a cryostat microtome (Leica CM1900).
Mol Neurobiol
Transmission Electron Microscopy The control plasmid and the FL-Atg7- and FL-Atg8-GFPtransfected chick embryos were fixed with 2.5% Glutaral in 0.1 M PBS for 2 h, and then the neural tubes were dissected. The samples were sent to the TEM Laboratory of Sun Yat-sen University. For embedding, ultrathin sectioning and staining were performed by professional technicians in TEM Laboratory of Sun Yat-sen University and examined using a Tecnai G 2 Spirit TWIN (FEI, USA). The observation of autophagosomes using TEM was according to the guidelines for monitoring autophagy [8]. Photography After in situ hybridization or immunohistochemical staining, the whole mount embryos were photographed using a fluorescence stereomicroscope (Olympus MVX10) and imaging software (Image-Pro Plus 7.0). Sections of the stained embryos were photographed using an epi-fluorescent microscope (Olympus IX51, Leica DM4000 B) at ×200 or ×400 magnification using the Olympus software package (Leica CW4000 FISH). Image Acquisition and Analysis For the quantification in the BrdU experiments, we manually counted BrdU+ GFP+ cells versus BrdU+ cells of the neural tube in the transfected side and as previously described [28]; the HNK-1+ area was quantified with Image-Pro Plus 6.0. For the primary explant culture experiments, cell migration was quantified by measuring the HNK-1+ staining with Image-Pro Plus 6.0; Pax7+ cells were manually counted at the DAPI and Pax7+ merged images. The data were presented as mean ± SE. Statistical analysis for the experimental data was performed using an SPSS 13.0 statistical package program for Windows. Statistical significance was established using one-way analysis of variance (ANOVA). p < 0.05 was considered to be significantly different.
Results Atg7 Is Expressed on the Neural Crest Cells Whole mount immunofluorescent staining against Atg7 and Pax7 was performed in HH13 chick embryos to determine their expression patterns (Fig. 1 (A–F)). Atg7 is strongly expressed in the ectoderm and weakly expressed in the neural crest (as indicated by arrows) at cranial and trunk levels (Fig. 1 (A-A1, DD1)). Meanwhile, Pax7, which is a neural crest cell marker [29], is clearly expressed in the dorsal neural tube and neural crest as indicated by arrows (Fig. 1 (B-B1, E-E1)). Merged images show that both Atg7 and Pax7 are expressed in neural crest cells as
indicated by arrows (Fig. 1 (C-C1, F-F1)). This suggests that Atg7 might have roles in neural crest generation. Over-Expressing Atg7 Increased the Production of Neural Crest Cells in Early Chick Embryos In order to investigate the correlation between Atg7 and neural crest production, we upregulated Atg7 expression at unilateral developing neural tubes of HH10 chick embryos by transfection of FL-Atg7. After transfection, Atg7 expression was determined by Atg7 immunofluorescent staining. The results showed that FL-Atg7 transfection enhanced the Atg7 expression in the neural tube (Supplementary Fig. 1). To easily observe the transfected side of the neural tube, we mixed the pEGFP-C2 with control plasmid or FL-Atg7 or Mo-Atg7. Using a similar strategy, we upregulated or downregulated Atg7 expression at unilateral developing neural tubes of HH10 chick embryos by transfection of Control-GFP (Fig. 2a), full-length Atg7 + GFP (FL-Atg7 + GFP) (Fig. 2d), or morpholino Atg7 + GFP (Mo-Atg7 + GFP) (Fig. 2g). The results showed that Control-GFP transfection in the transfected side of the neural tube did not affect Atg7 expression, which could be clearly observed in the individual cells indicated by arrows in lower-right high-magnification images (Fig. 2b, c); FL-Atg7 + GFP transfection enhanced the Atg7 expression in both neural tube and neural crest cells indicated by arrows (Fig. 2e, f). Since Atg7 is strongly expressed at the ectoderm of embryos, we found that Mo-Atg7 + GFP downregulated Atg7 expression at the ectoderm compared with the nontransfected side (arrow indications, Fig. 2h, i). Additionally, western blotting also gave the same results regarding Atg7 expression as immunofluorescent staining at protein level following the manipulations of the Atg7 gene level in neural tubes (Atg7/β-actin: Control-GFP = 0.77 ± 0.01, FL-Atg7 + GFP = 1.01 ± 0.05, Mo-Atg7 + GFP = 0.6 ± 0.04, p < 0.05, N = 3; Fig. 2j). All of these data indicate the successful manipulation of Atg7 expression in early chick embryo development. Immunofluorescent staining against either Pax7 (marker of pre-migratory and migratory neural crest cells) or HNK-1 (marker of migratory neural crest cells) was performed to detect neural crest production after upregulating Atg7 expression at unilateral neural tubes, while leaving the opposite side as control (Fig. 3 (A, F, G)). The transverse sections at the level indicated by the dotted line in Fig. 3 (A) showed that GFP transfection did not affect the neural crest production (Fig. 3 (B–C)), but Fl-Atg7 + GFP transfection dramatically increased the number of neural crest cells in the transfected side as indicated by arrows compared to the opposite control side (ratio of Pax7+ cells between transfection side/control side: Control-GFP = 1.04 ± 0.05, FLAtg7 + GFP = 1.65 ± 0.07, p < 0.001, N = 8; Fig. 3 (D, E, L)), and this can be seen more clearly in high magnification (Fig. 3 (D1, E1)). Similarly, we also demonstrated that there was no significant difference in HNK-1+ migratory neural crest cell number between the GFP-transfected side and the opposite
Mol Neurobiol
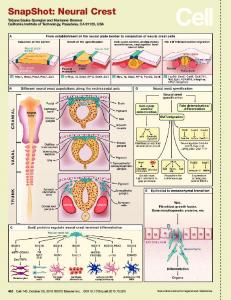
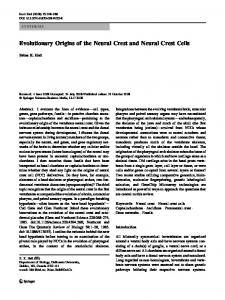
Fig. 1 The expression patterns of Atg7 and Pax7 in neurula stage chick embryos. Whole mount immunofluorescent staining against Atg7 (red) and Pax7 (green) was performed in HH13 chick embryos. A–C Representative images of Atg7 (A), Pax7 staining (B), and merge (C) at the cranial region of the chick embryos. A1–C1 The transverse sections were taken at the levels indicated by dotted lines in A–C, respectively. Note that DAPI stains in C1 and lower-magnification image inset shows
the localization of C1. D–F Representative images of Atg7 (D), Pax7 staining (E), and merge (F) at the posterior trunk of the chick embryos. D1–F1 The transverse sections were taken at the levels indicated by dotted lines in D–F, respectively. Note that DAPI stains in F1 and lower-magnification image inset shows the localization of F1. Scale bars = 100 μm in A–C, 50 μm in A1–C1, 100 μm in D–F, and 20 μm in D1–F1 (color figure online)
control side (Fig. 3 (H, I)), but the HNK-1+ migratory neural crest cell number in the FL-Atg7 + GFP-transfected side at trunk level was significantly greater than in the opposite control side (ratio of HNK-1+ area between transfection side/control side: Control-GFP = 1.07 ± 0.06, FL-Atg7 + GFP = 2.10 ± 0.10, p < 0.001, N = 6; Fig. 3 (J, K1, M)). Similarly, we found that upregulation of Atg7 also increased the HNK-1+ migratory neural crest cell number, at cranial and cardiac levels (cranial: Control-GFP = (22.72 ± 0.53) × 10 3 μm 2, FL-Atg7 + GFP = (44.55 ± 0.80) × 10 3 μm 2 ; cardiac: ControlGFP = (15.33 ± 0.68) × 103 μm2, FL-Atg7 + GFP = (45.56 ± 1.81) × 103 μm 2 , p < 0.001, N = 6; Supplementary Fig. 2). The cultured neural tube explants were checked for F-actin in migratory cells. The immunofluorescence of Atg7 indicated the cells which were transfected with FL-Atg7 (Supplementary Fig. 3A–E, green arrow), with respect to untransfected cells as the control cells (Supplementary Fig. 3A–E, yellow arrow). The results showed that the elongation of cells transfected with FL-Atg7 (Supplementary Fig. 3A– E, white arrows) was significantly greater than in untransfected (control) cells (long axis/short: control = 2.60 ± 0.32, N = 14, FLAtg7 = 5.28 ± 0.47, N = 12, p < 0.001; Supplementary Fig. 3A– E). More cell protrusions occurred in the majority of cells
transfected with FL-Atg7 compared with those in untransfected cells (control = 4.19 ± 0.22, N = 26, FL-Atg7 = 5.31 ± 0.48, N = 26, p < 0.05; Supplementary Fig. 3A–D and F). Intriguingly, the downregulation of Atg7 through transfection of morpholino Atg7 + GFP (Mo-Atg7 + GFP) in the unilateral neural tube did not affect either Pax7+ or HNK-1+ neural crest cell production (Pax7+ cell number: Control-GFP = 13.38 ± 0.50, Mo-Atg7 + GFP = 13.13 ± 0.95; HNK-1 + cell areas: ControlGFP = (9.34 ± 0.81) × 103 μm2, Mo-Atg7 + GFP = (9.87 ± 0.73) × 10 3 μm 2 ; p > 0.05, N = 6; Supplementary Fig. 4). All of these data suggest that upregulation of Atg7 could significantly increase the production of neural crest cells. Over-expressing Atg7 Suppressed BMP4/Smad Signaling in Dorsal Neural Tube of Early Chick Embryos To study whether or not BMP4/Smad signaling [30] is involved in the Atg7 alteration-induced increase in neural crest cell production, we determined the expressions of BMP4 and p-Smad1/5/8 using in situ hybridization and immunofluorescent staining (Fig. 4). The transverse sections of neural tubes of BMP4 in situ hybridization
Mol Neurobiol
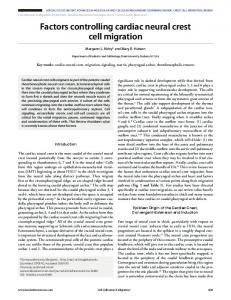
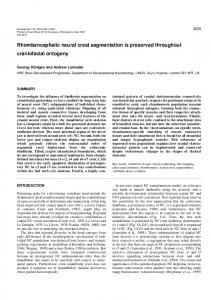
Fig. 2 Atg7 gene was over-expressed or downregulated at the unilaterals of neural tubes of chick embryos. Control-GFP, full-length Atg7-GFP (FL-Atg7 + GFP), or morpholino Atg7 + GFP (Mo-Atg7 + GFP) was transfected into the left side of HH10 chick neural tubes, and then the transfected embryos were further incubated for 10 h before performing Atg7 immunofluorescent staining. a–c The representative transverse sections of GFP (a), Atg7 staining (b), and merge (c) were taken at the trunk level of Control-GFP-transfected chick embryo group. d–f The representative transverse sections of FL-Atg7 + GFP (d), Atg7 staining (e), and merge (f) were taken at the trunk level of the FL-Atg7 + GFP-
transfected chick embryo group. g–i The representative transverse sections of Mo-Atg7 + GFP (g), Atg7 staining (h), and merge (i) were taken at the trunk level of the Mo-Atg7 + GFP-transfected chick embryo group. Note that the high-magnification image insets in a–i were from the transfected sites in a–i, respectively. j Western blot shows the expression of Atg7 at protein level from the neural tubes of control, FL-Atg7, and Mo-Atg7 transfection groups; the bar chart showing the comparison of Atg7 relative expressions (Atg7/β-actin) among control, FL-Atg7, and Mo-Atg7 transfection groups. Scale bar = 50 μm in a–i
showed that BMP4 was expressed in the dorsal neural tube (Fig. 4b, c), and GFP transfection did not interfere with BMP4 expression since the BMP4 expression was kept balanced (indicated by arrows) following GFP transfection at the unilateral neural tube (N = 6/6 embryos, Fig. 4a–c). However, the BMP4 expression disappeared at the dorsal neural tube of the transfection side (indicated by arrows) after the transfection of FL-Atg7 + GFP (N = 5/6 embryos, Fig. 4d–f). Meanwhile, the transverse sections of the neural tube of p-Smad1/5/8 immunofluorescent staining showed that p-Smad1/5/8 was also expressed in the dorsal neural tube, and its expression was not affected by GFP transfection (N = 4/4 embryos, Fig. 4g–i), but downregulated by FL-Atg7 + GFP transfection at the transfection side (N = 6/8 embryos, Fig. 4j– l). We could see the disappearance of p-Smad1/5/8 expression in individual cells by comparing the highmagnification images (Fig. 4i, l). These data indicate that upregulation of Atg7 could regress the BMP4/Smad signaling at the dorsal neural tube of chick embryos.
Over-expressing Atg7 Modulates Cell Cycle Progression in Dorsal Neural Tube of Early Chick Embryos We investigated whether there was any association between Atg7 over-expression and cell cycle, which would help explain why NCC migration was promoted. Therefore, we determined the PCNA expression at the protein level using western blotting, and demonstrated that PCNA expression in FL-Atg7 + GFP-transfected neural tubes was much higher than that in GFPtransfected ones (PCNA/β-actin: ControlGFP = 0.77 ± 0.01, FL-Atg7 + GFP = 0.95 ± 0.01, p < 0.001, N = 3; Fig. 5a). To further confirm the observation, the cell cycle progression in the neural tube was determined using a BrdU incorporation assay after upregulation of Atg7 expression at unilateral neural tubes (Supplementary Fig. 5). There was no significant difference in BrdU+ cell number in neural tubes between the GFP transfection side and the opposite control side (Supplementary Fig. 5A–C), but transfection of FL-
Mol Neurobiol
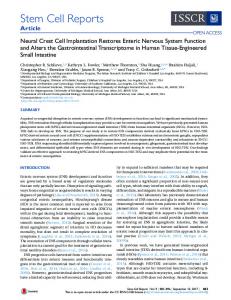
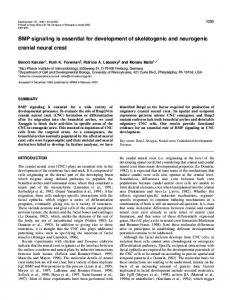
Fig. 3 Over-expressing Atg7 at neural tubes increased the Pax7 and HNK-1-positive neural crest cells. A Half side of HH10 chick neural tubes was transfected with either Control-GFP or FL-Atg7 + GFP, and then the transfected embryos were further incubated for 10 h before performing Pax7 immunofluorescent staining. B, C The representative transverse sections of Pax7 staining (B) and merge (C) of B; GFP transfection and DAPI were taken at the level indicated in A from the Control-GFP-transfected chick embryo group. D, E The representative transverse sections of Pax7 staining (D) and merge (E) of D and DAPI were taken at trunk level from the FL-Atg7 + GFP-transfected chick embryo group. D1, E1 The high-magnification images were taken from the sites indicated by dotted squares in D and E, respectively. F, G The half side of HH10 chick neural tubes was transfected with either Control GFP or FL-Atg7 + GFP, and then the transfected embryos were further
incubated for 10 h before performing HNK-1 immunofluorescent staining. H, I The representative transverse sections of HNK-1 staining (H) and merge (I) of H and GFP transfection were taken at the level indicated in F from the Control-GFP-transfected chick embryo group. J, K The representative transverse sections of HNK-1 staining (J) and merge (K) of J and FL-Atg7 + GFP transfection were taken at the level indicated in G from the FL-Atg7 + GFP-transfected chick embryo group. J1, K1 The high-magnification images were taken from the sites indicated by dotted squares in J and K respectively. L, M The bar charts show the ratios of Pax7+ (L) or HNK-1+ (M) neural crest cells and total neural crest cell numbers from control and FL-Atg7 transfection groups. Scale bars = 200 μm in A, 50 μm in B–E and H–K, 20 μm in D1, E1 and J1, K1, 200 μm in F, G
Atg7 + GFP caused the sharp increase in BrdU+ cell number at the transfected side of the neural tube compared to the control side (Control-GFP = 1.01 ± 0.02, Mo-Atg7 + GFP = 1.29 ± 0.03, p < 0.001, N = 14;
Supplementary Fig. 5D–F and J). These data clearly indicate that upregulation of Atg7 expression modulates cell cycle progression in neural tubes of developing chick embryos.
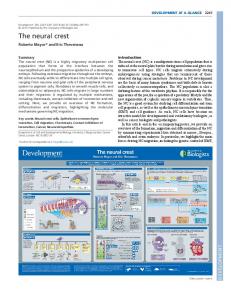
Mol Neurobiol Fig. 4 Over-expressing Atg7 suppressed the expressions of BMP4 and p-Smad1/5/8 at neural tubes. The half side of HH10 chick neural tubes was transfected with either Control GFP or FLAtg7 + GFP, and then the transfected embryos were further incubated for 10 h before BMP4 in situ hybridization (a–f) or pSmad1/5/8 immunofluorescent staining (g–l) was implemented. a–c The representative transverse sections of GFP transfection (a), BMP4 in situ (b), and merge (c) of a and b from the Control-GFPtransfected chick embryo group. d–f The representative transverse sections of FL-Atg7 + GFP transfection (d), BMP4 in situ (e), and merge (f) of d and e from the FL-Atg7 + GFP-transfected chick embryo group. g–i The representative transverse sections of GFP transfection (g), p-Smad1/ 5/8 staining (h), and merge (i) of g and h from the Control-GFPtransfected chick embryo group. j–l The representative transverse sections of FL-Atg7 + GFP transfection (j), p-Smad1/5/8 staining (k), and merge (l) of j and k from the FL-Atg7 + GFPtransfected chick embryo group. Scale bars = 50 μm in a–f, 50 μm in g–l
Over-expressing Atg7 Did Not Affect Wnt Signaling in Dorsal Neural Tube of Early Chick Embryos Wnt/β-catenin is another important signaling which regulates multiple steps of neural crest production, including neural crest induction, lineage decisions, and differentiation [31]. The expression of β-catenin in the neural tube was determined using immunofluorescent staining and western blotting after upregulation of Atg7 expression at unilateral neural tubes (Fig. 5a–o). Western blot data
showed no difference on β-catenin expression between GFP and FL-Atg7 + GFP-transfected neural tubes although Atg7 expression was found to increase in those transfected with FL-Atg7 (β-catenin/β-actin: ControlGFP = 0.84 ± 0.07, FL-Atg7 + GFP = 0.77 ± 0.07, p > 0.05, N = 3; Fig. 5a). After transfection of GFP (N = 4/4 embryos, Fig. 5b) or FL-Atg7 + GFP (N = 6/6 embryos, Fig. 5f), we carefully compared the expression of β-catenin between Control-GFP and FL-Atg7 + GFP from different embryos as well as the transfected side and
Mol Neurobiol
Fig. 5 Over-expressing Atg7 modulates cell cycle progression not through β-catenin expression at neural tubes. a Western blot shows the expression of Atg7, PCNA, β-catenin, and β-actin at protein level from the neural tubes of Control-GFP and FL-Atg7 + GFP transfection groups; the bar chart showing the comparison of PCNA relative expressions (PCNA/β-actin) and β-catenin relative expressions (β-catenin/β-actin) between control and FL-Atg7 + GFP transfection groups. b–i Half side of HH10 chick neural tubes was transfected with either Control GFP or FL-Atg7 + GFP, and then the transfected embryos were further incubated for 10 h before β-catenin immunofluorescent staining was implemented. b–e The representative transverse sections of GFP transfection (b), β-
catenin staining (c), the merge (d) of b and c, the merge (e) of d, and DAPI staining from the Control-GFP transfected chick embryo group. f–i The representative transverse sections of FL-Atg7 + GFP transfection (f), β-catenin staining (g), the merge (h) of f and g, the merge (i) of h, and DAPI staining from the FL-Atg7 + GFP-transfected chick embryo group. j–l The representative images of Control-GFP-transfected cells (j), βcatenin staining (k), and the merge (l) of j and k. m–o The representative images of FL-Atg7 + GFP-transfected cells (m), βcatenin staining (n), and the merge (o) of m and n. Scale bars = 20 μm in b–i and 10 μm in j–o
control side in the same embryo. No change of β-catenin expression was identified in either of them (Fig. 5b–i). Furthermore, SH-SY5Y was employed to detect nuclear and cytoplasmic β-catenin. The results showed no significant changes in nuclear and cytoplasmic β-catenin in Atg7 over-expressed cells compared with the controls (Fig. 5j–o). All of these results suggest that Wnt/βcatenin signaling is not affected by the enhancement of Atg7 expression in developing neural tubes.
Over-expressing Atg8 Similarly Induced Autophagy and Increased the Production of Neural Crest Cells In order to distinguish if the phenotype mentioned above is a result of autophagy or of Atg7 itself, we determined the features of autophagy after upregulating the expression of Atg8, the downstream molecule of Atg7, in unilateral neural tubes of developing chick embryos. FL-Atg8-GFP transfection enhanced the Atg8 expression in the neural tube which was
Mol Neurobiol
determined by Atg8 immunofluorescent staining (Supplementary Fig. 6). Transmission electron microscopy (TEM) showed that the number of autophagosomes in FLAtg7 + GFP- and FL-Atg8-GFP-transfected neural tubes was significantly more than in the GFP-transfected neural tube (Control) (Control-GFP = 0.4 ± 0.16, FL-Atg7 + GFP = 2.1 ± 0.18, FL-Atg8-GFP = 2.8 ± 0.39, p < 0.001, N = 10; Fig. 6 (A–D)). Western blot data showed that the ratio of LC3II to LC3I significantly increased in FL-Atg7 + GFPtransfected neural tubes in comparison to GFP-transfected ones (LC3II/LC3I: Control-GFP = 0.25 ± 0.01, FL-Atg7 + GFP = 0.33 ± 0.01, p < 0.01, N = 3; Fig. 6 (E, F)). All of these data imply that upregulation of either Atg7 or Atg8 could promote the autophagy in neural tubes of developing chick embryos. On this basis, we determined the production of neural crest cells using immunofluorescent staining against HNK-1 and BrdU (Fig. 6 (G, H) and Supplementary Fig. 5G–I). The HNK-1 + neural crest cell number in FL-Atg8-GFPtransfected neural tubes is greater than in the untransfected control side (Control-GFP = (11.43 ± 0.39) × 103 μm2, FLAtg8-GFP = (15.16 ± 0.58) × 103 μm2, p < 0.001, N = 6; Fig. 6 (G–I)). Concurrently, the BrdU+ cell number in FLAtg8-GFP-transfected neural tubes is significantly greater than in Control-GFP-transfected neural tubes (ratio of BrdU+ cells between transfection side and control side: ControlGFP = 0.98 ± 0.02, FL-Atg8-GFP = 1.21 ± 0.06, p < 0.001, N = 8; Supplementary Fig. 5G–I and K). It is suggested that Atg8 upregulation could also promote the production of neural crest cells in a similar manner to Atg7 upregulation.
Discussions We previously reported that exposure to high levels of glucose could inhibit the survival of cranial NCC production via the promotion of cell apoptosis, which might result from the dysregulation of the autophagic process [32]. It has been reported that autophagy is one kind of programmed cell death in which cellular own organelles are digested to supply nutrients [33]. However, we still know very little about the functions of Atg7-induced autophagy during neural crest production. In this study, we found that Atg7 shares its expression pattern to some extent with Pax7, the pre-migratory and migratory neural crest marker of early chick embryos (Fig. 1). The Atg7 gene is deemed to be a vital upstream gene in the autophagic pathway, which is also responsible for the elimination and recycling of damaged macromolecules and organelles in response to various stresses [34]. It is suggested that Atg7sponsored autophagy might participate in neural crest production in some way. In order to confirm this conjecture, we over-expressed or downregulated the Atg7 gene with FL-Atg7 or Mo-Atg7
transfection in unilateral developing neural tubes of chick embryos (Fig. 2). This strategy has been extensively employed for studying the functions of genes on neural crest production [35]. Atg7 downregulation does not affect neural crest production (Supplementary Fig. 4). This is probably due to the low level of endogenous expression. Interestingly, the results clearly demonstrated that upregulation of Atg7 gene expression at the neural tube increased the pre-migratory (Pax7+) and migratory (Pax7+ and HNK-1+) neural crest cell production (Fig. 3, Supplementary Fig. 2). Actin is a primary cytoskeletal component and is involved in the formation of cell filopodia, lamellipodia, and protrusions during cell migration [36]. In Atg7−/− MEFs, the F-actin fibers were disorganized, and the F-actin net was loose and disassembled [37]. In our study, we found that upregulation of Atg7 gene expression promoted the polarization of the cell and this may explain why we found more NCCs after we transfected FL-Atg7. Neural crest cells undergo a transition from epithelial premigratory neural crest progenitors into mesenchymal migratory neural crest cells before engaging in migration [38]. Here, we hypothesize that Atg7-sponsored autophagy somehow triggers neural crest cell delamination from the dorsal neural tube. The transcription factors, Smad1, Smad5, and Smad8, are vital intracellular effectors of BMP family proteins and Smad1/5/8 is involved in the regulation of the induction of the central nervous system primordium, and delamination and differentiation of the neural crest into the peripheral nervous system [39]. As previously reported, our in situ hybridization data also showed that BMP4 was expressed along the longitudinal extent of the dorsal neural tube (Fig. 4b), and the coordination of BMP4 and Noggin in the dorsal neural tube is considered to trigger the delamination of neural crest cells by influencing the expression of Slug, the transcription factor. Here, upregulation of the Atg7 gene via transfection of FLAtg7 at the neural tube could dramatically repress the expression of BMP4 in the FL-Atg7-transfected regions of neural tubes compared to the control (Fig. 4a–f). Meanwhile, pSmad1/5/8 is also homogeneously distributed in dorsal neural tubes as is Atg7 (Fig. 4h). Similarly, over-expression of Atg7 suppressed the expression of p-Smad1/5/8 at the dorsal neural tube (Fig. 4g–l). Therefore, we have to admit that the experimental results were against our previous speculation, in which Atg7 over-expression triggered the delamination of neural crest cells at dorsal neural tubes through activating BMP4 and phosphorylation of Smad1/5/8. Cell proliferation certainly contributes to the production of the neural crest [40, 41]. Here, we revealed that overexpression of FL-Atg7 at neural tubes significantly increased the number of BrdU+ neural crest cells and PCNA expression (Fig. 5a and Supplementary Fig. 5), which raised the possibility as to whether or not the increase in neural crest production by upregulation of Atg7 is associated with the ascending cell cycle. It has been reported that Wnt/TCF signaling regulates
Mol Neurobiol
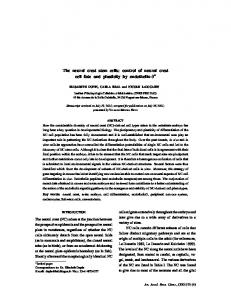
Fig. 6 The over-expression of the Atg8 gene at neural tubes caused the appearance of autophagosomes and increased the generation of neural crest cells. A–C The representative scanning electron microscope images of the neural tubes from Control-GFP (A), FL-Atg7 + GFP (B), and FL-Atg8-GFP (C) transfected chick embryo groups. D The bar chart shows the comparison of autophagosome numbers in every cell among Control-GFP, FL-Atg7 + GFP-transfected, and FL-Atg8-GFP-transfected chick embryo groups. E Western blot shows the expressions of LC3 I and LC3 II at protein level in the neural tubes of Control-GFP and FL-Atg7 + GFP transfection groups. F The bar chart shows the relative expression of
LC3II/LC3I based on the western blot data in Control-GFP and FLAtg7 + GFP transfection groups. G-G1 The half side of HH10 chick neural tubes was transfected with FL-Atg8-GFP (G1), and then the transfected embryos were further incubated for 10 h before HNK-1 (G) immunofluorescent staining was implemented. H-H3 The representative transverse sections at the level indicated by dotted lines in G and G1. I The bar chart shows the comparison of the HNK-1+ area between the FLAtg8-GFP-transfected side and the opposite control side. Abbreviations: N nucleus. Scale bars = 2 μm in A–C, 200 μm in G-G1, and 20 μm in HH3
cell cycle in NCC precursors via Sema3d, the downstream molecule in the molecular pathway. Other researchers have suggested that autophagy negatively regulates Wnt signaling
[42, 43]. However, we did not find a change in the expression of β-catenin, the marker for canonical Wnt signaling, following the gain of function of Atg7 in neural tubes of chick
Mol Neurobiol
embryos (Fig. 5), suggesting that upregulation of Atg7 induced an increase in neural crest production which is not achieved through modifying Wnt signaling and in turn affects neural crest cell proliferation. In a previous study [32], we demonstrated that there were more migratory mesoderm cells in the RAPA-treated sides in comparison to the control sides of embryos. It has also been shown that the primary cilium-mediated autophagy activation, which could lengthen the G1 phase in hESC lineage specification, is necessary for NE differentiation [44] and suggested that autophagy could modulate cell cycle and then regulate NCC generation. Atg8 and Atg12 are considered as crucial downstream molecules in Atg7-induced autophagy. As in our earlier research [45], we also found that over-expression of Atg8 can lead to an increase in autophagosomes as did transfection of FL-Atg7 (Fig. 6 (A–D)), and enhancement of the LC3II/LC3I ratio suggests that upregulation of Atg7 expression could also initiate autophagy at the neural tube (Fig. 6 Fig. 7 A proposed model that depicts the potential mechanisms about the role of Atg7-mediated autophagy on neural crest cell generation
(E, F)). The experimental evidence to support this is also based on an increase in HNK-1+ neural crest cells in the transfected side of Atg8 over-expression (Fig. 6 (G–I)). More interestingly, we likewise established that BrdU+ phase S cell numbers increased at the FL-Atg8-transfected neural tubes (Supplementary Fig. 5) as did Atg7 over-expression. This further indicates the role of autophagy in the regulation of neural crest production. Neural crest generation may be only one part of the events involving Atg7-induced autophagy during neurulation, and this subject will be described in detail in a further publication from our laboratory. In summary (Fig. 7), the co-location of Atg7 and Pax7 in the early chick embryo development suggests that Atg7 may be involved in the regulation of neural crest production. Using the approach of upregulation or downregulation of Atg7 gene expression at the developing neural tube, we found that upregulation could increase the number of neural crest cells. We ruled out the possibility that the over-expression of Atg7
Mol Neurobiol
enhanced neural crest production through inducing delamination of the neural crest by BMP4/Smad signaling because both of their expressions were downregulated rather than upregulated. We also ruled out the possibility of Wnt/β-catenin signaling because of no changes after over-expression of Atg7. The most exciting implication is that over-expression of Atg8 also modulates cell cycle progression in a similar manner to Atg7, suggesting that Atg7-induced autophagy regulates the production of neural crest cells through influencing the cell cycles although further precise experiments are certainly required to address the regulative mechanism of molecular biology. There is no doubt that the more we understand the biological mechanisms relating to the production of neural crest cells the more we can confidently prevent and treat neural crest-associated diseases.
8.
9.
10.
11.
12. 13. 14.
15. Acknowledgements We thank Maurice van den Hoff for the BMP4 plasmid. This study was supported by NSFC grant (81571436, 31401230), Science and Technology Planning Project of Guangdong Province (2016B030229002), Science and Technology Program of Guangzhou (201710010054, 201510010073), Guangdong Natural Science Foundation (2016A030311044), Research Grant of Key Laboratory of Regenerative Medicine, Ministry of Education, Jinan University (Nos. ZSYX-M-00001 and ZSYX-T-00001), Fund for Science and Technology Innovation of Guangdong College Student (pdjh 2017b060) and Students Research Training Program Fund (CX16014, 16112011).
16.
17. 18.
19.
20. Author Contributions G.W., E.C., S.C., C.L., J.L., and L.G. performed the experiments and collected the data; G.W., M.C., A.M., L.C., and X. Y. designed the study and analyzed the data; and Y.B. and X.Y. wrote the manuscript.
21.
22. Compliance with Ethical Standards Competing Interests The authors declare no competing interests. 23.
References 1.
2.
3.
4.
5. 6. 7.
Aburto MR, Sanchez-Calderon H, Hurle JM et al (2012) Early otic development depends on autophagy for apoptotic cell clearance and neural differentiation. Cell Death Dis 3:e394 Qu X, Zou Z, Sun Q et al (2007) Autophagy gene-dependent clearance of apoptotic cells during embryonic development. Cell 128: 931–946 Mellen MA, de la Rosa EJ, Boya P (2008) The autophagic machinery is necessary for removal of cell corpses from the developing retinal neuroepithelium. Cell Death Differ 15:1279–1290 Ravikumar B, Sarkar S, Davies JE et al (2010) Regulation of mammalian autophagy in physiology and pathophysiology. Physiol Rev 90:1383–1435 Gallagher LE, Williamson LE, Chan EY (2016) Advances in autophagy regulatory mechanisms. Cells 5 Russell RC, Yuan HX, Guan KL (2014) Autophagy regulation by nutrient signaling. Cell Res 24:42–57 Kuma A, Hatano M, Matsui M et al (2004) The role of autophagy during the early neonatal starvation period. Nature 432:1032–1036
24.
25.
26.
27.
28.
29.
Komatsu M, Waguri S, Ueno T et al (2005) Impairment of starvation-induced and constitutive autophagy in Atg7-deficient mice. J Cell Biol 169:425–434 Hall BK (2008) The neural crest and neural crest cells: discovery and significance for theories of embryonic organization. J Biosci 33:781–793 Cordero DR, Brugmann S, Chu Y et al (2011) Cranial neural crest cells on the move: their roles in craniofacial development. Am J Med Genet A 155A:270–279 Schneider RA (1999) Neural crest can form cartilages normally derived from mesoderm during development of the avian head skeleton. Dev Biol 208:441–455 Pinsky L (1976) Letter: neural-crest injury and congenital malformations. Lancet 1:637 McCredie J, Cameron J, Shoobridge R (1978) Congenital malformations and the neural crest. Lancet 2:761–763 Gale TF, Kirby ML (1996) Absence of correlation between transient cranial hemorrhages and congenital malformations following neural crest ablation in chicks. Teratology 53:318–325 Basch ML, Bronner-Fraser M (2006) Neural crest inducing signals. Adv Exp Med Biol 589:24–31 Coucouvanis E, Martin GR (1999) BMP signaling plays a role in visceral endoderm differentiation and cavitation in the early mouse embryo. Development 126:535–546 Levine B, Yuan J (2005) Autophagy in cell death: an innocent convict? J Clin Invest 115:2679–2688 Liu Y, Schiff M, Czymmek K et al (2005) Autophagy regulates programmed cell death during the plant innate immune response. Cell 121:567–577 Wang G, Li Y, Wang XYet al (2015) Misexpression of BRE gene in the developing chick neural tube affects neurulation and somitogenesis. Mol Biol Cell 26:978–992 Wang G, Li Y, Wang XYet al (2013) Slit/Robo1 signaling regulates neural tube development by balancing neuroepithelial cell proliferation and differentiation. Exp Cell Res 319:1083–1093 Lee IH, Kawai Y, Fergusson MM et al (2012) Atg7 modulates p53 activity to regulate cell cycle and survival during metabolic stress. Science 336:225–228 Yang X, Dormann D, Munsterberg AE et al (2002) Cell movement patterns during gastrulation in the chick are controlled by positive and negative chemotaxis mediated by FGF4 and FGF8. Dev Cell 3: 425–437 Chapman SC, Collignon J, Schoenwolf GC et al (2001) Improved method for chick whole-embryo culture using a filter paper carrier. Dev Dyn 220:284–289 Yang X, Chrisman H, Weijer CJ (2008) PDGF signalling controls the migration of mesoderm cells during chick gastrulation by regulating N-cadherin expression. Development 135:3521–3530 Yue Q, Wagstaff L, Yang X et al (2008) Wnt3a-mediated chemorepulsion controls movement patterns of cardiac progenitors and requires RhoA function. Development 135:1029–1037 Somi S, Buffing AA, Moorman AF et al (2004) Dynamic patterns of expression of BMP isoforms 2, 4, 5, 6, and 7 during chicken heart development. Anat Rec A Discov Mol Cell Evol Biol 279: 636–651 Henrique D, Adam J, Myat A et al (1995) Expression of a Delta homologue in prospective neurons in the chick. Nature 375:787– 790 Cayuso J, Ulloa F, Cox B et al (2006) The Sonic hedgehog pathway independently controls the patterning, proliferation and survival of neuroepithelial cells by regulating Gli activity. Development 133: 517–528 Lacosta AM, Muniesa P, Ruberte J et al (2005) Novel expression patterns of Pax3/Pax7 in early trunk neural crest and its melanocyte and non-melanocyte lineages in amniote embryos. Pigment Cell Res 18:243–251
Mol Neurobiol 30.
Wu X, Howard MJ (2001) Two signal transduction pathways involved in the catecholaminergic differentiation of avian neural crest-derived cells in vitro. Mol Cell Neurosci 18:394–406 31. Hari L, Miescher I, Shakhova O et al (2012) Temporal control of neural crest lineage generation by Wnt/beta-catenin signaling. Development 139:2107–2117 32. Wang XY, Li S, Wang G et al (2015) High glucose environment inhibits cranial neural crest survival by activating excessive autophagy in the chick embryo. Sci Rep 5:18321 33. Fraker PJ (2005) Roles for cell death in zinc deficiency. J Nutr 135: 359–362 34. Juhasz G, Erdi B, Sass M et al (2007) Atg7-dependent autophagy promotes neuronal health, stress tolerance, and longevity but is dispensable for metamorphosis in Drosophila. Genes Dev 21: 3061–3066 35. Simkin JE, Zhang D, Ighaniyan S et al (2014) Parameters affecting efficiency of in ovo electroporation of the avian neural tube and crest. Dev Dyn 243:1440–1447 36. Lamalice L, Le Boeuf F, Huot J (2007) Endothelial cell migration during angiogenesis. Circ Res 100:782–794 37. Zhuo C, Ji Y, Chen Z et al (2013) Proteomics analysis of autophagy-deficient Atg7−/− MEFs reveals a close relationship between F-actin and autophagy. Biochem Biophys Res Commun 437:482–488
38.
39.
40.
41.
42.
43.
44.
45.
Chalpe AJ, Prasad M, Henke AJ et al (2010) Regulation of cadherin expression in the chicken neural crest by the Wnt/beta-catenin signaling pathway. Cell Adhes Migr 4:431–438 Hegarty SV, O'Keeffe GW, Sullivan AM (2013) BMP-Smad 1/5/8 signalling in the development of the nervous system. Prog Neurobiol 109:28–41 Oyedele OO, Kramer B (2013) Nuanced but significant: how ethanol perturbs avian cranial neural crest cell actin cytoskeleton, migration and proliferation. Alcohol 47:417–426 Carter TC, Kay DM, Browne ML et al (2012) Hirschsprung’s disease and variants in genes that regulate enteric neural crest cell proliferation, migration and differentiation. J Hum Genet 57:485– 493 Gao C, Cao W, Bao L et al (2010) Autophagy negatively regulates Wnt signalling by promoting dishevelled degradation. Nat Cell Biol 12:781–790 Jia Z, Wang J, Wang W et al (2014) Autophagy eliminates cytoplasmic beta-catenin and NICD to promote the cardiac differentiation of P19CL6 cells. Cell Signal 26:2299–2305 Jang J, Wang Y, Lalli MA et al (2016) Primary cilium-autophagyNrf2 (PAN) axis activation commits human embryonic stem cells to a neuroectoderm fate. Cell 165:410–420 Lu WH, Wang G, Li Yet al (2014) Autophagy functions on EMT in gastrulation of avian embryo. Cell Cycle 13:2752–2764