Sep 20, 1994 - 4. Atmospheric column radiative cooling over the world's oceans. Graeme L. Stephens, 1 Anthony Slingo, 2 Mark J. Wel)b, 2 Peter J. Minnett, 3.
JOURNAL OF GEOPHYSICAL
RESEARCH, VOL. 99, NO. D9, PAGES 18,585-18,604, SEPTEMBER 20, 1994
Observationsof the Earth's Radiation Budget in relation to atmospherichydrology 4. Atmosphericcolumn radiative coolingover the world's oceans GraemeL. Stephens, 1 AnthonySlingo, 2 Mark J. Wel)b,2 PeterJ. Minnett,3 PeterH. Daum3 LawrenceKleinman3 Ian Wittmcycr,1 and DavidA. Randall 1
Abstract. This paper introduces a simple method for deriving clima•,ological values of the longwaveflux emitted from the clear sky atmosphereto •,he ice-free ocean surface. Simulationsof the clear sky longwavefluxes to space and to the surface are employedin this study to assistin the developmentof this flux retrieval which requires monthly averagedcolumn-integratedwater vapor w and the clear
sky top-of-atmosphere(TOA) outgoinglongwaveflux (both availablefrom sa•,ellite measurements).It is shownusing both theory and data from simulationshow •,he ratio of the surfaceto TOA flux is a simple function of w and a validation of •,he simple relationship is presentedbasedon a limited set of surfaceflux measurements. The rms difference
between
the retrieved
surface fluxes and the sim•fla•,cd surface
fluxesis approximately 6 W m-2. The clearsky columncoolingrate of the atmosphereis derivedfrom the Earth Radiation Budget Experiment (ERBE) vahms of the clear sky TOA flux and the surfaceflux retrieved using Special Scanning MicrowaveImager (SSM/I) measurements of w togetherwith ERBE clear sky fluxes. The relationshipbetween this column coolingrate, w, and the sea surface temperature (SST) is exploredand it is shownhow the coolingrate systematically increasesas both w and SST increase. The uncertainty implied in these estimates
of coolingare approximately 4-0.2K d-1. The effectsof cloudson thislongwave cooling are also explored in a limited way by placing boundson the possibleimpact of cloudson the column coolingrate based on certain a•qsumptions about the effect of cloudson the longwaveflux to the surface. While a more global assessment of the cloud effect must await use of new satellite
data that will allow us to estimate
the contributions by cloudsto these surfacefluxes, it is shown in this paper how the longwave effects of clouds in a moist atmospherewhere the column water
vaporexceeds approximately 30 kg m-2 maybe estimated frompresently available satellitedata with an uncertaintyestimatedto be approximately 0.2 K d-1. Based on an approach describedin this paper, we show how clouds in these relatively moist regionsdecreasethe columncoolingby almost 50% of the clear sky values and the existenceof significantlongitudinal gradientsin column radiative heating acrossthe equatorial and subtropical Pacific Ocean. 1. Introduction
The energy balanceof the Earth, the distribution of energy in space, and its variation in time are funda-
mentalcharacteristics of the Earth's climatesystem.It • Department of Atmospheric Science, Colorado StateUniversity, Ft. Collins, Colorado.
2HadleyCenterfor ClimatePredictionand Research, Braeknell, England.
aBrookhaven NationalLaboratory,Upton,New York. Copyright 1994 by the American GeophysicalUnion. Paper number 94JD01151.
0148-0227/94/94JD-01151505.00
is crucial to understandhow this energy balanceis altered in responseto increasedconcentrationsof greenhousegasesto understandand ultimately predict any impendingglobalclimate change.Unfortunately,quantitative estimates of the individual componentsof this energybudget,evenin its mostrudimentaryannualand global-mean form, are subject to large uncertainties sincemany of the key fluxesof energyare yet to be measuredoverthe globe. For instance,the fluxesof energy to and from the surface,at least on the globalscale,are primarily derived from model calculations or estimated
from empiricalformulaeand must be consideredhighly
uncertain [e.g.,Randall et al., 1992;Guptaet al., 1992]. Methods usingsatellite observationsfor retrieving these fluxes,with the exceptionof the solar flux to the surface 18,585
18,586
STEPHENS ET AL.: EARTH'S RADIATION
BUDGET
[e.g.,$chmetz,1989;Pinker and Laszlo,1992; Ccsset the present study, and section 3 introduces results from al., 1991],remainlargelyundeveloped. Despitethissit- the simulationsystemof $1ingoand Webb[1992],which uation, important but limited advancesto our view of this global energy balance have emerged from satellite measurementsof the radiative fluxes at the top of the atmosphere. These advancesbegan in the late 1960s and continueinto the presentthrough the Earth Radia-
are subsequentlyusedin section4 to developa new diagnosticmethod for the retrieval from satellite data of
Fg. Resultsof this retrievalapproachand a limited validation of the method are presented in sections4 and
5 respectively.Once the clear sky longwaveflux to the
tion BudgetExperiment(ERBE), [Houseet al., 1986]. surfaceis known, the clear sky atmosphericlongwave This paperis the finalin a series[Stephens andGreen- coolingis then determined in the manner describedin wald, 1991a,b, hereafter referred to as parts i and 2; section6, where the correlation between the magnitude Stephenset al., 1993, hereafterpart 3], whichseekto of this cooling and the column water vapor is also exexplore new uses of global satellite data to study re- plored. lationshipsbetween certain componentsof the energy It remains, however, a considerablechallengeto esbudget and the hydrologicalcycleof the climate system. tablish meaningfulwaysof usingpresent-dayspacemeaThe motivation, in part, is to develop useful diagnos- surements to estimate the contributions by clouds to tic tests of current global climate models and, in part, the surface longwave fluxes and therefore to the colto study rudimentary relationships between radiation umn heating rates. Despite theseunmet challenges,we and the atmosphericbranch of the Earth's hydrologi- demonstrate in section 6 of this paper how upper and cal cycle. The main aim of this paper is to introduce a lower bounds can be placed on these cloud effects and simple method for deriving climatological values of the furthermore demonstrate how the longwave effects of longwaveflux emitted from the clear sky atmosphereto cloudsin a moist atmosphere, where the column water
the surface(hereafterdenotedas Fg) and in sodoing vaporexceedsapproximately30 kg m-2,
may be es-
explore the connectionbetween the longwaveradiation timated from presently available satellite data with an budget and the water vapor content of the atmosphere. accuracy of approximately 0.2 K d-1. Basedon the apThe flux Fg is oneof the principaldriversof the planet's proach described in section 6, we show how cloudsin greenhouseeffect. It is the emissionof infrared radia- theserelatively moist regionsdecreasethe columncooltion from the atmosphere to the surface that maintains ing by almost50 % of the clearsky valuesand we infer the mean surfacetemperatureof the Earth (approxi- the presenceof significantgradientsof columnradiative mately288 K) abovethe meaneffectivetemperatureof heating acrossthe equatorial Pacific.
the planet (approximately255 K). It is also the am-
plification of this flux due to increasedconcentrations 2. Data Sources of water vapor, driven by increased concentrationsof other greenhousegases,that is thought to establishthe The main sourcesof the global data analyzed in watervaporfeedback[Manabeand Wetherald, 1967]. this study are those describedand used previouslyin We currently estimate that the globally averagedat- part 3. These data include the ERBE fluxes, the colmosphereconstantlylosesenergyby radiation at a rate umnwater vaporretrievedby Greenwald et al. [1993] ofapproximately 100W m-2 [Ramanathan et al.,1989]. based on passive microwave measurements obtained It is a related goal of this study to estimate the clear sky from the DefenseMeteorologicalSatellite Program's
longwavecontributionto this lossas well as the longwave contributions by clouds in selectedregionsof the globe. The lossof radiative energyby the atmosphere is compensatedby energy transfer from the surfacevia convectiveand turbulent transfer processes.The global balance achievedin the atmospherethrough the combination of the radiative and nonradiative processesis
(DMSP) SSM/I instrument[Hollingeret al., 1987],and the sea surfacetemperature(SST) data of Reynolds [1988]. The resultsfrom the ColoradoState University GeneralCirculationModel (GCM) definedin part 3 are also utilized but more sparinglyin this study. An important new sourceof data for this study is the simulation of the clear sky longwave radiative fluxes
generallyreferredto as a radiative-convectiveequilib- obtainedfrom the systemof $1ingoand Webb[1992] rium. The major contributors to this equilibrium is the flux of heat supplied by latent heating, associatedwith precipitation in the atmosphere, and the loss of longwave radiant energy by the atmosphere. It is common to expressthis lossof radiant energyas the rate of cool-
ing of the atmosphericcolumn. Global scalechanges in this cooling imply compensatingchangesin latent heating and thus changesin the Earth's hydrological cycle. It is appropriate then to considerthis cooling as a fundamental measure of the activity of the Earth's
for the simulation and analysis of measurementsfrom
satellitesusingoperationalanalyses(SAMSON).These simulationsuseinitialized analysesfrom the operational archiveat the EuropeanCentre for Medium-Range
WeatherForecasts (ECMWF) but with the columnwater vaporconstrained to the SSM/I values,asdescribed by Webbetal. [1993].Temperatureandspecifichumidity data on 19 model levelswere directly incorporated into the simulationsalong with analyzedsurfacepressure.
greenhouse effectand in turn an indirect measureof the SAMSON is constructedarounda high spectralresactivity of the hydrologicalcycle in heating the atmo- olutionradiativetransfermodel[Shine,1991]that insphere. corporatesthe ECMWF analysesfrom the operational Section 2 offers a brief account of the data used in archive. The accuracyof the radiation model employed
STEPHENS
ET AL.' EARTH'S
RADIATION
by SAMSON wascheckedusinga single-colu•nn version 3. SAMSON appliedto Intercomparisonof Radiation Codesfor Cli-
BUDGET
18,587
Simulations
mateModels(ICRCCM) testprofilesJEllingson et al.,
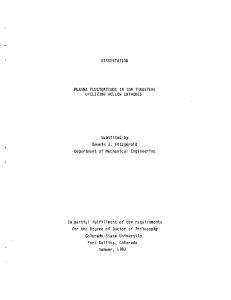
Simulationsof the monthlymeanclearskyfluxesover 1991]. Calculationsof clearsky outgoinglongwavera- the ice-freeoceanswerecarriedout for the periodMarch diation(hereafterrepresented asFo•) for fivestandard 1988 to February 1989 which is also a period for which atmosphereswith effectsof water vapor, carbondiox- both ERBE and SSM/I observations are available.As ide, and ozonedifferedfrom line-by-line calculationsof in the originalstudyof $1ingoand Webb[1992],these Fo• by approximately 1 W m-2, suggesting excellent simulationsapply to a horizontal resolutionof 5ø. The agreement with thesereference calculations [$1ingo and radiationcodewas appliedto eachdaily analyses(a Webb,1992].Comparison of clearskyvaluesof Fg de- meanof four 6 hourly analysisfor eachday) and then pendsto a small extent on the specificdetailsof how averaged to produce the monthly •nean flux distributhe continuum absorptionis dealt with in the model. tions which are used in the analysesdescribed below. The treatment of the continuum is described by Shine BothSlingoandWebb[1992]andWebbetal. [1993]dis-
[1991]andis basedonthe far-wingtreatmentof Clough cuss the differences between the simulated fluxes from et al. [1986].Variationsof the treatmentof thiscontin- SAMSON and the clear sky valuesof Fo• obtained from
uum can introduce
uncertainties
in calculations of the
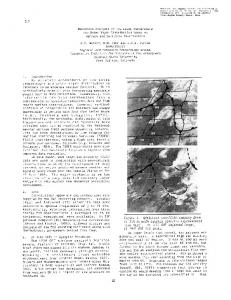
ERBE. Figure i presentsexamplesof scatterdiagrams
surfaceflux up to 10 W m-2 [Ellingsonet al., 1991]. of the SAMSON Fo• versusthe ERBE Fo• for April, SAMSONsimulations of Fg agreedwith reference ICR- July, and September1988and January1989to highlight CCM calculationsof this flux within 3 W m-2. For the simulationsshown below, the effectsof mi-
somegrossfeatures of these comparisons.For instance,
nor tracegasesof nitrousoxide,methane,CFCll, and
a slightpositivebiasof 3-5 W m-2 existsbetweenthe SAMSON and ERBE fluxes,a biassimilarin both sign
CFC12 were included in addition to water vapor, car-
and magnitude to that of the ERBE clear sky flux data
[Harrisonet al., 1988]. As Webbet al. [1993]show, bethesegases,whichare assumedto be uniformlymixed there are regions(not shown)wherethe differences in the atmosphere, aregivenby $1ingoand Webb[1992]. tween the simulated fluxes and the ERBE-derived fluxes bon dioxide and ozone, and the volume mixing ratios of
The research describedin this paper also introduces exceed this small bias, such as over the areas of masurfaceradiation flux data collectedduring two oceano- rine boundary layer clouds off the west coasts of the
graphicresearchcruisesby the R/V Alliancein the major continentswhere differencesmay be as large as Mediterranean
Sea off Crete in June 1990 and off Cor-
10 W m -•.
These areas can be traced to biases in
sica in the fall of 1991 and by the USCGC Polar Sea the ECMWF water vapordata [e.g.,Liu et al., 1992; cruisein the ArcticSeain July and August1992[Min- Stephenset al., 1994].
neff,1992,1993;NEWATER,1993 i. Forthe present Except for these particular regionsthe simulations
purposesthe relevant data from these cruisesconsist of clear sky Fo• from SAMSON generally agree with ERBE estimates of this flux to within 5-10 W m -• of measurementsof downwellinginfrared fluxes at the which is considered to be of the same order of uncersurfacemeasured by Eppley pyrgeometersmounted on a mast at 16 m above sea level, observedcloud amounts, tainty of the latter. There are also no a priori reasonsto
of clearsky Fg to be and concurrentradiosondedata. During the 1990 Mediter- expectthe SAMSONsimulations grossly in error although it is noted above how the speraneanexperimentthe shipwasoverflownon four occacific details of how the continuumabsorptionis modeled
sionsby the U.K. meteorological research flight C-130 whichcarrieda precisionpyrgeometer.The differences may introducean uncertaintyof the orderof 10 W m-2. betweenthe ship measurements and the aircraft mea- Bearing this possibilityin mind, simulateddistributions surements were7,18,-4,and4 W m-2 whichrepresentsof Fg overthe ice-freeoceansare presentedin Platesla andlb in theformofthesurface netflux(i.e.,erT• 4- Fg). 2-5% rangeof differences from the measuredflux. The maps of the surfacenet flux shownin Plates lc and Surfaceradiation budgetdata also collectedin sup- l d are those derived by the approach described below
portoftheTropicalOceanGlobalAtmosphere (TOGA) and are presented here for comparison. The smallest CoupledOcean AtmosphereResponseExperiment
net fluxesof around40-50 W m-2 occurin the tropical
(COARE)at fourislandsites;theatollofMajuroin the convergencezones over the Pacific and Indian Oceans
Republicof the MarshallIslandsat 7 ø 05' N latitude and in the Northwest Pacific in July. A significantanand 171ø 23' E longitudeand the islandsof Pohnepiand nual variation closeto the northern continentsalso apChuuk in the Federated States of Micronesia at 6ø 58' N pearsto existwhichis associatedwith changesin the at-
latitude and 158ø 13' E longitude and 7ø 27' N latitude mospheric circulation associatedwith the summer and and 151ø 50' E longitudeand the island site of Kavieng winter monsoons.There is also a closecorrespondence 2 ø 30'S 150 ø 48'E. In addition to these island sites a in the tropics between column-integratedwater vapor site located at Darwin 12ø 25'S 130ø 51'E, Australia is w (discussed later in relationto Plates2c and 2d) and also usedin this study. The details of the TOGA data, the surface net longwavefluxes shown in Plate 1. This its quality control, calibration, and its accessibilitywill arisesbecauseatmospherictemperatures are relatively be describedin a forthcomingpaper by the principal uniform in the tropics, so the net flux is mainly deterauthor and is describedin the report of Cornwall et al. mined by the lower tropospherichumidities, which also
[19931 ß
dominatew [e.g.,Stephens, 1990].
18,588
STEPHENS ET AL.' EARTH'S RADIATION
A
BUDGET
Jul•
1988
1988
300
300
280
LU 280 ...d
0
""'
•
260
2•o
o
o
.. ß
.
220
220
RMS
200
200
,
,
,
I , 220
i
•
I i', 240
,
I , 260
,
=
,
I , 280
RMS
4.54
,
,
I , 300
October
=
4.62
200 200
220
240
260
280
300
Cleor-sky OLR from SAMSON
Clear-sky OLR from SAMSON
Jonuo
1988
1989
300
300
LU 280
I,LI 280
E
E o •
ß
• 2•o
? 240
o
L
260
o
260
o ß
½
½ 240 i
I
220
220
RMS
=
RMS
5.52
=
4.70
200
2OO 2OO
240
220
240
260
280
.300
Clear-sky OLR from SAMSON
200
220
240
260
280
.300
Clear-sky OLR from SAMSON
Figure 1. Scatterdiagrams of (SAMSON)simulated Fooversus(ERBE) analyses of clearsky longwave fluxesfor April, July,and September1988and January1989.
STEPHENS SAMSON
ET AL.: EARTH'S
RADIATION
BUDGET SAMSON Simulation JAN 1989
Simulation
JUL
18,589
1 988
(o) 40
50
60
70
80
90
100
110
121
120
Linear fit from ERBEand SSM/I
Linear fit from ERBEand SSM/I JUL
JAN
1988
1989
I
'-- •
• ,
'-' •'
....
•
,._ • • %
-.-•. •.. .
-
-
.,:•:.•..•
•-'•'-•=',."'•"•_-•li'-
' .' • •., •
•
• :'
ß'•: ,•...... • !'< .,. :%½ .•' .. ,,• ...
• •,
-..- & >;., ß .• ........ ,..•,-•'u- •.,?'-ß,:. /•' ß' ..:::?•4 -...•.:-'•,'•' - ....... . •' •.•'•'%,.,½•
I• i
•
-
....
....
- '.
'_,,.:,_.: ':"•:...,..•*,.:'.,,..'. ....... . ..:.>. . . ' .•
/•',.,;'.-.• ..x,..... ,.:: • .i. 30
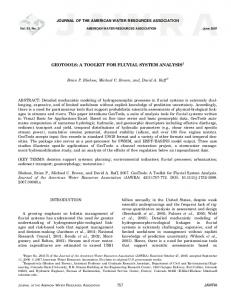
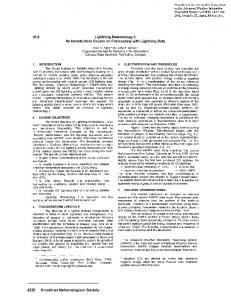
kgm-• derived assuming AF• = 15W m-:• forJuly1988andJanuary 1989,respectively. (c) and (d) The net longwavecol-_mncooling(sumof Plates2a and 2b and Plates4a and 4b for
July1988andJanuary1989,respectively, forthoseregions wherew > 30 kgm-•.
tionshipsbetweencertain aspectsof the energy budget of the climate system and its hydrologicalcycle. The motivation, in part, is to developusefuldiagnostictests of current global climate models. The present paper introducesa simple method for deriving climatological valuesof the longwaveflux emitted from the clear sky atmosphereto the ground and presentsa validation of this approach. A related goal of the researchdescribed
in this paper is to apply these fluxes to the cMculation of the column cooling rate of the atmosphere. We considerit appropriate to view this coolingas a fundamental measure of the activity of the Earth's greenhouse effect and the global character of this coolingin turn as an indirect measureof the Earth's hydrologicalcycle. As such, we explore bulk relationshipsbetween the clear sky column cooling rate and the hydrologicalcy-
18,602
STEPHENS ET AL.- EARTH'S RADIATION BUDGET
-2-01
-1-84
-2-ILO -1-•1•
-1-1•
-I-'IS
(d)
-1-49
-l-b-"/
-1.31
-1-40
-1.14
-1-221 -1-86
Net Cool ing
--96
-.79
--88
--70
don 1989
Plate 4. (continued)
cle as diagnosedby the columnwater vaporamount. previouslyby Slingoand Wcbb[1992],generallymatch We also explore, in a limited way and for specificre- the ERBE estimates of the same fluxes within 5-10
gions,howwemightassess theeffects ofclouds onthis W m-2 witha smallbias(ofapproximately 3 W m-2) longwavecoolingalthoughit is clear that a moreglobal which also happensto be of a similar magnitudeand assessmentmust await use of new satellite data that sign of a reported bias in the ERBE clear sky flux data
willallowusto estimate thecontributions byclouds to [Harrison e• al., 1988].Theuncertainty in theSAMthesurface longwave fluxes andtherefore to thecolumnSONclearskymonthlymeanFgisalsoprobably ofthe heatingratesin a meaningful way. orderof 10 W m-2 althoughwe havelittle data to The majorresultsandconclusions of thisstudyareas confirmthisuncertainty.
follows: 1. SAMSON simulations oftheclear skylong-2. A newrelationship between theratioofFgandF•
wave fluxesto spaceand to the surfaceare employed and the columnwater vaporw is introduced.This relain this study to assist in development of a retrieval of tionship is derived over ocean surfacesthat emit as an
Fg. Simulations of the flux to space,Fc•, as reported assumed blackbody.It is demonstrated usingthe SAM-
STEPHENS
ET AL.: EARTH'S
SON results how this ratio is approximately linear when
w > 20 kg m-2,
as predictedby graybodyradiative
RADIATION
BUDGET
18,603
radiative heating acrossthe equatorial and subtropical Pacific
Ocean.
equilibriumarguments. When the water vapor amount
is below20 kg m-2,
the relationship,while still dis-
tinct, takes on a nonlinear curve of growth form. Independent surfacelongwaveflux measurements,combined with F• simulatedusingmeasuredradiosondetemperature and moisture profiles in a radiative transfer model, confirm the existenceof this general flux ratio-w relationship. The extent to which this relationship exists over land is not explored in this study, although it is likely that the relation will break down over surfaces of variable emissivity such as may occur over arid land regions. 3. A simple linear fit applied over the range w > 20
kg m-• wascarriedout to determine theslopeandintercept coefficients.The valuesof these coefficients,to-
Acknowledgments. The principal author's research basedon collectingand measuringsurfaceradiation fluxes is supportedby ONR contractN00014-91-J-422 P0002,and early aspectsof this work were supportedunder NOAA grant NA90RAH0077, and together with PHD and LK by the U.S. Department of Energy under Contract DOE-
FG02-89ER69027. PJM was supportedby NOAA grant NA26GP0266andby the NSF grantDPP-9113962through
subcontract 91-1178-01 with the North Carolina State Uni-
versity. Both AS and MW were supportedunder the U.K.
Departmentof the EnvironmentcontractPECD 7/12/37,
and the GCM researchof DAR wassupportedunder NASA
grant NAGl-1266. While preparingthis manuscript,the
lead author was made aware of the research of V. Ra-
manathan dealing with topics similar to those discussedin
this paper. The interestedreaderwishingto accessthe flux
getherwith SSM/I observations of w and ERBE obser- data collected as part of TOGA COARE and describedin
vations of the clear sky F•, are usedto obtain monthly this paper can do so by usingthe e-mail addressdescribed mean valuesof Fg over the oceans. Examplesof the further by Cornwallet al. [1993]. results of this simple retrieval are presented and con- References trasted
with
ence between
those from SAMSON and the rms differthe retrieved and the simulated fluxes is
4-6W m-2, whichis considerably smallerthanthe un-
Cess,R. D., E.G. Dutton, J. J. Deluisi,and F. Jiang, Deter-
mining surface solar absorption from broadband satellite measurementsfor clear skies: Comparison with surface measurements of this flux. measurements,J. Clim., 4, 236-247, 1991. 4. We use our retrieval of Fg from satellite measure- Clough, S. A., F. X. Kneizys, L. S. Rothman, G. P. Anderson, and E. P. Shettle, Current issuesin infrared atments of F• and w together with climatologicalvalues mospherictransparency,in Atmospheric Transparencyfor of surfacepressureand SST to arrive at monthly mean
certainty presently expectedfrom the direct radiometric
Satellite Applications,edited by G.V. Silvestini,CUEN, distributionsof the column-averagedclearsky longwave Capri, Italy, 1986. heating rates and proposethat this heating rate has an Cornwall, C. R., C. L. Combs,J. M. Davis, G. L. Stephens, uncertaintyof approximately4-0.2 K d-1. Thesecoland S. K. Cox, CSU Radiation Budget pilot study for
umn heatingrates, when contrastedwith the SSM/I
TOGA COARE, CSU Atmos. Sci. Pap. 532, 57 pp., Colo.
State Univ., Fort Collins, 1993. Dutton, E.G., An extended comparison between LOWstratea systematicincrease(in cooling)as w increases
fields of w that were used to produce them, demon-
in an almost linear manner, as predicted by a simple analysisgiven in this paper. Under moist conditions,
TRAN7 computed and observed broadband thermal radiances: Global
extreme
and intermediate
surface condi-
tions, J. Atmos. Oceanic Technol.,10, 326-336, 1993. wherew >40 kg m-•, the rate of growthof cooling Ellingson,R. G., J. Ellis, and S. Fels, The intercomparison with increasingw slightly decreasesdue to a decreasof radiation codesin climate models: Longwaveresults, J. Geophys.Res., 96, 8929-8953, 1991. ing sensitivityof F• with increasingw. However,when viewed as a function of SST rather than as a fi•nction of Greenwald, T., G. L. Stephens,T. VonderHaar, and D. Jackson, A physical retrieval of cloud liquid water over the w, the column coolingrate dramatically increaseswith global oceansusing SSM/I observations,J. Geophys.Res.,
increasingSST. This is shownto be due to the increase 93, 18,471-18,488, 1993. of emissionfrom the atmosphere to the surface associ- Gupta S., W. L. Darnell, and A. C. Wilber, A parameteriated with increasingw whichis linkedto the increasing zation for longwave surface radiation from satellite data: SST. We deduce that
this increase in the flux emitted
from the atmosphereis more than twice the rate of increase of the flux emitted from the surface.
5. Upper and lower boundson the effectsof cloudson the column cooling rate of the atmosphereare established and, furthermore, we demonstratehow the longwave effectsof cloudsin a moist atmospherewhere the
columnwatervaporexceeds approximately 30 kg m-• may be estimatedfrom presentlyavailablesatellitedata with an uncertainty estimated to be not significantly
largerthan 0.2 K d-•.
Basedon the approachde-
scribed in section 6, we show how cloudsin these rela-
Recent improvements,J. Appl. Meteorol., 31, 194-211, 1992.
Harrison, E. F., D. R. Brooks, P. Minnis, B. A. Wielicki, W. F. Staylot, G. G. Gibson, D. F. Young, F. M. Denn, and the ERBE Science Team, First estimates of the diurnal variation of longwaveradiation from the multiple-satellite Earth Radiation Budget Experiment(ERBE), Bull. Am. Meteorol. Soc., 69, 1144-1151, 1988. Hollinger,J., R. Lo, C. Poe, R. Savage,and J. Pierce,Special Sensormicrowave/imageruser'sguide, NRL Rep., Nav. Res. Lab.,
Washington, D.C., 1987. House, F. B., A. Gruber, G. Hunt, and A. T. Mecherikunnel, History of satellite missionsand measurementsof the
tively moist regionsdecreasethe columncoolingby alEarth Radiation Budget (1957-1984), Rev. Geophys., most 50 % of the clear sky valuesand how we infer the 357-377, 1986. presenceof significantlongitudinalgradientsin column Liu, W. T., T. Wang, and F. Wentz, Precipitablewater and
18,604
STEPHENS
ET AL.:
EARTH'S
surfacehumidity over the global oceansfrom SSM/I and
RADIATION
BUDGET
lation modelto cloudlongwaveradiativeforcing,I, Intro-
duction and initial experiments,Q. J. R. Meteorol.Soc., ECMWF, J. Geophys.Res., 97, 2251-2264, 1992. 11•, 1027-1062, 1989. Manabe, S., and R. T. Wetheraid, Thermal equilibrimn of the atmosphere Slingo,A., and M. J. Webb, Simulationof clear sky outgoing longwaveradiation over the oceansusingoperational with a given distribution of relative humidity, J. A tmos. analyses,Q. J. R. Meteorol. Soc., 118, 1117-1144, 1992. $ci., Stackhouse,P. W., Jr., and G. L. Stephens,A theoretical 2•(, 241-259, 1967. and observationalstudy of the radiative propertiesof cirMcClatchey, R. A., R. W. Fenn, J. C. Selby,F. E. Volz and rus: Results from FIRE 1986, J. Atmos. Sci., 48, 2044J. S. Goring, Optical Properties of the Atmosphere,3rd 2059, 1991. ed., 107 pp., Air Force Cambridge Res. Labs, 1972. Minnett, P. J., Surface oceanographic and atmospheric Stephens,G.L., On the relationshipbetweenwater vapour over the oceansand seasurfacetemperature.J. Clim., 3, measurementsmade during the Mediterranean Aircraft634-645, 1990. ShipTransmission Experiment(MASTEX) from the R/V Alliance, $ACLANT Cent. Memo., $M-26•, 131 pp. Stephens,G. L., and T. J. Greenwald,Observations of the SACLANT Undersea Res. Cent., La Spezia, Italy, 1992. Earth'sRadiationBudgetin Relationto Atmospheric HyMinnett, P. J., Measurementfor satellite validation made drology,1, Clearskygreenhouse effectand watervapor from the RV Alliance during October and November1991, feedback,J. Geophys. Res.,96, 15,311-15,324, 1991a. SACLANT Cent. Memo., $M-•73, 268 pp. SACLANT Stephens,G. L., and T. J. Greenwald,Observations of the Undersea ResearchCentre, La Spezia, Italy, 1993. Earth'sRadiationBudgetin relationto atmospheric hy-
NEWATER Steering Committee and Principal Investigators,
drology,2, Cloudeffectsandcloudfeedback, J. Geophys. Res., 96, 15,325-15,340,1991b.
Collaborative research on the Northeast Water Polynya: Initial results from the 1992 polar sea cruise, ES Trans. A GU., 7•, 185 and 195-196, 1993.
Stephens,G. L., D. A. Randall,I. L. Wittmeyer,and D.A. Dazlich,Observations of the Earth'sRadiationBudget in relationto atmospheric hydrology,3, Comparison of Pinker, R. T., and I. Laszlo,Modelingsurfacesolarirradiobservations overoceanswith a GCM, J. Geophys. Res., 98, 4931-4950, 1993. ance for satellite applicationson a global scale,J. Appl. Stephens,G.L., D.L. Jacksonand J.J Bates, A comparison of SSM]I and TOVS columnwater vapordata overglobal oceans,Meteorol. Aimos. Phys., in press, 1994. 32, 1989. Webb, M.J., A. Slingo, and G.L. Stephens, Seasonalvariations of the clear sky greenhouseeffect: The role of Randall,D.A., et al., Intercomparison and interpretationof surfaceenergyfluxesin atmosphericgeneralcirculation changes in atmospheric temperatures and humidities, models, J. Geophys.Res., 97, 3711-3724, 1992. Clim. Dyn., 9, 117-129, 1993. Reynolds,R. W., A real-time globalseasurfacetemperature Meteorol., 31, 194-211, 1992.
Ramsnathan,V., B. R. Barkstrom,and E. F. Harrison,Climate and the Earth's Radiation Budget, Phys. Today,22-
analysis, J. Clim., 1, 75-86, 1988.
Rodgers,C. D., The use of emissivityin atmosphericradiation calculations, Q. J. R. Meteorol. Soc., 93, 43-54, 1967.
P.H. Daum and L. Kleinman,Environmental Chemistry Division,Brookhaven NationalLaboratory, Upton,NY 119735000.
P.I. Minnett, Oceanographic and AtmosphericSciences Sabatini,R. R., and V. E Suomi,On the possibilityof atNationalLaboratory, Upton,NY 11973mosphericinfraredcoolingestimatesfrom satelliteobser- Division,Brookhaven vations, J. Aimos $ci., 19, 349-350, 1962. Schmetz,J., Towardsa surfaceradiation climatology: Retrieval of downward irradiance from satellites , Atmos. Res., 23, 287-321, 1989.
5000.
D.A. Randall,G.L. Stephens, andI. Wittmeyer,Department of Atmospheric Sciences,ColoradoState University,Fort Collins, CO $0523.
Shine, K. P., On the cause of the relative greenhouse A. 51ingoand M.I. Webb, Hadley Center for Climate strengthof gasessuchas halocarbons,J. Atmos.Sci., 48, Predictionand Research,MeteorologicalOffice, Bracknell, 1513-1518, 1991.
Shine,K. P., and A. Sinha,Sensitivityof the Earth's climate to height dependentchangesin the water vapor mixing
England.
ratio, Nature, 354, 382-384, 1991. (ReceivedNovember8, 1993;revisedApril 6, 1994; Slingo,A., and J. M. Slingo,The response of a generalcircu- acc•eptedApril 20, 1994.)