asynchrony (SOA: -400, -200,0,200,400, and 600 msec). Subjects were able to
perform the tasks quite independently, and most of the interference that resulted ...
Memory & Cognition 1978, Vol. 6 (4) 446-453
Attention demands of visual search GORDON D. LOGAN
Erinda/e College, University of Toronto, Mississauga, Ontario, Canada L5L 1C6
The relation between attention demand and the number of items in the array (array size) was investigated by engaging subjects in a primary search task and measuring spare capacity at different points in time, with a secondary tone task that occurred randomly on half of the trials. The major variables in both tasks were array size (4, 8, or 12 letters) and stimulus onset asynchrony (SOA: -400, -200,0,200,400, and 600 msec). Subjects were able to perform the tasks quite independently, and most of the interference that resulted from nonindependence appeared in tone-task performance. The amount of interference (i.e., maximum tone reaction time) was independent of array size, but the duration of interference (i.e., the number of SOAs at which tone reaction time was elevated) increased with array size. The findings were interpreted as supporting unlimited-capacity models of visual search performance. When a person's attention is engaged in searching for a target in a. visual array, to what extent are the attention demands of searching determined by the number of items in the array (array size)? This question has stimulated thought and research for several years (for a review, see Smith & Spoehr, 1974), yet remains unanswered. The earlier efforts have made it clear, however, that more is required than a simple account of the observed increase in reaction time and error rate with array size. Assuming that attention demands increase with array size can lead one to predict the same increase in reaction time and error rate as assuming they do not. Moreover, assuming the items are processed simultaneously, in parallel, can lead to the same predicted array-size effect as assuming items are processed one at a time, in series. These points have been demonstrated formally by Taylor (1976) and Townsend (1974), leaving the search literature in a state of seemingly permanent uncertainty: The present paper adopted a different strategy for measuring attention demands, motivated by technical advances in the attention literature. The idea was to vary attention demands and array size independently by engaging people in a demanding concurrent task while searching. The relation between attention demand and array size may then be revealed by changes in the array-size effect in search performance corresponding to changes in the attention demands of the concurrent task, or by the effect of array size itself on performance in the concurrent task, or both. If larger arrays do demand more attention, they should suffer This research was supported in part by Grant AO 127 from the National Research Council of Canada to Albert S. Bregman at McGill University. I would like to thank Jane Zbrodoff, Alan Quapick, Morris Moscovitch, and Bruce Schneider for comments on the manuscript. Requests for reprints may be addressed to Gordon D. Logan, Department of Psychology, Erindale College, University of Toronto, Mississauga, Ontario, Canada L5L IC6.
more interference from concurrent activity and interfere more with the concurrent task (for a full development of this argument, see Logan, 1978). Using this technique, predictions may be developed to distinguish the four classes of models that predict identical array-size effects. Interference between tasks will be stronger the more the demands on attentional capacity exceed the supply. Since people are flexible in their allocation of capacity, able to change it in response to instructions or expected value (e.g., Shulman & Fisher, 1972), it is convenient to designate one of the tasks as primary, so that it always receives sufficient attention for optimal performance, and the other as secondary, so that it may only draw on spare capacity left over from the primary task (Kahneman, 1973; Posner & Boies, 1971). Under these conditions, the effects of concurrent activity are most prominent in the secondary task. Moreover, predictions derived with search as the secondary task should converge on predictions derived with search as the primary task. First, consider changes in the array-size effect when search is the secondary task. Limited-capacity parallel models must predict a larger array-size effect with concurrent activity than without. They rest on the assumption that all items are processed simultaneously and draw on attentional capacity simultaneously, so that attention demands increase with array size. Assuming further that the speed and accuracy of processing the target are reduced in proportion to the load on capacity, these models predict the observed array-size effect (Atkinson, Holmgren, & Juola, 1969; Nickerson, 1972; Rumelhart, 1970). When capacity is consumed by concurrent activity, proportionately less capacity is available for processing each item, so reaction time and error rate should increase further in proportion to array size. This prediction is illustrated graphically in Figure lA. Unlimited-capacity parallel models predict no change in the array-size effect with concurrent activity. Items
446
ATTENTION DEMANDS OF SEARCH
~
:/ ~ .....
~
~
~
/;;;
~
AS
AS
~ "I!XX\" .
~ E~······. .
c
L.L.:~
Y~ SOA
SOA
"11'\'\'\ /
e ~ SOA
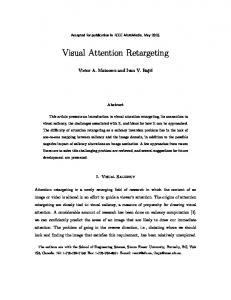
Figure 1. Possible outcomes in concurrent-task search experiments. (Panels A and B represent search-task data when search is the secondary task. Reaction time and array size are the coordinates; the top lines represent concurrent-activity trials, the bottom lines, single-task trials. In A, attention demands increase with array size; in B, attention demands are constant for all array sizes. Panels C, D, and E represent secondary-task data when search is the primary task. Reaction time and stimulus onset asynchrony are the coordinates; solid lines = 4-letter arrays; broken lines 8..Jetter arrays; dotted lines l2-letter arrays. The contours need not peak at a point nor increase and decrease linearly around the peak; these aspects of Panels C, D, and E are for graphic convenience. The models predict only monotonic increases and decreases that are gradual rather than abrupt to account for statistical variation in the duration of attention demand. In C, the amount and duration of attention demand increases with array size; in D, the amount and duration of attention demand are constant for all array sizes; in E, the amount of attention demand is constant, but the duration increases with array size.)
=
=
are assumed to be processed simultaneously, but without drawing attentional capacity. Each item is thought to add noise to a decision process, and since speed and accuracy of processing the target are reduced in proportion to the total amount of noise, the array-size effect is predicted (Estes, 1972; Gardner, 1973; Shiffrin & Geisler, 1973). Since the processes underlying the array-size effect do not demand attention, concurrent activity cannot change the array-size effect, although it may increase reaction time by a constant amount for all array sizes, as illustrated in Figure 1B. Serial models predict the array-size effect by assuming that items are processed one at a time, so that processing time (and thus reaction time) must increase with array size. Limited-capacity serial models assume that processing each item requires attention (e.g., Shiffrin & Schneider, 1977), so that attention demands increase with array size. When available capacity is reduced by concurrent activity, each item will require more time to be processed, so that the array-size effect will become stronger, as in Figure 1A. Unlimited-capacity serial models assume that processing each item does not require attention; attention demands should be constant for all array sizes, so the array-size effect should not change with concurrent activity, as in Figure 1B. However, serial processing must require a certain amount of bookkeeping, at least the system must determine when it
447
has finished processing the current item and which item to process next, and it is possible that this bookkeeping requires attention. With this assumption, unlimited-eapacity serial models would predict a larger array-size effect with concurrent activity, as in Figure lA, since the number of bookkeeping operations would increase with array size. Note that this assumption does not change the predictions of the other models: In parallel models, the amount of bookkeeping required is independent of array size, so the predicted effects would not change. Serial limited-capacity models already predict a larger array-size effect with concurrent activity; bookkeeping would enhance the effect, but the data should still look like Figure I A. I have reported a series of experiments in which visual search was the secondary task, performed in the retention interval of a primary short-term memory task (Logan, 1976, 1978). In all experiments, a concurrent memory load increased reaction time, but the array-size effect remained unchanged; the results resembled Figure IB (also see Logan, 1976, Experiment 2). These findings reduce the field of available models, supporting unlimited-capacity parallel models and the unlimited-capacity serial models that assume no bookkeeping (see Table 1). The present study was designed to reduce the field further. Visual search was the primary task, so that the attention demands associated with array size would be revealed most prominently in secondary-task performance. People were engaged in a visual search task in which they determined whether an array of 4, 8, or 12 letters contained an A or a V. At the same time, they performed a secondary, simple reaction time task, responding to a tone presented at one of six stimulus onset asynchronies (SOAs) defined relative to the onset of the array. Under these conditions, the function relating secondary-task performance to SOA defines, for the primary task, a "contour" of attention demand over time, which may be used to compare momentary demands of the same task at different points in time, or to compare the demands of different versions of the primary task. This procedure and rationale was first used by Posner and Boies (1971) Table 1 Predictions with Search as the Primary Task and the Secondary Task Possible Outcomes Assumptions
A+C
No Bookkeeping LP Bookkeeping LP;LS;US
A+D
A+E LS LS;US
B+C
B+D B+E UP;US UP
Note-Columns represent all possible combinations of outcomes in primary- and secondary-task search data. A, B, C. D, and E refer to outcomes illustrated in Figure 1. The entries represent the models predicting the outcomes; L = limited capacity; U = unlimited capacity: S = serial; P = parallel.
448
LOGAN
and has since gained wide currency (e.g., Comstock, 1973, 1975; Ells, 1973; Millar, 1975; Posner & Klein, 1973; Proctor & Fisicaro, 1977; Shwartz, 1976). In the present study, the range of SOA extended from -400 to 600 msec, Pilot data had suggested that this range would capture the onset and offset of attention to the search task, so that a complete contour of attention demand could be obtained for each array size. Two aspects of the contour, its height and breadth" are important, as they represent, respectively, the magnitude and duration of the attention demands of searching. Again, predictions may be developed for each of the four models: Limited-capacity parallel models predict contours that are higher and broader the larger the array, reflecting, respectively, the greater momentary demands of the larger arrays and the longer time spent in active attention to the array to meet the greater demand. The predicted contours are illustrated in Figure 1C. Unlimited-capacity parallel models predict contours equal in height and breadth for each array size, since the attention demands of searching do not increase with array size and search need not require attention until the target has been determined, after which the attention-demanding processes should be equal in duration for each array size. Because it will take more time to determine the target in a large array, search will begin to demand attention later, and the peak of the contour should appear later in time, further to the right on the SOA axis. These contours are illustrated in Figure lD. It is possible, however, that the onset of the array might evoke attention-demanding processes other than those designed to determine which target was presented (i.e., the bookkeeping processes mentioned earlier). Perhaps the normal response tendencies of the visual system must be changed temporarily to best discriminate the targets; the maintenance of such a set might constitute attentiondemanding bookkeeping (Logan, 1978). Similarly, the response tendencies of the hands might be altered dynamically (since people do not ordinarily press buttons when they see letters), and the maintenance of the new set might require capacity (Klapp, 1976). These processes would begin to demand attention once the array appeared and would continue to do so until a response was made. The time to respond depends on the duration of the unlimited-capacity target-determining process which, in turn, depends on array size. Thus, the duration of attention demand would necessarily increase with array size, although the amount demanded would not. The predicted contours, assuming bookkeeping, appear in Figure 1E. Note that the bookkeeping assumption does not change the predictions of limitedcapacity parallel models, since they already predict that the duration of attention demand should increase with array size. Limited-capacity serial models predict contours equal in height, with breadth increasing with array
size because momentary demands are constant across array size (since only one item is processed at a time), yet more time must be spent attending to the array (processing items) the larger the array. The predicted contours are illustrated in Figure IE. The predictions mayor may not be changed by assuming bookkeeping, depending on the nature of the assumed bookkeeping. Minimally, the system must be able to determine when it has finished processing the current item (so the next item can be selected) and to select the next one. Serial scanning theory holds that scanning is efficient in that items are only processed once (see Nickerson, 1972; Sternberg, 1975), and this imposes further constraints on bookkeeping. The items selected may be kept track of dynamically, perhaps by remembering the ones that have been selected (or equivalently, the ones that have not). In this case, momentary attention demands would increase with array size, and performance would resemble Figure 1C. Alternatively, the data structure in which the items are held might be exploited so that it keeps track of the items that have and have not been selected; selection might be based on some local property of the data structure that permits exhaustive sampling without replacement. For example, a circular array of letters has a ring-like structure that may be sampled exhaustively by iteratively selecting the next item clockwise from the current one. In this case, the physical array provides the organization-the spatial structure of the world constrains the activity of the perceptual system-and attention demands would be constant across array size. Performance would resemble Figure IE. Unlimited-capacity serial models predict contours equal in height and breadth, as in Figure ID, since neither the amount nor the duration of attention demand vary with array size. Assuming bookkeeping that concerns only the current item and the next one to be processed, performance would resemble Figure IE. Assuming bookkeeping that concerns all unprocessed items, performance would resemble Figure 1C. It is important to consider these predictions of secondary-task performance when search is the primary task in combination with the earlier predictions of search performance when search was the secondary task. The two sets of predictions converge on the models and their assumptions; models may stand or fallon their ability to predict performance in both situations. The predicted combinations are summarized in Table 1, where columns represent possible combinations of outcomes with search as the primary and the secondary task, the rows indicate whether or not bookkeeping is assumed, and the entries represent the models that predict the outcomes given the assumptions. Previous data with search as the secondary task have shown that the array-size effect does not change with concurrent activity, as in Figure IB (Logan, 1976, 1978). This restricts the set of possible models to unlimited-capacity serial models that assume no bookkeeping and
ATTENTION DEMANDS OF SEARCH unlimited-capacity parallel models that mayor may not assume bookkeeping. From Table 1, the possible outcomes in the present experiment where search is the primary task are (1) contours equal in height and breadth for all array sizes (Figure lD), supporting unlimited-capacity serial and parallel models that assume no bookkeeping, and (2) contours equal in height with breadth increasing with array size (Figure IE), supporting unlimited-capacity parallel models that assume bookkeeping. The first outcome would answer the question that began this paper; it would indicate that attention demands do not increase with array size. The second outcome would support one model uniquely and suggest the importance of bookkeeping processes. Finally, the procedure allowed an estimate of the effects of concurrent activity on search performance. Since the tone for the concurrent task was presented on only half of the trials, the difference between search performance on tone and no-tone trials may also reveal the attention demands of searching. If it is, indeed, appropriate to apply the previous results with search as the secondary task to the present situation, one should expect that responding to the tone would not increase the array-size effect. This prediction is, of course, weakened because search was the primary task. Nevertheless, a larger array-size effect with concurrent activity would be most informative.
METHOD Subjects Twelve graduate and undergraduate students and laboratory staff from McGill University served as subjects. Four were male and eight were female. None reported any perceptual defect, visual or auditory, and each was paid for participating in four I-h sessions. Apparatus and Stimuli The visual stimuli were arrays containing 4, 8, or 12 different letters equally spaced around an imaginary circle centered on the fixation point (see Logan, 1978, Figure 5). Each array contained one target letter, an A or a V. Each array size was represented by 48 different arrays in which each target letter appeared in each position equally often. The same was true for each nontarget letter (all remaining letters except Q), within sampling limitations. The arrays were made from black uppercase Letraset (717) mounted on white cards. The exposure of the array was preceded and followed by a fixation field containing a small black dot in the center of a white field. The stimuli were exposed in a Gerbrands three-field tachistoscope (Model T-3B-l) with a viewing distance of 80 ern. At this distance, each letter subtended about 26 by 26 min of visual angle, and the diameter of the imaginary circle on which the letters were placed subtended about 4 deg of visual angle. The luminance of fixation and array fields was matched at 8 fL; during testing the room was dimly lit by a 40-W bulb. Each day, 5 min were allowed for dark adaptation before testing began. The auditory stimulus was a 1,000·Hz sine tone produced by an Electronic Institute tone generator (Model 377) and presented binaural1y through headphones (Koss pro/4AA) at a comfortable listening level. The events on a trial began with the closure of a switch, which initiated both the timer associated with the tachistoscope and a set of Hunter timers (Model 111-(',
449
Series D) that control1ed SOA and the duration of the tone. The array appeared in the tachistoscope 400 msec after the switch closed. It remained on for 600 msec. The tone was presented for 500 msec at one of six SOAs, which ranged from -400 to 600 msec in 200-msec steps (positive values of SOA indicate that the tone fol1owed the onset of the array). Thus, the onset of the earliest tone immediately followed the closure of the switch, and the onset of the latest tone coincided with the termination of the array. The tone was presented on half of the trials. Trial-to-trial variation in SOA required that the Hunter timers controJling SOA be reset before each trial. Because the adjustment was audible to the subjects, the timers were also reset before trials on which the tone was withheld. On those trials, the circuit from the tone generator to the headphones was broken by the operation of a silent switch. In the search task, reaction time was measured from the onset of the array, using a digital timer. The timer began with the onset of the array, and stopped when the subject pressed one of two bu ttons mounted on a panel placed in front of him or her. Pressing each button also illuminated a separate light so that response accuracy could be monitored. In the tone task, reaction time was measured from the onset of the tone by a similar digital timer that started with the onset of the tone and stopped when the subject pressed a third button. All reaction times were measured in milliseconds. Procedure Each trial began with a verbal ready signal from the experimenter ("ready?"), to which the subject responded "yes" if he or she had the fixation point in sharp focus. About .5 sec later, the experimenter closed the switch that initiated the events of the trial in the manner described above. Since the subjects could hear the click of the switch, it served as a warning signal, occurring reliably 400 msec before the onset of the array. Each day, each subject completed 144 trials in four blocks of 36 trials. Each array size and target letter occurred equally often in each block. A tone occurred on half of the trials in each block, such that each SOA was paired once per block with each array size. Within these constraints, the order of conditions was randomized. One order of 144 trials was constructed, and it and its inverse were used throughout the experiment. Each subject alternated between the two orders day by day, half of the subjects beginning with one order (i.e., ABAB), half beginning with the other (i.e., BABA). Subjects were told to rest the middle and index fingers of their right hands on the two response buttons for the search task. They were told to press the left button with their index finger if the array contained an A, and the right button with their middle finger if it contained a V. To the left of these two buttons was the response button for the tone task. Subjects were told to rest the index finger of their left hand upon it, and to press it immediately when they heard a tone. Before testing began, subjects saw and heard examples of the stimuli, and had the events on a typical trial described to them in detail. The search task was defined as primary in that (1) after each trial subjects were told their reaction time and accuracy in the search task, but not in the tone task, (2) the search task occurred reliably on every trial, while the tone task occurred randomly on half of the trials, and (3) subjects were told that the search task was the more important of the two, and that they should concentrate on it, responding as quickly and accurately as possible. They were told to respond quickly in the tone task as well, but speed was not strongly emphasized as it was in the search task. The subjects were told to respond to the tasks as independently as possible, and in particular, to avoid response-grouping strategies such as responding to the two tasks simultaneously on each trial. Each subject completed four l-h sessions on successive days. No more than 2 days
450
LOGAN
elapsed between consecutive sessions. After the first session, the instructions were reviewed briefly during the dark-adaptation period to insure that the subjects still remembered them. Data Analysis Each day, each subject completed four concurrent-task trials at each combination of array size and SOA. The mean reaction time in each combination was computed for each subject for both the search task and the tone task. Each day, each subject completed 24 single-task trials at each array size in the search task, and mean reaction times were computed there as well. The first session was considered practice, and only data from the last three sessions were analyzed. Since previous studies with the same stimuli had shown that most of the improvement with practice occurred between the first and second sessions, each subject's data were averaged over the last three sessions, and these scores were submitted to analysis of variance.
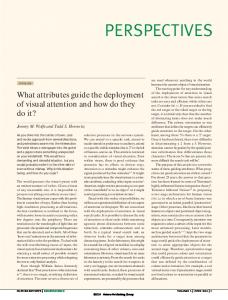
RESULTS The Tone Task Mean reaction times across subjects and days are displayed in Figure 2. Each point in the figure is based on 144 observations. Panel A presents the data plotted conventionally as a function of the time at which the tone was presented (SOA), whereas Panel B represents the same data plotted as a function of the time at which the response to the tone occurred. The two plots are presented because each misrepresents the temporal relation between maximal interference and the onset of the array. Panel A suggests that maximal interference occurred before the onset of the array; Panel B suggests it occurred around the termination of the array, about the same time as a response occurred in the search task (vertical lines). This ambiguity arises because the measure of interference is itself an interval of time, extending from the onset of the tone to the completion of the buttonpress response. Interference cannot be represented as a point on the SOA axis because it itself extends along the SOA axis. Thus, corresponding points in the two plots represent the ends of intervals during which the tone task was subject to interference. It is clear from the two plots that the tone responses showing maximal interference overlapped in time with the B
A
u8DO
~
S ~600 ,::
o
200
.
,
.
-400 -200
I
0
,array
200
.
400
I
600
Stimulus Onset Asynchrony (rnsec)
,
f\ ~T'''~
....
c
.~400
a:
"~;;:: ~
..-. 1-..
1'-,
.I 0
~
array
200
400
600
800
Response Time (rnsec}
Figure 2. Mean reaction time in the tone task as a function of stimulus onset asynchrony (panel A) and the time at which the response to the tone occurred (panel B). (Array size is the parameter; solid lines = 4-letter arrays; broken lines = 8-letter arrays; dotted lines = 12-1etter arrays. The vertical lines in Panel B represent mean search reaction times, across SOA, for trials on which the tone was presented.)
responses to the array. Responses to tones presented 200 msec before the array fmished some 400 msec after the array began. Even with no interference, the fastest possible response to these tones (estimated from the fastest observed reaction time) would have finished some 120 msec after the array began. In either case, there is sufficient temporal overlap in the responses to the tasks to have produced dual-task interference; one can feel confident that tone-task interference resulted from processing the array. The temporal relation between secondary-task interference and primary-task events has not been ambiguous in previous studies because the intervals between primary-task events have been large relative to secondary-task reaction times (e.g., Posner & Boies, 1971). Thus, either plot would lead to the same conclusions. Inspecting Panel A, it is clear that performance was strongly influenced by SOA [F(5 ,55) =30.131, p < .001] . Reaction time increased from the -400-msec SOA to the -200-msec SOA, reached a peak between SOAs of -200 and 0 msec, and declined thereafter. The contours for each array size differed systematically from each other, as indicated by the significant effect of array size [F(2,22) = 14.214, P < .001] and its interaction with SOA [F(IO,IlO) = 5.242, P < .001]. The contours for each array size rose together and reached a peak at the same height (maximum reaction times were 607, 595, and 609 msec for 4-, 8-, and 12-1etter arrays, respectively), but declined separately such that the breadth of contour increased with array size. This suggests that the amount of attention demanded by the search task was independent of array size, but the duration of attention demand was not. It tended to increase with array size. Errors were relatively rare in the tone task (mean proportion = .021), and virtually all of them were misses. The proportion of errors for each array size and SOA appear in Table 2. The Search Task Mean reaction times from concurrent-task trials are plotted as a function of SOA in Figure 3. Each point on the function for each array size is based on 144 observations. Single points to the right of the functions represent mean reaction times from no-tone trials. Each of these points is based on 864 observations. Performance in the search task was strongly affected by array size [F(2,22) = 60.289, p < .001]. Reaction times increased monotonically with array size at each SOA, and in the no-tone trials. However, SOA and the interaction between SOA and array size also had significant effects [F(5,55) = 7.292, p < .001, and F(10,110) = 2.937, p < .003, respectively]. This is disturbing, since the interpretation of secondary-task data is clearest when the secondary task has no effect on primary-task performance (Kantowitz, 1974). But
ATTENTION DEMANDS OF SEARCH
451
Table 2 The Proportion of Errors in the Tone Task, the Interresponse Intervals in Milliseconds, and the Proportion of Errors in the Search Task, Each as a Function of SOA and Array Size Stimulus Onset Asynchrony
Array Size
-400
-200
0
200
400
600
Errors (Tone Task)
4 8 12
.007 .007 .000
.007 .014 .007
.014 .007 .014
.007 .035 .035
.035 .063 .028
.021 .042 .035
Interresponse Interval
4 8 12
-488 -544 -619
-163 -287 -364
- 27 - 81 -110
90 35 13
223 167 128
476 338 322
Errors (Search Task)
4 8 12
.104 .083 .167
.049 .076 .188
.021 .104 .146
.014 .063 .118
.049 .049 .118
.049 .035 .076
Measure
since the SOA effects on search performance were neither large nor regular enough to yield a consistent interpretation, it may be most reasonable to regard them as noise. This interpretation is supported somewhat by the overall similarity of performance on tone and no-tone trials. For tone trials, the mean reaction times (across SOA) for 4-, 8-, and l2-letter arrays were 532, 627, and 701 msec, respectively. The corresponding means from no-tone trials were 524, 626, and 718 msec. At no SOA was the array-size effect larger than the one observed on no-tone trials. Thus, there is no evidence that performing the tone task while searching increased search reaction time relative to no-tone trials by an amount proportional to array size. The proportion of errors for tone trials in the search task appear in Table 2, representing each combination of array size and SOA conditions. The proportion of errors for no-tone search trials was .057, .056, and .119 for 4-, 8-, and l2-letter arrays, respectively. Tone and Search Tasks Together Subjects were instructed to perform the two tasks independently, and if they could not, to protect the primary search task so that the ensuing interference u
~
5
800