This article was originally published in a journal published by Elsevier, and the attached copy is provided by Elsevier for the author’s benefit and for the benefit of the author’s institution, for non-commercial research and educational use including without limitation use in instruction at your institution, sending it to specific colleagues that you know, and providing a copy to your institution’s administrator. All other uses, reproduction and distribution, including without limitation commercial reprints, selling or licensing copies or access, or posting on open internet sites, your personal or institution’s website or repository, are prohibited. For exceptions, permission may be sought for such use through Elsevier’s permissions site at: http://www.elsevier.com/locate/permissionusematerial
Decision Support Systems 43 (2007) 269 – 283 www.elsevier.com/locate/dss
py
Attention-shaping tools, expertise, and perceived control in IT project risk assessment a
co
Stephen Du a,1 , Mark Keil a,1 , Lars Mathiassen a,1 , Yide Shen a,⁎,1 , Amrit Tiwana b,1 Department of Computer Information Systems, J. Mack Robinson College of Business, Georgia State University, Atlanta, GA 30302-4015, United States b College of Business, Iowa State University, United States
on
al
Received 1 December 2005; received in revised form 5 September 2006; accepted 8 October 2006 Available online 21 November 2006
Abstract
pe
rs
This study investigates the use of attention-shaping tools and their interactions with expertise and perceptions of control on individual decision-making about risks in IT projects. The paper uses data collected from 118 IT project experts and 140 novices through a role-playing experiment to provide several novel insights into how these three factors independently and collectively influence perception of risks and subsequent project continuation decisions. First, attention-shaping tools have a significant effect on both risk perception and decision-making. However, among individuals with low expertise, risk shaping tools exhibit a significant but dual-sided effect on risk perception. They help identify risks captured by the attention-shaping tool but simultaneously introduce blind spots in their risk awareness. Second, while individuals with greater expertise perceive significantly higher levels of risks relative to those with lower expertise, the level of expertise had generally no influence on decision-making. Third, we found that perceived control is a powerful factor influencing both risk perception and decision-making. Implications for research and practice are discussed along with potential avenues for future research. © 2006 Elsevier B.V. All rights reserved.
th o
1. Introduction
r's
Keywords: IT project risk assessment; Decision-making; Attention-shaping tools; Software expertise; Perceived control; Project management
Au
High failure rates among IT projects have been the subject of numerous industry surveys and reports. The frequency of failure is still high at 23%, and the frequency of “challenged” projects is also high at 49% [38]. There are many reasons why IT projects fail. In a multinational study, Schmidt et al. [34] identified fiftythree risk factors that can contribute to IT project failure. ⁎ Corresponding author. E-mail addresses:
[email protected] (S. Du),
[email protected] (M. Keil),
[email protected] (L. Mathiassen),
[email protected] (Y. Shen),
[email protected] (A. Tiwana). 1 All authors contributed equally to this effort. 0167-9236/$ - see front matter © 2006 Elsevier B.V. All rights reserved. doi:10.1016/j.dss.2006.10.002
While this large number of risk factors provides good reasons for the many project failures, it is important to remember that “only risk that is underappreciated and unmanaged has the power to surprise” [39]. Project-level risk assessment is a key discipline that helps project managers identify what aspects of a project warrant close attention and supports them in making decisions about whether and how to continue [3–5]. Prior research has suggested that risk assessment tools will be useful to organizations because they allow managers to more effectively assess and manage risks associated with IS development [3]. The assumption is that risk assessment tools will provide managers with more accurate perceptions of risk, thereby allowing them to
S. Du et al. / Decision Support Systems 43 (2007) 269–283
al
co
py
analysis (determining the probability of each risk factor and the associated loss), and risk prioritization (ranking the identified risks according to their compound impact to support subsequent decision-making about whether to continue the project) [4]. Research has been done for each of the three activities. To help IT project managers avoid overlooking risks during risk identification, researchers have produced a set of checklists by synthesizing the literature or conducting empirical investigations [3,5,29]. Research has also suggested other methods that facilitate risk identification such as scenarios, brainstorming, and examination of past or similar situations [2]. General risk literature and IT risk literature has addressed risk analysis issues by employing quantitative methodologies such as Probabilistic Risk Assessment [24], Livermore Risk Analysis Methodology [10], and Stochastic Dominance [31]. Rainer et al. [32] proposed a risk analysis process, which employs a combination of qualitative and quantitative methodologies, to assess an organization's overall IT risk posture. In the IT project area, Barki et al. [3] were the first to develop an instrument to quantitatively measure development risks. Wallace et al. [40] identified six dimensions of IT project risk and developed reliable and valid measures for each. Ngai and Wat [30] developed a prototype risk assessment system that used fuzzy set theory to combine multiple subjective evaluations into an aggregate assessment of risk for IT projects. Risk assessment is also addressed by other more general risk management approaches, such as risk lists, risk-action lists, risk-strategy models, and risk-strategy analysis [14]. For example, Tiwana and Keil [39] developed a risk assessment tool for IT projects by combining weighted measures of risk in six project categories.2 Despite the significant attention placed on risk assessment to support decision-making in IT projects and the huge variety of methods and tools proposed for conducting risk assessment, little is known about how different conditions impact IT risk assessment practices. Based on the IT literature and other reference disciplines, we focus on three particular conditions that have attracted attention and where we found no
th o
r's
pe
rs
make better informed decisions and ensuring more successful outcomes [26]. However, little is known about how individuals assess risk in IT projects and how different conditions impact their perception and decisionmaking. The purpose of this study is therefore to investigate empirically how specific conditions impact IT risk perception and subsequent decisions on whether to continue an IT project. Specifically, we focus on three conditions that have attracted particular attention in the IT literature and other reference disciplines: use of an attention-shaping tool [9,10,23]; degree of expertise [1,20,31]; and, perceived control over the project [16,25,35]. The study is based on a role-playing experiment including 118 practitioners with high expertise in IT projects and 140 university students with low expertise. Each subject was asked to play the role of project manager, assess the risks involved in their project, and make a decision on how to continue. Results from the experiment provide valuable insights into IT project risk assessment practices. First, aggregated across all subjects the tool had significant impact on risk perception and decision-making. For individuals with low expertise, however, the tool helped them identify risks captured by the tool, but it also made them overlook risks not captured by the tool, hence creating blind spots in their awareness. While individuals with more expertise perceived significantly higher levels of risks as compared to those with more limited expertise, level of expertise had no impact on decision-making. Finally, perceived control turned out to be a powerful factor influencing both risk perception and decision-making. The remainder of the paper is organized as follows. Section 2 provides a review of the literature and Section 3 develops hypotheses for testing. Section 4 describes the research methodology employed to conduct the experiment. Section 5 presents the findings and results from our data analysis. The paper concludes by discussing the findings, the limitations of the study, and the implications for both research and practice.
on
270
Au
2. Literature review
Among the various approaches for reducing IT project failures, risk management has gained enormous attention [4,34]. There are two major phases for IT project risk management: assessing risks and taking actions to control the risks [4]. Risk assessment – our focus here – is of considerable importance because no appropriate actions can be taken to mitigate risks without first identifying and evaluating them. Risk assessment consists of three major activities: risk identification (identifying the risk factors), risk
2 Following a conjoint study approach which investigated the relative importance ascribed to six different risks that can affect IT projects, they produced a tool that can be used to calculate an overall risk score for specific projects by combining weighted measures of the six risks. It should be noted that risk assessment has also been addressed by other more general risk management approaches, such as risk-action lists, risk-strategy models and risk-strategy analysis [14].
S. Du et al. / Decision Support Systems 43 (2007) 269–283
empirical studies investigating the impact of these conditions on assessment practices.
Au
th o
r's
co
al
on
pe
rs
A first important condition is the use of risk assessment tools and the possible ways in which they contribute to shaping the user's attention to specific risk items [9,10,23]. A conceptual analysis in the literature suggests that different assessment tools will contribute to shaping managerial attention in different ways [18]. But no research has empirically investigated the influence of software-based risk assessment tools in shaping individual risk perception and decision-making. On a general level, it has long been known that managers' attention to details of a situation is selective [8]. From an organizational perspective, framing a situation relative to a chosen reference point will also shape managers' perception and decision-making [9]. Individual attention to risks can be influenced by values [12], unmodeled information [16], and high consequence alternatives [23]. This suggests that astute managers should choose risk assessment tools with care and preferably based on insights into how they impact outcomes. Managers may adopt tools already at their disposal as part of their organizational operational routines or from external sources such as industry journals and textbooks. Theoretical analysis of risk assessment tools suggests differences stemming from the way they contribute to shaping managers' attention [25]. When mapped against Leavitt's [22] socio-technical model of organizational change, several prominent risk management approaches were found to exhibit significant differences in the way they encourage managers to view risks and in the scope of techniques provided to resolve them [25]. Davis [7], for example, focuses on IT requirements specification and suggests emphasizing actor- and task-related risks and to resolve these through technological and structural interventions. In contrast, McFarlan [28] focuses more broadly on IT projects and suggests emphasizing actor-, technology-, and task-related risks and to resolve these through structural interventions.
analysts were found to have higher ability to identify relevant triggers compared to novice analysts [31]. No known study, however, has examined the differences between novices and experts in the context of IT project risk assessment. Research in a wide variety of disciplines has established differences between novices and experts, in terms of their cognitive skills, practices, and the nature and structure of their knowledge [1,21]. For example, the literature indicates that novices have limited amounts of episodic knowledge (the collection of specific jobrelevant events or situations) [20] and procedural knowledge (the knowledge about “how to” perform an activity) [6], they have superficial and sparse knowledge structures [2,15], and their ability to identify triggers (i.e., clues) relevant to a problem setting is limited [31]. Differences between novices and experts are also well established within the IT literature. Though we know of no prior research that has investigated expertise in the context of software project risk assessment, several studies have examined differences with respect to software project teams and systems analysis tasks. Walz et al. [41] found that project team members with broad experience performed better than members with limited experience. Schenk et al. [33] compared the differences between novice and expert system analysts during requirements analysis and found differences both in problem understanding and problem-solving behaviors. Marakas and Elam [26] found that more senior analysts regularly incorporate previously developed techniques into their information gathering activities while the more junior analysts “may spend as much or more time in attempting to “discover” or develop their own style of inquiry than in actually gathering the information necessary to complete the requirements specification” (p.57). The established differences between novices and experts across a variety of domains suggest that individuals would assess risks differently depending on their level of IT project expertise. Novices may have difficulty knowing “how to” (i.e., more limited procedural knowledge) perform risk assessments due to their limited episodic knowledge. As a consequence, novices are more likely to rely on “weak methods” [6] learned from books or acquired from other jobs or life situations. Similarly, since novices' knowledge structure is relatively sparse as compared to experts', it might constrain novices' ability to identify triggers relevant to project risks.
py
2.1. Attention-shaping tools
271
2.2. IT project expertise
A second important condition is the degree of expertise of the individual conducting the risk assessment [1,20,31]. Research in a wide variety of disciplines, including medicine and software engineering, has established differences between novice and expert perception and behavior [1,21]. During IT project requirements determination, for example, expert systems
2.3. Perceived control A third important condition is the individual's perceived control over the project [16,25,35]. The risk
S. Du et al. / Decision Support Systems 43 (2007) 269–283
co
py
hand, if the expected benefits are large enough, a manager may be willing to pursue an opportunity with some degree of uncertainty. While there are many different factors that can affect risk perception and decision-making, the literature suggests that the following three conditions may be especially important in IT projects: risk assessment tools, expertise, and perceived control. These considerations lead to the research model in Fig. 1. To examine the three conditions and their effect on risk assessment and continuation decisions in IT projects, this study considered three research questions.
al
1. What is the influence of a risk assessment tool on risk perception and decision-making? 2. What is the influence of expertise on risk perception and decision-making? 3. What is the influence of perceived control on risk perception and decision-making? Risk assessment tools are designed to enhance risk management by identifying potential sources of risk and evaluating them. More importantly, they aid managerial information processing by helping integrate a variety of information about a project into aggregate factors that managers can more readily use for comparisons across projects. We posit that having such tools can improve the comprehensiveness of risk assessment and increase the decision-maker's sensitivity to risk. Thus, the increased awareness of risks should both lead to an increase in perception that the project is likely to fail and result in more risk averse decision-making. This leads to the following hypotheses:
th o
r's
pe
rs
literature suggests that when a risk has the potential to negatively impact project success, a sense of control can increase the expectation that risks can be avoided [17]. As firms increasingly pursue selective outsourcing of IT projects where there is inherently less perceived control, it becomes especially important to understand how managers cognitively assess risk based on their perceptions of project control. However, little is known about how the degree of perceived control over an IT project impacts risk perception and decision-making. There are many different forms of control available to managers such as formal project management techniques or informal team interactions [19]. IT project members can be subject to direct control through reporting relationships or influenced by indirect controls such as financial incentives. Such organizational controls depend on motivational effects and communication structures. Other forms of control rely on gaining access to key knowledge that can help in making design decisions or choosing among alternative technologies. The importance of management control to implementation success has been empirically demonstrated [11]. Managerial control is especially important in the context of IT project risks. In the IT literature, a study involving over forty experienced project managers in three different continents suggested that project risks identified as the most important were often considered to be the least controllable [17]. In the general risk literature, a strong correlation between personal risk assessment and perceived control has been observed [36]. In financial markets, intermediaries such as brokers and clearing agents are viewed as control mechanisms that decrease risk by limiting transaction failure [42]. Also, a perception of control in risky situations is generally important because managers modify their estimate of outcome likelihood if they sense they can take action to mitigate the impact of adverse events [27].
on
272
3. Conceptual development
Au
Risk perception is the belief that there exist sources of risk with potential to adversely affect project outcomes. Risk perception at the project level may reflect both the likelihood of various risks occurring and the extent to which they could materially impact project outcomes. Associated decision-making is the managerial choice of whether or not to continue with a project including what investments in time and resources are needed. For example, if the likelihood of failure is significant and the expected cost of failure is high, then a project manager may not be willing to accept such a risk. On the other
H1a. Use of a risk assessment tool will result in a heightened level of risk perception. H1b. Use of a risk assessment tool will result in more risk averse decision-making. Further, because of the intangible and complex nature of software and the multi-dimensional and dynamic nature of IT projects, experts may have more ability to identify and make sense of clues relevant to project risks than novices. Experts have broader and better structured knowledge about IT project risks, and
Fig. 1. Research model.
S. Du et al. / Decision Support Systems 43 (2007) 269–283
4.1. Risk assessment tool
they are able to link previous risk assessment experiences with the current situation. Novices, in contrast, will find it more difficult to identify relevant clues and make sense of how a project might be impacted. This leads to the following hypotheses:
al
pe
4. Research methodology
th o
r's
A role-playing laboratory experiment with a 2 × 2 × 2 factorial design was used to test the proposed hypotheses. Two subject pools consisting of novices and experts were recruited for the study. Subjects from each pool were randomly assigned to one of four treatment groups (with tool/high control, without tool/high control, with tool/low control, and without tool/low control). The participants first read a short IT project scenario with multiple embedded risks, and were asked to take the role of project manager. A “Risk Analyzer” software tool developed by Tiwana and Keil [39] was adopted for this study to provide support to subjects in the “with tool” treatment condition. The other treatment condition – control – was operationalized by contrasting internal (high control) versus outsourced (low control) project scenarios. In the final step of the experimental procedure, subjects completed a set of questions which included a manipulation check, dependent variable measures, and demographic questions. The two dependent variables were operationalized by asking participants to evaluate the current status of the project (risk perception) and indicate their willingness to continue the project (risk related decision-making behavior).
Au
on
rs
H3b. A low degree of perceived control will result in more risk averse decision-making.
co
H2b. A higher level of expertise will result in more risk averse decision-making.
H3a. A low degree of perceived control will result in a heightened level of risk perception.
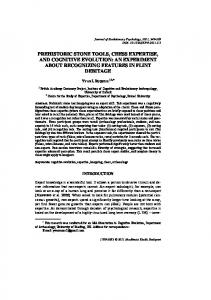
The risk assessment tool was implemented as an interactive spreadsheet that calculates a risk score by combining weighted measures of risk in six project categories (Fig. 2); the weights were derived from Tiwana and Keil [39].3 The six risks included in the tool are listed in Table 1. The respondent interactively uses the tool to assess the overall risk score of a project. Based on the respondent's interpretation of the project description, the respondent assesses each of the six risks on a scale of 1 to 10. The tool then uses the weights from Tiwana and Keil's [39] empirical study to automatically compute a holistic project-level risk score based on the respondent's ratings of each of the six risks. The tool also color codes the project risk score as red, yellow, or green based on whether the overall risk score is classified as high, medium, or low relative to the highest possible score of 100 and the lowest possible score of 10. The risk assessment tool used in this study is therefore representative of the typical decision support system that integrates project-specific information from a user into a holistic, integrated assessment that can be used to guide individual decision-making about a specific project.
py
H2a. A higher level of expertise will result in a heightened level of risk perception.
Perceived control provides project managers with a sense that they can influence people and events in ways that mitigate risks. In this study, we operationalize perceived control by manipulating whether a given project is internal or is outsourced to an offshore vendor. When control is lacking, a manager may be concerned that risks will proceed unchecked and potentially do greater harm. This concern is expected to affect risk perception and decision-making. Thus,
273
4.2. Instrument development The instrument was pre-tested and refined during the course of three pilot tests before conducting the main study. Two versions of a hypothetical business scenario were developed that asked the participant to assume the role of project manager in the IT department of a retail company that was in the middle of a development project. The scenario was written using language that did not include any technical terminology. Since the target population was college level and higher, participants were expected to understand basic business and project concepts. The scenario was embedded with information on the six 3
The tool was adapted to meet the needs of this research study. First, functionality was added to the tool to prevent participants from entering invalid data. Valid data for the risk analyzer tool was defined as numeric values ranging from 0 to 10. Second, the tool was programmed to provide participants with positive visual feedback during correct usage. When participants first viewed the risk analyzer tool without entering any value, no risk score was displayed. After entering at least one valid risk item value, a corresponding risk score would be displayed. Subsequently, as additional risk item values were entered or existing values were changed, the risk score would immediately change to reflect an appropriate corresponding aggregate risk score. These two modifications were intended to minimize the incidence of invalid risk scores.
S. Du et al. / Decision Support Systems 43 (2007) 269–283
rs
on
al
co
py
274
pe
Fig. 2. Risk assessment tool.
th o
r's
risks captured by the risk assessment tool. Overall, the scenario was designed to result in a moderate to high level of risk as measured by the risk assessment tool. Two versions of the scenario were designed to operationalize different levels of managerial control. The two scenario versions differed in the following key phrases:
Au
4.2.1. Outsourced IT project … Three months ago, your company hired a firm in Beijing, China to develop software … All project team members are located in China and none of them report to you or anyone else in your company … Table 1 Risks captured by risk assessment tool
4.2.2. Internal IT project … Three months ago, your company started an internal software development project … All project team members are located in the headquarters in Atlanta and report directly to you … The “outsourced” version of the scenario operationalized a low degree of management control, and the “internal” version characterized a high degree of control. The complete “outsourced” version of the scenario is provided in Appendix A. 4.3. Scale development The scales used to measure the constructs in this study were adapted from previously validated instruments provided in the literature [18,35] (Appendix B).
Risks Appropriateness of the chosen methodology for this project Extent of customer involvement Use of formal project management practices Similarity to prior projects Project complexity Project requirements volatility
4.3.1. Independent variables 4.3.1.1. Risk assessment tool. For this condition, either the risk assessment tool was used by the subjects or it was not. When the tool was present, subjects were asked to use it to obtain a risk score, and to refer to the risk score when
S. Du et al. / Decision Support Systems 43 (2007) 269–283
participated in the first pilot test and were asked to provide feedback regarding the instrument. Their feedback was used to refine the experimental materials.4 Thirteen students randomly selected from the university campus participated in the second pilot test. Their comments were used to further refine the materials.5 A different set of eleven students were used for the third iteration of this refinement process. Based on their feedback, no further modification was made to the instrument.
completing their questionnaire. When the risk assessment tool was not used, neither it nor the risk score it provides were mentioned in any of the materials provided.
py
4.3.1.2. Expertise. Expertise was manipulated by selecting subjects from two different populations, one whose members have extensive experience with IT projects, and the other characterized as novices.
co
4.3.1.3. Control. The degree of perceived control was manipulated by framing the project as internal (high control) or outsourced (low control).
4.5. Data collection
4.3.3. Control variable
r's
on
pe
rs
4.3.2.2. Decision-making. The decision about whether or not to continue the project was measured by three, 8point, semantic-differential items adapted from Keil et al. [18]. For example, the scale to indicate likelihood that the subject would recommend continuation or discontinuation of the project was anchored at each end with “Definitely lean towards discontinuing” and “Definitely lean towards continuing”.
Two subject pools were recruited to obtain different levels of expertise. The novice subject pool was drawn from a university student population at a large public university in the southeastern United States. The international reputation and flexible structure of programs at the university attract students with diverse cultural backgrounds and various levels of business experience. 140 participants were recruited from the general student population at several campus locations near facilities with computers that participants could use to access the risk assessment tool. This subject pool was expected to have minimal knowledge of systems development and thus could be considered novices with respect to IT projects. The expert subject pool was drawn from a leading wireless communications corporation. A contact within the company was enlisted to solicit participants from this population. The contact was provided with text that described the experiment and information about how to participate. The contact then sent an email with this text to all members of her department, inviting them to
al
4.3.2. Dependent variables 4.3.2.1. Risk perception. Risk Perception was measured using a four-item scale adapted from Sitkin and Weingart [35]. For example, in response to the question, “how would you characterize the current status of this project?” subjects were asked to choose from a 7-point Likert scale anchored at each end with “Significant threat” and “Significant opportunity”.
275
Au
th o
4.3.3.1. Risk propensity. Because prior research has shown a relationship between risk propensity and risk perception, we controlled for individual risk propensity. This variable was measured using a five-item scale adapted from Sitkin and Weingart [35]. For example, in response to the question, “your tendency to choose risky alternatives based on the assessment of others on whom you must rely?” subjects were asked to choose from a 7point Likert scale anchored with “Extremely LESS likely than others” on one end and “Extremely MORE likely than others” on the other end. 4.4. Pilot tests Three pilot tests were conducted to refine both the scenario and the questionnaire items before the research instrument was administered to the target populations. Twelve graduate students (Masters or PhD level)
4
Specifically, the scenario was modified to make the business purpose more explicit; the source of Risk Analyzer was added into the instrument, in order to increase the credibility of the tool; and validation functions were added in the Risk Analyzer spreadsheet to reduce the chance that subjects would input invalid information. The data analysis results also showed that several constructs' internal reliability were not high enough (with Cronbach's alpha value lower than 0.6). In order to improve internal reliability, several questions were reworded and reformatted to improve readability and understandability. 5 Because the subjects would be sampled from general university students, who may not have experience with IT projects, the risk items embedded in the scenario were adjusted to be more explicit. The manipulation for control levels (internal versus outsourced project) was also emphasized using highlighted key words relevant to the nature of the project. Last, the project objective described in the scenario was specified as developing an inventory management system, in order to make it easier for non-IS major subjects to understand. For the same purpose, the technical term “.NET architecture” was eliminated.
S. Du et al. / Decision Support Systems 43 (2007) 269–283
Table 2 Sample demographics Novice
Expert
Age Under 20 20–30 31–40 Above 40
12.9% 71.9% 9.4% 5.8%
0.0% 19.1% 41.6% 39.3%
Education High school Bachelor's Master's Doctoral
43.2% 32.4% 23.0% 1.4%
7.9% 31.5% 57.3% 3.4%
Work experience Minimum Maximum Mean SD
0 34 3.4 5.0
3 43 12.6 7.7
project condition were expected to report a higher perception of control over the project than subjects in the outsourced project scenario condition. ANOVA results indicated that perceived control differed between the two conditions at a statistically significant level (F = 44.5, p b 0.001). Thus, the manipulation of perceived control was deemed successful.
py
276
5.1. Reliability tests
co
al
on
5.2. Hypothesis testing
5. Results
th o
r's
pe
rs
participate in the study. Two reminder emails were sent at one week intervals to maximize the response rate. 118 respondents participated in the study. These individuals were engaged in various IT projects and could be considered experts based on their extensive prior experience (see Table 2). All 258 subjects were randomly assigned to one of four treatment groups representing all combinations of the two experimental manipulations for use of the risk assessment tool (with and without) and perceived control (internal and outsourced scenarios). Participants received instructions that described their task and the required steps. If their treatment was one of the two that involved using the risk assessment tool, then additional instructions were provided on how to access the tool. Actual time to complete the task ranged from 15 to 30 min.
Table 3 shows internal reliability results for the measures used to assess the dependent variables (risk perception and continuation decision) and control variable (risk propensity). Reliability of each multiitem scale was assessed by calculating Cronbach's alpha. Since Cronbach's alpha values for both dependent variables were well above the minimum standard of 0.70, they provide evidence of high internal reliability [37]. Cronbach's alpha value for the control variable was lower than those of dependent variables, but still close to the threshold of 0.7.
Au
A summary of subject demographic characteristics for participants is presented in Table 2. The profiles for novices and experts are consistent with expected differences between the two subject pools. In particular, the reported values for number of years of full-time work experience reflect the difference in expertise: novices averaged 3.4 years and experts averaged 12.6 years. Validity of the instrumentation was confirmed using manipulation checks and reliability testing. The manipulation of perceived control was assessed using a single item measure that asked respondents whether the situation depicted in the scenario allowed a high degree of control over the project. Subjects in the internal
Multivariate analysis of covariance (MANCOVA) was employed to evaluate relationships between treatment manipulations and the two dependent variables — risk perception and decision-making, including risk propensity as a covariate. Because the dependent variables were related, it was appropriate to determine statistical significance of effects using a combined linear model [13]. Since their correlation (0.59) was not high, there would be little loss of power due to multicollinearity. For this experimental design, MANCOVA was also preferred to univariate analysis of variance to reduce the risk of Type I error. The covariate (risk propensity) included in the test meets the assumption that it is highly correlated with the dependent variables ( p b 0.01 for both DVs) but not correlated with the independent variables ( p N 0.1 for all three IVs). The homogeneity of regression effect assumption for MANCOVA is met in all conditions except one; risk propensity has an unequal effect ( p = 0.012) on decisionTable 3 Internal reliability of constructs Construct
Risk perception Continuation decision Risk propensity
Number of items
4 3 5
Cronbach alpha Novice
Expert
0.872 0.830 0.691
0.901 0.829 0.592
S. Du et al. / Decision Support Systems 43 (2007) 269–283 Table 4 Sample sizes Risk analysis tool
Internal
Outsourced
Novice
Expert
Novice
Expert
34 23
19 19
34 37
26 25
al
co
potheses 3a and 3b were both supported by the data. The observed effect of perceived control on risk assessment and decision-making behavior is the first empirical evidence of such relationships in the context of IT projects. A summary of the hypothesis testing is presented in Table 6. Since one of our six hypotheses was not supported (H2b), we examined statistical power for this test. The results showed that the power level (0.152 for the test) was not sufficiently high to safely conclude that there is no effect. One possible reason for this low power is that the effect size for the hypothesized relationships is small. Larger sample sizes would be required to reliably detect such effects. Future studies with greater statistical power will be needed to further investigate the effects predicted in Hypothesis 2b. While the MANCOVA results only marginally support the expected effects of the risk assessment tool on risk perception, a closer examination of the data suggests that the tool did have some interesting impacts. Table 7 presents mean values of risk perception for each of the treatment groups. Significant relationships identified in MANCOVA can be confirmed such as the finding that experts perceive more risk than novices. In each of the four combinations of treatment conditions, the mean level of perceived risk for experts is significantly higher than that for novices. When considering the influence of perceived control on risk perception, one treatment condition does not exhibit the relationship that was found using MANCOVA. Novices who assessed risk with support from the risk assessment tool showed very little difference in perceived risk between the internal and outsourced project scenarios (4.1 versus 4.0). Interestingly, novices who assessed risk without support from the tool exhibited lower perceived control with higher perceived risk. One possible explanation for this pattern is that the categories of risk that were embedded in the risk assessment tool did not include project control (see Table 1), which is the distinguishing risk factor between the internal and outsourced project scenarios. Since novices possess more limited domain knowledge of the relevant risk factors than experts, they may have a tendency to rely on guidance provided by the tool to construct their
on
pe
r's
th o
Au
6 Because the homogeneity of regression effect assumption is not maintained for this condition, the covariate (risk propensity) is a potential confound in the analysis. We can not rule out the possibility that the effect of risk propensity interfered with our ability to assess the relationship between expertise and decision-making behavior.
Perceived control
py
With Without
rs
making between groups with different expertise. Therefore, readers are cautioned when interpreting results for this combination of conditions.6 Table 4 shows the number of subjects in each treatment condition. Because MANCOVA performs a simultaneous test of all variables in the model, cases with missing items are excluded. Results of the MANCOVA analysis are presented in Table 5. All statistical tests used one-tailed analysis. Before considering main effects, the MANCOVA results were examined for evidence of interaction effects among the three independent variables. None were statistically significant, allowing us to focus on the main effects. The first pair of hypotheses predicted that participants who used the risk assessment tool would perceive higher levels of risk and exhibit more risk averse decisionmaking when compared to participants who did not use the tool. The effect was significant for decision-making at the 0.05 level ( p = 0.032), and significant for risk perception at the 0.1 level ( p = 0.09). Thus, both Hypotheses 1a and 1b were supported by the empirical data. However, the effect of the risk assessment tool on risk perception and decision-making behavior was small (explaining less than 1% and 2% of the variance in decision-making, respectively). Further, a subgroup analysis revealed that the effect of the risk assessment tool on decision-making behavior was significant for novices, but not for experts. The second pair of hypotheses predicted that experts would perceive higher levels of risk and exhibit more risk averse decision-making when compared to novices. This effect was significant for risk perception ( p b 0.01), but not significant for decision-making ( p N 0.1). Thus, Hypothesis 2a was supported by the empirical data, but Hypothesis 2b was not supported. Therefore, the expected influence of expertise was only partially confirmed by the evidence. Experts perceived significantly higher levels of risk than novices, but their decisionmaking behavior was not significantly different. The third pair of hypotheses predicted that conditions with a low degree of perceived control would be associated with higher levels of risk perception and exhibit more risk averse decision-making when compared to conditions with a high degree of perceived control. Both of these effects were significant ( p b 0.01). Thus, Hy-
277
278
S. Du et al. / Decision Support Systems 43 (2007) 269–283
Table 5 Tests of between-subjects effects DV
Type III squares
Mean square
F
Sig.(d)
Partial η2
Observed power(a)
Corrected model
RPC CTN RPC CTN RPC CTN RPC CTN RPC CTN RPC CTN RPC CTN RPC CTN RPC CTN RPC CTN RPC CTN RPC CTN RPC CTN
96.343(b) 48.607(c) 69.153 172.728 21.638 22.658 15.165 20.405 2.498 7.265 59.616 1.788 1.289 .028 .497 .073 1.591 .881 .419 1.684 276.482 431.640 3319.063 5896.917 372.825 480.247
12.043 6.076 69.153 172.728 21.638 22.658 15.165 20.405 2.498 7.265 59.616 1.788 1.289 .028 .497 .073 1.591 .881 .419 1.684 1.329 2.075
9.060 2.928 52.024 83.235 16.279 10.918 11.408 9.833 1.879 3.501 44.850 .862 .970 .013 .374 .035 1.197 .424 .316 .812
0.000 0.002 0.000 0.000 0.000 0.001 0.001 0.001 0.086 0.032 0.000 0.177 0.163 0.454 0.271 0.426 0.138 0.258 0.288 0.185
.258 .101 .200 .286 .073 .050 .052 .045 .009 .017 .177 .004 .005 .000 .002 .000 .006 .002 .002 .004
1.000 .975 1.000 1.000 .991 .950 .957 .931 .392 .587 1.000 .241 .258 .102 .162 .106 .293 .171 .153 .233
Control ⁎ Tool Control ⁎ Expertise Tool ⁎ Expertise Control ⁎ Tool ⁎ Expertise Error Total Corrected total
a. Computed using alpha = .05. b. R squared = .258 (adjusted R squared = .230). c. R squared = .101 (adjusted R squared = .067). d. All p values are for one-tailed analysis. RPC = Risk Perception; CTN = Continuation Decision.
th o
r's
perception of risk. Because the tool ignores project control, novices may have been unable to detect a significant difference in perceived risk between the internal and outsourced scenarios when using the tool. For novices who assessed risk in the high perceived control treatment condition (internal project scenario), use of the risk assessment tool was associated with a higher perceived level of risk compared to novices who did not use the tool (4.1 versus 4.6). This relationship strongly exhibits the effect that is predicted by Hypothesis 1a. Comparison of the mean values for these subgroups using MANCOVA indicates a statistically significant difference (F = 5.022, p = 0.015). None of the other treatment conditions show a similar relationship. A possible explanation for this observation is also related to the exclusion of project control in the categories of risk that were embedded in the risk assessment tool. In this case, since project control is not a risk factor in the internal (non-outsourced) project scenario, the tool had the expected effect of enhancing
Au
co
Expertise
al
Tool
on
Control
rs
Risk Propensity
pe
Intercept
py
Source
risk perception for novices in the internal project scenario. In the outsourced scenario, however, the tool was less relevant because it did not include a risk category for perceived control, which is a powerful risk factor. Therefore, use of the tool matters little in the
Table 6 Summary of results Hypothesis IV H1a H1b H2a H2b H3a H3b
Risk analysis tool
DV
Risk perception Continuation decision Expertise Risk perception Continuation decision Perceived Risk control perception Continuation decision
Result Conclusion s
Tool matters
s s ns s s
Expertise matters for risk perception but not continuation behavior Perceived control matters
S. Du et al. / Decision Support Systems 43 (2007) 269–283 Table 7 Risk perception: mean (SD)
With Without
Perceived control Internal
Outsourced
Novice
Expert
Novice
Expert
4.1 (1.2) 4.6 (1.1)
3.4 (1.2) 3.4 (1.3)
4.0 (1.4) 4.0 (1.0)
2.8 (1.1) 2.8 (1.3)
with a project and therefore make them less cautious than they might otherwise be. Regarding the influence of expertise, we found that individuals with more expertise perceived significantly higher levels of risks as compared to those with more limited expertise. Hypothesis 2a was thus supported. A closer examination of the data provides further support for this pattern. In each of the four combinations of treatment conditions, the mean level of perceived risk for experts is significantly higher than that for novices. This finding is consistent with Schenk et al.'s [33] observation that experts have more ability to identify clues relevant to a problem setting than novices. However, contrary to our prediction, the level of expertise had no impact on decision-making, thus Hypothesis 2b was not supported. One possible explanation may be lack of statistical power as discussed earlier. Another possible explanation is that experienced individuals are generally more willing to take risks for a given level of risk perception thus balancing out the impact their expertise had on risk perception. Finally, regarding the influence of perceived control, we found it to be a powerful factor influencing both risk perception and decision-making. Hypotheses 3a and 3b were hence confirmed. This confirms the suggested strong correlation between personal risk assessment and perceived control [36], and the observation that managers modify their estimate of outcome likelihood if they feel they can take action to alleviate the impact of adverse events [27].
py
Risk analysis tool
279
co
1 = high risk, 7 = low risk.
outsourced scenario. It appears that risk perceptions for experts were not influenced by use of the tool because they already possessed domain knowledge of the relevant risk factors.
Au
th o
r's
on
pe
rs
The purpose of this research is to shed light on IT project risk assessment practices, in particular how assessment tools, expertise, and perceived control influence risk perception and decision-making. Regarding the influence of the risk assessment tool across the entire pool of subjects, we found that the use of the tool significantly impacted decision-making, but had only a marginally significant impact on risk perception, (i.e., only Hypothesis 1a was supported at 0.1 level). (We used the p b 10% significance level to balance the risks of Type I and Type II error.) This finding of a marginally-significant relationship is surprising given the literature's emphasis of how risk tools contribute to shaping the attention of IT project managers [25]. Some possible explanations include: (1) the risks embedded in the scenario were readily apparent to the subjects without the aid of the risk assessment tool, and (2) the assessment tool adopted for the experiment offers a relatively simple conception of IT project risks [39]. Interestingly, in-depth post-hoc analysis summarized in Table 7 revealed that the attention-shaping tool did significantly impact risk perception for individuals with low expertise. For these individuals, the tool helped identify project risks captured by the tool, but it also made them overlook risks not captured by the tool, hence creating blind spots in their holistic project level risk assessments. Our study was predicated on the assumption that the exercise of going through a tool-guided risk assessment would produce greater sensitivity to risk and hence more cautious decision-making. While the evidence generally appeared to support this assumption, in principle one could imagine situations in which a risk assessment tool could make users more confident of the risks associated
al
6. Discussion
7. Limitations As with any other empirical study, our approach has certain limitations. The experimental method has been criticized for sacrificing external validity to achieve high internal validity. In order to increase the external validity, we used IT practitioners from industry and university students with business experience as subjects. Experience served as a proxy for expertise in our study. The participating practitioners (i.e., the experts) possessed considerable experience relating to IT projects (three years minimum and thirteen years on average), and the participating students (i.e., the novices) were from a university with a large fraction of part-time students who have some business experience (three years on average for our sample). However, we did not directly measure expertise, relying instead on experience as a proxy for expertise. Thus, one limitation of the study is that the students may not have had the domain expertise normally associated with a novice. Likewise, the practitioners may not have had the domain expertise
S. Du et al. / Decision Support Systems 43 (2007) 269–283
al
co
py
development projects: the use of an attention-shaping tool, the expertise of the individual conducting the assessment, and the perceived control over the IT project. First, the study clearly shows that decision support systems can and do affect decision-making in a software project context. As hypothesized, interacting with a risk assessment tool did make individuals more risk averse in their decision-making about whether to continue the project. This result has promising implications for both practice and research, for it suggests that putting the right tools in the hands of practitioners can make them less likely to continue a risky project. In this study, the effect of the tool on decision-making was small, which suggests that there are many other factors that influenced decision-making. For researchers, this suggests that there is a need to understand these other factors and to develop improved decision support systems in the area of risk assessment. In terms of shaping risk perception, interaction with the tool seemed to be more influential for individuals with low expertise. However, such tools should be used with caution because they can create blind spots in risk awareness for those with more limited expertise. Second, individuals with more expertise consistently perceive higher levels of risks in IT projects, as compared to those with more limited expertise. Surprisingly, however, the difference in risk perception does not translate into differences in subsequent decisions on how to continue a project. Third, a low level of perceived control leads to higher levels of risk perception and corresponding risk averse decisionmaking. This suggests that perceived control influences both risk perception and decision-making. These findings have implications for whether practitioners should adopt decision support tools when conducting IT project risk assessment. The study provides evidence that such tools can make novices less inclined to continue a risky project. In terms of how such tools shape risk perception, the study suggests that an attention-shaping tool can help novices assess IT project risks, but only when the tool captures the important aspects of a project's risk profile. Otherwise, the guidance that the tool provides can create blind spots to certain risks, which in turn leads to skewed risk assessments. Our study also has implications for deciding who to engage in risk assessments and how to interpret the results from assessments made by different actors. First, experts consistently perceive higher levels of risks. Second, a low level of perceived control leads to higher levels of risk perception and correspondingly more risk averse decision-making among both novices and experts.
Au
th o
r's
pe
rs
normally associated with a true expert. Additionally, since the respondents were not directly involved in an actual project that they were evaluating, their role can be viewed as one of an external evaluator assessing project risk rather than a manager with a direct personal stake in an actual (rather than hypothetical) IT project. However, this approach was necessary to minimize the risks of social desirability bias and retrospection bias that would come into play had we anchored the study around actual projects involving the study participants. Furthermore, although the data collected for this study was crosssectional, managers are likely to reassess project risks over the development lifecycle as development progresses. Accurately understanding managers' risk assessments over the entire project lifecycle requires longitudinal data at the project level, which remains a promising avenue for future research. Another limitation is that we only examined one particular attention-shaping tool [39]. This relatively simple tool has the advantage of making the experiment feasible for both experts and novices. For the experts, considering their professional commitments, using the tool required little effort. For the novices, the tool is selfexplanatory enough that no training was needed although it contains specific knowledge about IT project risks. Other attention-shaping tools might impact risk perception and decision-making in different ways. Because of the adopted tool's relative simplicity it is possible that experts might not have gained additional insights, while they might with a more sophisticated tool. In contrast, novices might have ascribed too much emphasis to the risk assessment scores produced by the tool, to the extent that they could have allowed it to strongly bias their own judgments about project risk. Nevertheless, the risk assessment tool used in this study is representative of the typical decision support system that integrates project-specific inputs from an individual IT manager into a holistic assessment that can be used to inform decision-making about a specific project. Additional research is needed to examine whether other types of attention-shaping tools – such as riskaction lists, risk-strategy models, and risk-strategy analysis [14] – would have similar impacts. Another fruitful avenue for future research is to compare the isolated use of a relatively simple risk assessment tool with portfolios of more sophisticated decision support systems for risk assessment and decision-making.
on
280
8. Implications and conclusions Our study provided insight into how three different conditions influence individuals' risk assessment in IT
S. Du et al. / Decision Support Systems 43 (2007) 269–283
co
py
a rough plan was created and used to obtain approval for the project. However, the project plan was never fully developed or used to actively manage the project. The project team is using a traditional phased development methodology, which assumes that all user requirements are known and can be well-specified at the beginning of the project. The chosen methodology for this project has caused significant problems because new and unexpected requirements have surfaced as the intended users have become more familiar with what the warehouse management application can offer. Now, the users of the system have repeatedly expressed the need for additional features and functionality that go well beyond the original specifications.
al
Appendix B . Questionnaire items
on
Risk perception was measured using four, 7-point semantic differential scale items that assessed how the respondent characterized the current status of the project: (1) Significant opportunity/significant threat, (2) potential for loss/potential for gain, (3) very unlikely to succeed/ very likely to succeed, and (4) unpromising/promising. Continuation intention was measured using the following three, 8-point scale items with “lean towards discontinuing” and “lean towards continuing” anchors: (1) Please rate the likelihood that you will recommend continuation or discontinuation of the project, (2) Please rate the likelihood that you will recommend abandonment or continuation of the project, and (3) Please indicate whether you would increase or reduce the resources (e.g. money, people) for this project.
Appendix A. Outsourced IT project
pe
rs
Our research highlights several promising directions for future research. First, future research can investigate why differences in risk perception between novices and experts do not translate into differences in decisionmaking. The study shows that while experts perceive higher levels of risk in IT projects as compared to novices, there is no significant difference in their willingness to continue the project. One possible explanation may be that experienced individuals are generally more willing to take risks for a given level of risk perception. This speculation needs, however, to be examined further. Second, researchers can investigate whether more advanced risk assessment tools will produce similar impacts on risk assessment outcomes. Our results indicate that a simple risk assessment tool is helpful for novices but not for experts. This may be because the guidance provided by a simple tool does not augment the expertise that the experts already possess. Future research is therefore needed to investigate whether and how experts' risk perception and decision-making will be influenced by more advanced tools. It should finally be noted that risk management is often a group exercise. While this study was focused on the individual as the unit of analysis, it might be fruitful to extend the inquiry to project teams as the unit of analysis. Such an extension could provide valuable insights concerning how group dynamics affect the assessment and management of software project risks.
281
Au
th o
r's
You are a project manager in the information technology (IT) department of an Atlanta-based retail store chain. Three months ago, your company hired a firm in Beijing, China to develop software for warehouse management which was projected to take 6 months to complete. All project team members are located in China and none of them report to you or anyone else in your company. You were assigned to monitor the project from Atlanta for your company. The new system will be a standard application and will not require complex interconnections with existing systems. This project is unlike any other that the development team has undertaken. It is unique in the sense that it is the first warehouse management system that the company has taken. All 34 intended users are businesspeople located at the company's main warehouse in Atlanta. Prior to the start of this project, meetings were held with the intended users to brainstorm and prioritize their requirements for the system. The intended users were actively involved in the project from the beginning. For this project,
References [1] J.R. Anderson, R. Jeffries, Novice LISP errors: undetected losses of information from working memory, Human Computer Interaction 1 (2) (1985). [2] M.E. Atwood, A.A. Turner, H.R. Ramsey, J.N. Hopper, An exploratory study of the cognitive structures underlying the comprehension of software design problems, Technical Report, vol. 392, AKI, Alexandria, VA, 1979. [3] H. Barki, S. Rivard, J. Talbot, Toward an assessment of software development risk, Journal of Management Information Systems 10 (2) (1993). [4] B.W. Boehm, Software Risk Management, IEEE Computer Society Press, Los Alamitos, Calif, 1989. [5] B.W. Boehm, Software risk management: principles and practices, IEEE Software 8 (1) (1991). [6] M.T.H. Chi, R. Glaser, M.J. Farr, The Nature of Expertise, Lawrence Erlbaum, Hillsdale, NJ, 1988. [7] G.B. Davis, Strategies for information requirements determination, IBM Systems Journal 21 (1) (1982). [8] D.C. Dearborn, H.A. Simon, Selective perception: a note on the departmental identifications of executives, Sociometry 21 (2) (1958).
S. Du et al. / Decision Support Systems 43 (2007) 269–283
al
co
py
[30] E.W.T. Ngai, F.K.T. Wat, Fuzzy decision support system for risk analysis in e-commerce development, Decision Support Systems 40 (2) (2005). [31] G.V. Post, D.J. Diltz, A stochastic dominance approach to risk analysis of computer systems, MIS Quarterly 10 (4) (1986). [32] R.K. Rainer, C.A. Snyder, H.H. Carr, Risk analysis for information technology, Journal of Management Information Systems 8 (1) (1991). [33] K.D. Schenk, N.P. Vitalari, K.S. Davis, Differences between novice and expert systems analysts: what do we know and what do we do? Journal of Management Information Systems 15 (1) (1998). [34] R. Schmidt, K. Lyytinen, M. Keil, P. Cule, Identifying software project risks: an International Delphi Study, Journal of Management Information Systems 17 (4) (2001). [35] S.B. Sitkin, L.R. Weingart, Determinants of risky decision-making behavior: a test of the mediating role of risk perceptions and propensity, Academy of Management Journal 38 (6) (1995). [36] L. Sjoeberg, Factors in risk perception, Risk Analysis 20 (1) (2000). [37] D. Straub, M. Boudreau, D. Gefen, Validation guidelines for IS positivist research, Communications of the Association for Information Systems 13 (24) (2004). [38] The Standish Group International, Extreme Chaos, http://www. standishgroup.com/sample_research/PDFpages/extreme_chaos. pdf, 2001. [39] A. Tiwana, M. Keil, The one-minute risk assessment tool, Communications of the ACM 47 (11) (2004). [40] L. Wallace, M. Keil, A. Rai, How software project risk affects project performance: an investigation of the dimensions of risk and an exploratory model, Decision Sciences 35 (2) (2004). [41] D.B. Walz, J.J. Elam, B. Curtis, Inside a software design team: knowledge acquisition, Sharing, and Integration, Communications of the ACM 36 (10) (1993). [42] J.C. Westland, Transaction risk in electronic commerce, Decision Support Systems 33 (1) (2002).
Au
th o
r's
pe
rs
[9] A. Fiegenbaum, S. Hart, D. Schendel, Strategic reference point theory, Strategic Management Journal 17 (3) (1996). [10] S.B. Guarro, Principles and procedures of the LRAM approach to information systems risk analysis and management, Computers & Security 6 (6) (1987). [11] E. Hartono, A.L. Lederer, V. Sethi, Y. Zhuang, Key predictors of the implementation of strategic information systems plans, ACM SIGMIS Database 34 (3) (2003). [12] B. Hosack, The Effect of System Feedback and Decision Context on Value-Based Decision-Making Behavior, Decision Support Systems; in press. [13] C.J. Huberty, J.D. Morris, Multivariate analysis versus multiple univariate analyses, Psychological Bulletin 105 (2) (1989). [14] J. Iversen, L. Mathiassen, P.T. Nielsen, Managing risks in software process improvement: an action research approach, MIS Quarterly 28 (3) (2004). [15] P. Johnson, A. Duran, F. Hassebrock, J. Moller, M. Prietula, P.J. Feltovich, D.B. Swanson, Expertise and error in diagnostic reasoning, Cognitive Science 5 (1981). [16] D.R. Jones, P. Wheeler, R. Appan, N. Saleem, Understanding and Attenuating Decision Bias in the Use of Model Advice and Other Relevant Information, Decision Support Systems 42 (3) (2006). [17] M. Keil, P.E. Cule, K. Lyytinen, R.C. Schmidt, A framework for identifying software project risk, Communications of the ACM 41 (11) (1998). [18] M. Keil, L. Wallace, D. Turk, G. Dixon-Randall, U. Nulden, An investigation of risk perception and risk propensity on the decision to continue a software development project, The Journal of Systems and Software 53 (2) (2000). [19] L.J. Kirsch, Deploying common systems globally: the dynamics of control, Information Systems Journal 15 (4) (2004). [20] J.L. Kolodner, Towards an understanding of the role of experience in the evolution from novice to expert, International Journal of Man–Machine Studies 19 (5) (1983). [21] J.A. Lawrence, Expertise on the bench: modeling magistrates' judicial decision-making, in: M.T.H. Chi, R. Glaser, M.J. Farr (Eds.), The Nature of Expertise, Lawrence Erlbaum, Hillsdale, NJ, 1988. [22] H.J. Leavitt, Applied organization change in industry: structural, technical, and human approaches, in: W.W. Cooper, H.J. Leavitt, M.W. Shelly (Eds.), New Perspectives in Organizational Research, Wiley, New York, 1964. [23] J. Lee, H.R. Rao, Perceived Risks, Counter-Beliefs, and Intentions to Use Anti-/Counter-Terrorism Websites: An Exploratory Study of Government-Citizens Online Interactions in a Turbulent Environment, Decision Support Systems; in press. [24] J. Linnerooth-Bayer, B. Wahlstrom, Applications of probabilistic risk assessments: the selection of appropriate tools, Risk Analysis 11 (2) (1991). [25] K. Lyytinen, L. Mathiassen, J. Ropponen, Attention shaping and software risk — a categorical analysis of four classical risk management approaches, Information Systems Research 9 (3) (1998). [26] G.M. Marakas, J.J. Elam, Semantic structuring in analyst acquisition and representation of facts in requirements analysis, Information Systems Research 9 (1) (1998). [27] J.G. March, Z. Shapira, Managerial perspectives on risk and risk taking, Management Science 33 (11) (1987). [28] F.W. McFarlan, Portfolio approach to information systems, Journal of Systems Management 33 (1) (1982). [29] T. Moynihan, An inventory of personal constructs for information systems project risk researchers, Journal of Information Technology 11 (4) (1996).
on
282
Stephen M. Du is a doctoral student in the Department of Computer Information Systems at Georgia State University. He has experience in the software industry as a product manager and an applications consultant. He earned his MBA from UC Berkeley, his master's degree in electrical engineering from Stanford University and his bachelor's degree in electrical engineering from Princeton University. His research interests are in the areas of interorganizational information systems and digitally enabled collaboration. Mark Keil is the Board of Advisors Professor and Department Chair of Computer Information Systems (CIS) in the J. Mack Robinson College of Business at Georgia State University. His research focuses on software project management, with particular emphasis on understanding and preventing software project escalation— cases in which projects seem to take on lives of their own, continuing to absorb valuable resources without ever reaching their objectives. Keil's research has been published in MIS Quarterly, Sloan Management Review, Communications of the ACM, Journal of Management Information Systems, IEEE Transactions on Engineering Management, Information Systems Journal, Decision Support
S. Du et al. / Decision Support Systems 43 (2007) 269–283
co
al on
pe
rs
Lars Mathiassen holds an M.Sc. in computer science from Århus University, Denmark, a Ph.D. in Informatics from Oslo University, Norway, and a Dr. Techn. in software engineering from Aalborg University, Denmark. He is currently a Georgia Research Alliance Eminent Scholar and professor in computer information systems at Georgia State University. His research interests focus on IT-enabled process innovation. More particularly, he has worked with project management, software process improvement, organizational development, management of IT, and risk management. He is a co-author of Professional Systems Development-Experiences, Ideas and Action, Computers in Context—The Philosophy and Practice of Systems Design, Object-Oriented Analysis and Design, and Improving Software Organizations: From Principles to Practice. His research has been published in several international journals including MIS Quarterly, Information Systems Research, Information, Technology and People, Information Systems Journal, Communications of the ACM, IEEE Transactions on Engineering Management, and IEEE Software.
Amrit Tiwana (Ph.D., Georgia State University, 2001) is an assistant professor in Iowa State University's College of Business in Ames, Iowa. He was previously on the faculty of Emory University in Atlanta. His research focuses on knowledge management in software development. His work has appeared in journals including California Management Review, Journal of Management Information Systems, Decision Sciences, IEEE Transactions on Engineering Management, IEEE Software, IEEE Internet Computing, Communications of the ACM, Decision Support Systems, Information Systems Journal, Journal of Knowledge Management, Journal of the American Society for Information Science and Technology, and others. His research has been sponsored by leading corporations including United Parcel Service, IBM, Hitachi, Fujitsu, Toshiba, Hewlett Packard, and Mitsubishi.
py
Systems, and other journals. He currently serves on the editorial boards of IEEE Transactions on Engineering Management, Decision Sciences, and the Journal of Management Information Systems. He has also served as an Associate Editor for MIS Quarterly, and as Co-Editor of The DATA BASE for Advances in Information Systems. He earned his bachelor's degree from Princeton University, his master's degree from MIT's Sloan School of Management, and his doctorate in management information systems from the Harvard Business School.
Au
th o
r's
Yide Shen is a doctoral student in the Department of Computer Information Systems at Georgia State University. She holds a BBA in Accounting from Wuahn University, P.R. China and an MS in MIS from University of Nebraska at Omaha. Her research interests include IT adoption and innovation, IT human resource issues, software project management, and organizational communication technologies.
283