Network-based IDSs, on the other hand, monitor network behavior usually by ... of connections to the same service) only ranges from 0 to 1. If the attributes are ...
Attribute Normalization in Network Intrusion Detection Wei Wang
Svein J. Knapskog
Sylvain Gombault
Q2S Center in Communication Systems, Norwegian University of Science and Technology NTNU, Norway
Q2S Center in Communication Systems, Norwegian University of Science and Technology NTNU, Norway
D´epartement R´eseaux, s´ecurit´e et multim´edia, TELECOM Bretagne, France
Abstract—Anomaly intrusion detection is an important issue in computer network security. As a step of data preprocessing, attribute normalization is essential to detection performance. However, many anomaly detection methods do not normalize attributes before training and detection. Few methods consider to normalize the attributes but the question of which normalization method is more effective still remains. In this paper, we introduce four different schemes of attribute normalization to preprocess the data for anomaly intrusion detection. Three methods, k-NN, PCA as well as SVM, are then employed on the normalized data as well as on the original data for comparison of the detection results. KDD Cup 1999 data as well as a real data set collected in our department are used to evaluate the normalization schemes and the detection methods. The systematical evaluation results show that the process of attribute normalization improves a lot the detection performance. The statistical normalization scheme is the best choice if the data set is large. The merits and demerits of the detection methods k-NN, PCA and SVM are also analyzed and discussed in this paper to suggest their suitable detection environments.
I. I NTRODUCTION Network security is becoming more and more important as networks have heavily involved in people’s daily life and in all business processes within most organizations. As an important technique in the defense-in-depth network security framework [1], intrusion detection has become a widely studied topic in computer networks in recent years. In general, the techniques for intrusion detection fall into two major categories: signature-based detection and anomaly detection. Signature-based detection identifies malicious behavior by matching it against pre-defined description of attacks (signatures). Anomaly detection, on the other hand, defines a profile of a subject’s normal activities and attempts to identify any unacceptable deviation as a potential attack. Any observable behavior of a system or a network, e.g., network traffic, audit logs, system calls, can be used as the subject information. Intrusion Detection Systems (IDS) can also be categorized as host-based IDSs and network-based IDSs according to the target environment for the monitoring. Host-based IDSs usually monitor the host system behavior by examining the information of the system, such as CPU time, system calls, keystroke and command sequences. Examples are [2][3][4][5]. Network-based IDSs, on the other hand, monitor network
behavior usually by examining the content (e.g., payload [6]) as well as some statistical attributes of network traffic [7]. In 1999, Lee et al. [1] constructed 41 attributes from raw traffic data (i.e., tcpdump files) to build classification models for network based intrusion detection. The raw traffic data was collected at MIT Lincoln Laboratory for the 1998 DARPA Intrusion Detection Evaluation program [8]. The 41 attributes have been shown to be promising for network intrusion detection [1] and the attribute sets of the network traffic have also been used as KDD Cup 1999 data (The 1999 Knowledge Discovery and Data Mining Tools Competition). The DARPA Intrusion Detection Evaluation [8] as well as the attributes (KDD Cup 1999 data) provide a relatively good benchmark data set, not only for security research community, but also for the data mining research domain. Although the evaluation process has been criticized [9] for having some flaws, the data set is so far probably the only large-size, available and well labeled network data source in public. Many research groups have used the KDD Cup 1999 data to validate their detection methods. Lee et al. [1] used Ripper to mine some detection rules from the attribute sets and to build misuse detection models. Jin et al.[10] utilized the covariance matrices of sequential samples to detect multiple network attacks. Katos [11] evaluated cluster, discriminant and logit analysis on the same KDD Cup 1999 data for network intrusion detection. Bouzida and Cuppens [12] used Neural Networks as well as decision trees for network intrusion detection. Mukkamala et al. [13] evaluated performance of Artificial Neural Networks (ANNs), SVM and Multivariate Adaptive Regression Splines (MARS) on KDD Cup 1999 data for network intrusion detection. Yang et al. [14] used TCM-KNN (Transductive Confidence Machines for K-Nearest Neighbors) and Ma et al. [15] used K-means, fuzzy C means clustering and fuzzy entropy clustering for intrusion detection. Liao et al. [16] used Fuzzy Adaptive Resonance Theory (ART) and Evolving Fuzzy Neural Networks (EFuNN) for intrusion detection. Shyu et al. [17] employed Principal Component Classifier for network intrusion detection also based on the KDD Cup 1999 data. In our previous work [18][19], we used Principal Component Analysis (PCA) for network intrusion identification.
Data preprocessing is very important for anomaly intrusion detection and for many data mining related tasks. Data normalization is a essential step of data preprocessing for most anomaly detection algorithms that learns the statistical attributes extracted from the audit data. Data normalization is to scale the values of each continuous attributes into a well-proportioned range such that the effect of one attribute cannot dominate the others. In KDD Cup 1999 data, for example, the values of attribute “dst bytes” (number of data bytes from destination to source) ranges from 0 to 2293370 or even larger, while the attribute “same srv rate” (number of connections to the same service) only ranges from 0 to 1. If the attributes are not normalized into the same (or similar) scale, one attribute (e.g., “dst bytes”) may overwhelm all the others and this means that only one attribute is considered during the detection and the statistical detection methods thus are not effective. Except the reference [1] that need the original attributes to mine some detection rules, other references that use the statistical attributes, [10], [11], [13], [17], [18] and [19] did not normalize the attributes before training and detection. Reference [14] and [15] used a statistical normalization that converts the data into standard Normal distribution while Reference [16] converted the data into a range of 0 and 1. In this paper, we systematically evaluate the impact of different schemes of attribute normalization on the detection performance with three anomaly detection algorithms, PCA (Principal Component Analysis), k-NN (K-Nearest Neighbor), and one class SVM (Support Vector Machine). We introduce four different schemes of attributes normalization include mean range [0,1] normalization, statistical normalization, frequency normalization and ordinal value normalization. KDD Cup 1999 data are used for the evaluation. The extensive experiments show that attribute normalization improves a lot the detection performance. Statistical normalization outperforms the other schemes if the data set is large. We also compare the performance of the three anomaly intrusion algorithms in this paper. In practical use, we detect DDoS attacks with the statistical normalization methods in a real network and the testing results show its effectiveness. Our contributions are twofold. First, attribute normalization is very important for many anomaly detection tasks but it is often ignored. The comparison results with different schemes of attribute normalization presented in this paper provide useful references not only to the anomaly intrusion detection problem, but also to general classification problems that use statistical attributes. To the best of our knowledge, this is the first study that evaluates the impact of attribute normalization on the classification performance. Second, we analyze the merits as well as the demerits of anomaly detection algorithms k-NN, PCA and SVM and suggest their most suitable environments for the detection. The remainder of this paper is organized as follows. Section 2 describes the schemes of attribute normalization. Section 3 briefly introduces the anomaly detection algorithms used in this paper. Extensive experiments based on KDD Cup 1999 data are given in detail in Section 4. Experiments based on
some real data are described in Section 5. Concluding remarks follow in Section 6. II. ATTRIBUTE NORMALIZATION SCHEMES There are generally four steps for anomaly intrusion detection: attribute construction, data preprocessing, model building and anomaly detection (see Fig. 1). This Section focuses on attribute normalization in the step of data preprocessing.
Fig. 1.
Steps of anomaly intrusion detection
In this paper, besides the original attributes, we use another four schemes of attribute normalization for anomaly intrusion detection. A. Mean range [0,1] If we know the maximum and minimum value of a given attribute, it is easy to transform the attribute into a range of value [0,1] by xi =
vi − min(vi ) max(vi ) − min(vi )
(1)
where vi is the actual value of the attribute, and the maximum and minimum are taken over all values of the attribute. Normally xi is set to zero if the maximum is equal to the minimum. B. Statistical normalization The purpose of statistical normalization is to convert data derived from any Normal distribution into standard Normal distribution with mean zero and unit variance. The statistical normalization is defined as xi = 1 n
vi − µ σ
(2)
where µ is mean of n values for a given attribute: µ = P n i=1 vi . σ is its stand deviation v u n u1 X σ=t (vi − µ) (3) n i=1
However, using statistical normalization, the data set should follow a Normal distribution, that is, the number of sample n should be large according to central limit theorem [20]. The statistical normalization does not scale the value of the attribute into [0,1]. It instead ranges 99.9% samples of the attribute into [-3, 3].
C. Ordinal normalization Ordinal normalization is to rank the continuous value of an attribute and then normalize the rank into [0,1]. Let r be the rank of a given value in an attribute, the ordinal normalization is defined as r−1 xi = max(r) − 1
(4)
Clearly, ordinal normalization also ranges the values of a attribute into [0,1]. In this paper, we do not increase the rank if some values of an attribute are the same. For an instance, if some values are ranked as {...,15,15,15}, the next rank is 16 other than 18. D. Frequency normalization Frequency normalization is to normalize an attribute by considering the proportion of a value to the summed value of the attribute. It is defined as vi xi = P (5) i vi Frequency normalization also scales an attribute into [0,1]. III. A NOMALY INTRUSION DETECTION METHODS In this paper, we used PCA, k-NN, and one class SVM to evaluate the performance of different schemes of attribute normalization. Unlike other discriminative methods (e.g., decision tree) that learn the distinction between normal and abnormal, the three methods presented in this paper only build normal models and then use the model to detect anomalies. A. Anomaly detection with Principal Component Analysis (PCA) Principal Component Analysis (PCA) [21] is a widely used dimensionality reduction techniques for data analysis and compression. It is based on transforming a relatively large number of variables into a smaller number of uncorrelated variables by finding a few orthogonal linear combinations of the original variables with the largest variance [22]. Given a set of observations be X1 , ..., Xi , and suppose each observation is represented by a row vector of length m (the number of attributes). The dataset is thus represented by a matrix Xn×m . Pn The average observation is defined as µ = n1 n=1 Xi . Observation deviation from the average is defined as Φi = Xi −µ. The sample covariance matrix of the data set is defined as n 1X (Xi − µ)(Xi − µ)T (6) C= n n=1 Suppose (λ1 , µ1 ), (λ2 , µ2 ), ..., (λm , µm ) are m eigenvalueeigenvector pairs of the sample covariance matrix C. We choose k eigenvectors having the largest eigenvalues. Often there will be just a few large eigenvalues, and this implies that k is the inherent dimensionality of the subspace governing the “signal” while the remaining (m − k) dimensions generally
contain noise [22]. The dimensionality of the subspace k can be determined by [22] Pk i=1 λi Pm ≥α (7) i=1 λi where α is the ratio of variation in the subspace to the total variation in the original space. We form a (m × k) (usually k ¿ m for data reduction) matrix U whose columns consist of the k eigenvectors. The representation of the data by principal components consists of projecting the data onto the k-dimensional subspace according to the following rules [22] Yi = (Xi − µ)U = ΦU (8) The number of principal eigenvectors U1 , U2 , ..., Uk , used to represent the distribution of the original data, is determined by (7). Given an incoming vector T that represents a test sample, we project it onto the k-dimensional subspace representing the normal behavior according to the rules defined by (8). The distance between the test data vector and its reconstruction onto the subspace is the distance between the mean-adjusted input data vector Φ = T − µ and Φr = (T − µ)U U T = ΦU U T
(9)
If the test data vector is normal, that is, if the test data vector is very similar to the training vectors corresponding to normal behavior, the test data vector and its reconstruction will be very similar and the distance between them will be very small. On this property our intrusion identification model is based. As PCA seeks a projection that best represents the data in a least-square sense, we use the squared Euclidean distance in the experiments to measure the distance between these two vectors ε =k Φ − Φr k2 (10) ε is characterized as the anomaly index. If ε is below a predefined threshold, the vector is then identified as normal. Otherwise it is identified as anomalous. B. Anomaly detection with K-Nearest Neighbor (K-NN) K-Nearest Neighbor (k-NN) is a method for classifying objects based on closest training examples in the feature space. It is easily accessible and has been demonstrated effective for many classification tasks [22]. For a given k, k-NN ranks the neighbors of a test vector T among the training samples, and uses the class labels of the k most nearest neighbors to predict the class of the test vector. Euclidean distance is usually used for measuring the similarity between two vectors: v um uX d(T, Xi ) =k T − Xi k= t (ti − xij )2 (11) i=1
where ti is the i-th variable in the test vector T ; Xj is the vector j in the training data set and xij is the i-th variable in sequences Xj . In the experiments, we use a set of normal data as the training set and suppose that the normal behaviors are
embedded in the data sets. Given a test vector T , the Euclidean distance between the test vector and each vector in the training data set is calculated by (11). The distance scores are sorted and the k nearest neighbors are chosen to determine whether the test vector is normal or not. In anomaly detection, we average the k closest distance scores as the anomaly index. If the anomaly index of a test sequence vector is above a threshold ε1 , the test vector is then classified as abnormal. Otherwise it is considered as normal. C. Anomaly detection with one class Support Vector Machine (SVM) Support Vector Machine (SVM) is a very widely used method for classification. In this paper, we use one class SVM that was proposed by Sch¨olkopf et al.[23]. One class SVM algorithm is to map the data into a feature space using an appropriate kernel function, and then to separate the mapped vectors from the origin with maximum margin. The algorithm returns a function f that takes the value +1 in a “small” region capturing most of the data vectors (e.g., training data), and −1 elsewhere [24]. Given training vectors X1 , X2 , ..., Xl belonging to normal class, the primal form of quadratic programming problem is l 1 X 1 ξi − ρ min kωk2 + 2 vl i=1
(12)
(ω · Φ(Xi )) ≥ ρ − ξi
(13)
Subject to where Φ is a kernel map that transforms the training examples to another space. After ω and ρ solve the problem, the decision function is f (x) = sgn((ω · Φ(X)) − ρ)
(14)
In anomaly detection, we use the normal data to build the normal model. If the decision function gives a positive value for a test vector T , the test data is classified as normal. Otherwise, it is considered as anomalous. IV. E XPERIMENTS ON KDD C UP 1999 DATA A. Data sets As mentioned, although there are some criticism [9] towards the data, we used the data in our experiments based on two reasons. First, the data has been widely used for evaluating various intrusion detection methods and our detection results can be compared with others. Second, the data provides numerous types of anomalies. The raw data contains traffic in a simulated military network that consists of hundreds of hosts. We use a subset in the experiments. The raw data set we used was pre-processed into about 5 million connection records by Lee et al. [1] as part of the UCI KDD archive [25]. A connection is a sequence of TCP packets starting and ending at some well defined times, between which data flows from a source IP address to a target IP address under some well defined protocol [25]. In the data
set, each network connection is labeled as either normal, or as an exactly one specific kind of attack. The network connection data contain 41 features. These features were divided into three groups: basic features of individual TCP connections, traffic features and content features within a connection suggested by the domain knowledge. Among these 41 features, 34 are numeric and 7 are symbolic. Only the 34 numeric features were used in the experiments. Each connection in the data set is thus transformed into a 34-dimensional vector as data input for detection. There are 494, 021 connection records in the training set in which 97, 278 are normal and 396,744 are attacks. There are 22 types of attacks in total in the subset and these attacks fall into one of 4 categories: DoS: denial-of-service (e.g., teardrop); R2L: unauthorized access from a remote machine (e.g., password guessing); U2R: unauthorized access to local superuser (root) privileges by a local unprivileged user (e.g., buffer overflow attacks) and PROBE: surveillance and other probing (e.g., port scanning). In a real computer network environment, collection of large amounts of precisely normal data is often difficult for a practical IDS. In the experiments, a smaller data set, 7,000 normal network connections, are thus randomly selected for training the normal model and a relatively large data set, randomly selected 10,000 normal network connections and 20% of DoS attacks as well as all the Probe, R2L and U2R attack data are used for detection. The data sets used in the experiments are described in Tab.1. TABLE I DATA DESCRIPTION Type Normal DoS Probe R2L U2R
Total (#) 98,278 391,458 4,107 1,126 52
Training (#) 7,000 0 0 0 0
Test (#) 10,000 78,291 4,107 1126 52
B. Parameters and criterion of evaluation In the experiments reported in this paper, we used the same training data for training and the same test data for testing to guarantee a fair comparison. The parameters in the detection are very important. In the experiments, for PCA, we use ratio α as 99.9% as it is most desirable based on our previous experimental results [18][19]. For k-NN, we set k = 10 as this is a good choice [4]. For SVM, we use the kernel as the RBF and adjust parameters v to obtain the different results. We made our own programs for k-NN and PCA. We used LibSVM tools (Version 2.88)[26] for SVM. We use Receiver Operating Characteristic (ROC) curves to evaluate the detection performance. The ROC curve is the plot of Detection Rates (DR), calculated as the percentage of intrusions detected, against False Positive Rates (FPR), calculated as the percentage of normal connections falsely classified as intrusions. Points nearer to the upper left corner of the ROC curve are the most desirable. There is a tradeoff between the DR and FPR and the ROC curve is obtained by setting different thresholds.
C. Evaluation on methods of attribute normalization
Detection Rate (%)
99
98
original range [0,1] statistical ordinal frequency
97
96
95
0
5
10
Fig. 3.
15 20 25 False Positive Rate (%)
30
35
40
Overall detection results with PCA.
100 99.5 Detection Rate (%)
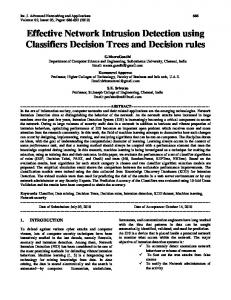
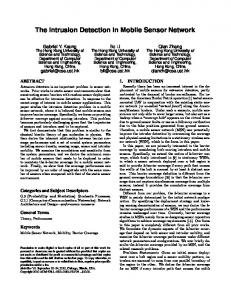
We used four schemes defined in Section 2 to normalize the data. The normalized data as well as the original data are then fed into k-NN, PCA and SVM methods for training and testing. With different attribute normalization schemes, The overall detection results using k-NN, PCA and SVM are presented in Fig. 2-4. As probe attack detection is difficult to detect [19], we also present results of probe attack detection in Fig. 5-7. From Fig.2-7, it is clear that attribute normalization improves the detection performance for all the detection methods. In details, attribute normalization improves a lot the detection performance for k-NN and SVM based anomaly detection, while normalization help little for PCA method. K-NN and SVM based detection methods mainly compute the distances of two vectors and the detection results are very sensitive to the scale of the attributes. In contrast, PCA seeks new major coordinates and it is not very sensitive to the normalization because we use α as 99.9% such that it captures most of variance contained in the data. Statistical normalization is the best except ordinal normalization for probe attack detection with PCA. Statistical normalization not only considers the mean scale of attribute values, but also takes into account their statistical distribution and this may help a lot for the detection. In general, for the detection with distance based methods such as k-NN and SVM, statistical normalization is the best choice; range [0,1] is the second; while frequency and ordinal normalization is not very effective but are still better than original attributes.
100
99 98.5 original range [0,1] statistical ordinal frequency
98 97.5 97
0
10
Fig. 4.
20 30 False Positive Rate (%)
40
50
Overall detection results with SVM.
100
100 original range [0,1] statistical ordinal frequency
98
Detection Rate (%)
Detection Rate (%)
99
97
original range [0,1] statistical ordinal frequency
95
90
96
95
0
10
Fig. 2.
20 30 40 False Positive Rate (%)
50
60
Overall detection Results with k-NN.
85
0
10
Fig. 5.
20
30 40 50 False Positive Rate (%)
60
70
80
Probe attack detection results with k-NN.
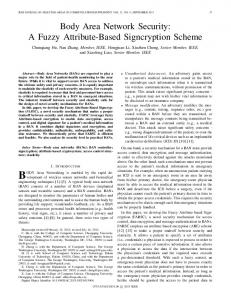
D. Evaluation on methods of anomaly detection We compare the detection results with only statistical attribute normalization based on different anomaly detection, k-NN, PCA and SVM. The overall detection results as well as probe attack detection results are shown in Fig. 8 and Fig. 9 respectively. From the figures, it is seen that, k-NN is better than SVM and PCA in terms of detection accuracy. The testing results show that k-NN, SVM and PCA all achieve satisfactory results.
V. D ETECTING DD O S ATTACKS IN A REAL NETWORK As important work on DDoS attack analysis and detection project in the Institute, we collected various major DDoS attack tools and implemented them in the laboratory to collect network traffic of DDoS attacks. The attack tools are Trinoo, TFN, Stacheldraht, TFN2K and Mstream. Using these tools, we implement DDoS attacks with ICMP flood, SYN flood,
100
100
95
95
85 80 75 original range [0,1] statistical ordinal frequency
70 65 60
0
10
Fig. 6.
20 30 False Positive Rate (%)
40
Detection Rate (%)
Detection Rate (%)
90
90 85 80
70
50
Fig. 9. SVM.
Probe attack detection results with PCA.
SVM K−NN PCA
75
0
10
20 30 False Positive Rate (%)
40
50
Comparison: Probe attack detection results with k-NN, PCA and
100
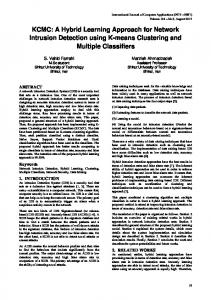
our experiments. After the raw data 2 was collected and the attributes were constructed, we randomly selected 5,000 normal connections for training and 10,000 normal connections as well as 36,380 DDoS attack connections for testing. Based on the results of Section 4, we use k-NN for DDoS attack detection with or without statistical attribute normalization for comparison and the results are summarized in Fig.10. From the figure, it is clear that statistical attribute normalization improve a lot the detection results and k-NN can achieve a good results with statistical attribute normalization.
95 original range [0,1] statistical ordinal frequency
Detection Rate (%)
90 85 80 75 70 65 60
0
10
Fig. 7.
20 30 False Positive Rate (%)
40
50 100
Probe attack detection results with SVM. 98 Detection Rate (%)
100
Detection Rate (%)
99.5 99 98.5
96
94
92
Statistical normalization Original data
98 SVM K−NN PCA
97.5 97
0
5
10
15 20 25 30 False Positive Rate (%)
35
40
90
45
Fig. 8. Comparison: Overall detection results with k-NN, PCA and SVM, using statistical normalization.
UDP flood, Steam (TCP-ACK flood) and Smurf style attacks. A large set of normal as well as DDoS attack network traffic are then collected for analysis. In the experiments, we use a tool 1 to transform the raw tcpdump traffic files into connection records with 41 attributes (defined in [1]). We only use the 34 continuous attributes in 1 The attribute construction programs were written by our team members [12].
Fig. 10.
0
5 10 False Positive Rate (%)
15
Result of k-NN method: statistical normalization vs. original data.
VI. C ONCLUDING REMARKS Anomaly intrusion detection is a pattern classification in nature. Attribute construction and classification methods are usually the core issues. The classification methods should correspond to the attributes for effective detection. Many statistical methods have been successfully employed for anomaly detection. However, the question of whether attribute normalization is essential with respect to the detection performance still remains. If it is essential, the question is changed to what method of attribute normalization is most effective. 2 The
data are available upon request to the authors.
This paper tries to provide answers to the above two questions by case studies. The answers can be applied to other general classification problem, not only to anomaly detection. In our experiments, we used 4 schemes to normalize the original attributes. k-NN, PCA and SVM are employed as anomaly intrusion detection methods. KDD Cup 1999 data are first used for the testing. The experiment results show that attribute normalization improves the detection performance with k-NN, PCA and SVM. Jin [26] suggests that data be scaled in a mean fashion (e.g., mean range [0,1]) before using the LibSVM tools. Our experiments show that statistical normalization is the better choice if the data sample is large, even mean range [0,1] can also improve the detection performance. A large data set collected from real networks are also used in the experiments for DDoS attack detection and the results are consistent with the previous findings. Through our work, we suggest that attribute normalization should always be considered for the classification problem. There are some exceptions for the needs of attribute normalization. For example, some machine learning algorithms (e.g., decision trees) require the original attribute to mine some rules. In this case attribute normalization cannot be conducted due to the fact that the original information may be lost. Another exception is that one part of data cannot be provided or the data is of streaming type. In this case, because the data is incomplete or the a data is streaming in real-time and we cannot calculate the mean and standard deviation for normalization. For the detection methods we used in this paper, k-NN does not need a training process as is the case for PCA and SVM. The computation complexity of k-NN for the detection is O(pqm), where p is the number of events in the test set, q is the number of events in the training set and m is the dimensionality of the events. It is clear that k-NN needs a lot of computation if the data is very high-dimensional and the amount of training samples is very large. The computation for PCA and SVM, on the other hand, is relatively time consuming during the training process, but much less calculations is needed during the test process. Moreover, system resources may be largely saved for compressed normal models for PCA and SVM. It is suggested that PCA is more suitable for processing large of amount of data for anomaly intrusion detection. However, as a easily used method, k-NN is appropriate for intrusion detection if the data is not so massive. k-NN is also light-weight so that it is feasible to periodically retrain the detection model only by incorporating new training data. For the future work, we will try to design a more effective scheme of attribute normalization that may not only consider the statistical distribution of one attribute, but also take into account the cross statistical properties among all the attributes in the data set. How to normalize streaming data is also being investigated. ACKNOWLEDGMENT The work of NTNU part was supported by the Centre for Quantifiable Quality of Service (Q2S) in Communication
Systems, Centre of Excellence, which is appointed by the Research Council of Norway and funded by the Research Council, NTNU and UNINETT. The research of the first author is also supported by ERCIM fellowship program. The work of TELECOM part was supported by ACI DADDi Project. R EFERENCES [1] Lee, W., Stolfo, S.J., Mok, K.W.: A data mining framework for building intrusion detection models. In: IEEE Symposium on Security and Privacy. (1999) 120–132 [2] Forrest, S., Hofmeyr, S.A., Somayaji, A., Longstaff, T.A.: A sense of self for unix processes. In: IEEE Symposium on Security and Privacy. (1996) 120–128 [3] Schonlau, M., Theus, M.: Detecting masquerades in intrusion detection based on unpopular commands. Inf. Process. Lett. 76(1-2) (2000) 33–38 [4] Wang, W., Gombault, S.: Distance measures for anomaly intrusion detection. In: Security and Management. (2007) 17–23 [5] Ingham, K.L., Inoue, H.: Comparing anomaly detection techniques for http. In: RAID. (2007) 42–62 [6] Wang, K., Stolfo, S.J.: Anomalous payload-based network intrusion detection. In: RAID. (2004) 203–222 [7] Nassar, M., State, R., Festor, O.: Monitoring sip traffic using support vector machines. In: RAID. (2008) 311–330 Mit lincoln laboratory-darpa intru[8] MIT: sion detection evaluation (retrieved march 2009). http://www.ll.mit.edu/mission/communications/ist/corpora/ideval/index.html (1999) [9] McHugh, J.: Testing intrusion detection systems: a critique of the 1998 and 1999 darpa intrusion detection system evaluations as performed by lincoln laboratory. ACM Trans. Inf. Syst. Secur. 3(4) (2000) 262–294 [10] Jin, S., Yeung, D.S., Wang, X.: Network intrusion detection in covariance feature space. Pattern Recognition 40(8) (2007) 2185–2197 [11] Katos, V.: Network intrusion detection: Evaluating cluster, discriminant, and logit analysis. Inf. Sci. 177(15) (2007) 3060–3073 [12] Bouzida, Y., Cuppens, F.: Neural networks vs. decision trees for intrusion detection. In: Proceedings of the first IEEE workshop on Monitoring, Attack Detection and Mitigation. (2006) [13] Mukkamala, S., Sung, A.H., Abraham, A.: Intrusion detection using an ensemble of intelligent paradigms. J. Network and Computer Applications 28(2) (2005) 167–182 [14] Li, Y., Fang, B., Guo, L., Chen, Y.: Network anomaly detection based on tcm-knn algorithm. In: ASIACCS. (2007) 13–19 [15] Ma, W., Tran, D., Sharma, D.: A study on the feature selection of network traffic for intrusion detection purpose. In: ISI. (2008) 245–247 [16] Liao, Y., Vemuri, V.R., Pasos, A.: Adaptive anomaly detection with evolving connectionist systems. J. Network and Computer Applications 30(1) (2007) 60–80 [17] Shyu, M., Chen, S., Sarinnapakorn, K., Chang, L.: A novel anomaly detection scheme based on principal component classifier. In: IEEE Foundations and New Directions of Data Mining Workshop. (2003) 60– 80 [18] Wang, W., Battiti, R.: Identifying intrusions in computer networks with principal component analysis. In: ARES. (2006) 270–279 [19] Wang, W., Guan, X., Zhang, X.: Processing of massive audit data streams for real-time anomaly intrusion detection. Computer Communications 31(1) (2008) 58–72 [20] Durrett, R.: Probability : Theory and Examples. Wadsworth, Pacific Grove, California (1991) [21] Jolliffe, I.T.: Principal Component Analysis. 2nd edn. Springer-Verlag, Berlin (2002) [22] Duda, R.O., Hart, P.E., Stork, D.G.: Pattern Classification. 2nd edn. China Machine Press (2004) [23] Sch¨olkopf, B., Platt, J.C., Shawe-Taylor, J., Smola, A.J., Williamson, R.C.: Estimating the support of a high-dimensional distribution. Neural Computation 13(7) (2001) 1443–1471 [24] Manevitz, L.M., Yousef, M.: One-class svms for document classification. Journal of Machine Learning Research 2 (2001) 139–154 Kdd cup 1999 data (retrieved march 2009). [25] KDD-Data: http://kdd.ics.uci.edu/databases/kddcup99/kddcup99.html (1999) [26] Chang, C.C., Lin, C.J.: LIBSVM: a library for support vector machines. (2001) Software available at http://www.csie.ntu.edu.tw/ cjlin/libsvm.