Biogeosciences, 7, 3637–3655, 2010 www.biogeosciences.net/7/3637/2010/ doi:10.5194/bg-7-3637-2010 © Author(s) 2010. CC Attribution 3.0 License.
Biogeosciences
Attribution of spatial and temporal variations in terrestrial methane flux over North America X. F. Xu1,2 , H. Q. Tian1,2 , C. Zhang1 , M. L. Liu1,2 , W. Ren1,2 , G. S. Chen1,2 , C. Q. Lu1,2 , and L. Bruhwiler3 1 Ecosystem
Dynamics and Global Ecology (EDGE) Laboratory, School of Forestry and Wildlife Sciences, Auburn University, Auburn, AL, 36849, USA 2 International Center for Climate and Global Change Research, Auburn University, Auburn, AL, 36849, USA 3 NOAA Earth System Research Laboratory, 325 Broadway, Boulder, CO 80305-3337, USA Received: 27 April 2010 – Published in Biogeosciences Discuss.: 13 July 2010 Revised: 29 October 2010 – Accepted: 29 October 2010 – Published: 12 November 2010
Abstract. The attribution of spatial and temporal variations in terrestrial methane (CH4 ) flux is essential for assessing and mitigating CH4 emission from terrestrial ecosystems. In this study, we used a process-based model, the Dynamic Land Ecosystem Model (DLEM), in conjunction with spatial data of six major environmental factors to attribute the spatial and temporal variations in the terrestrial methane (CH4 ) flux over North America from 1979 to 2008 to six individual driving factors and their interaction. Over the past three decades, our simulations indicate that global change factors accumulatively contributed 23.51 ± 9.61 T g CH4 -C (1 Tg = 1012 g) emission over North America, among which ozone (O3 ) pollution led to a reduced CH4 emission by 2.30 ± 0.49 T g CH4 -C. All other factors including climate variability, nitrogen (N) deposition, elevated atmospheric carbon dioxide (CO2 ), N fertilizer application, and land conversion enhanced terrestrial CH4 emissions by 19.80 ± 12.42 T g CH4 -C, 0.09 ± 0.02 T g CH4 -C, 6.80 ± 0.86 T g CH4 -C, 0.01 ± 0.001 T g CH4 -C, and 3.95 ± 0.38 T g CH4 -C, respectively, and interaction between/among these global change factors led to a decline of CH4 emission by 4.84 ± 7.74 T g CH4 -C. Climate variability and O3 pollution suppressed, while other factors stimulated CH4 emission over the USA; climate variability significantly enhanced, while all the other factors exerted minor effects, positive or negative, on CH4 emission in Canada; Mexico functioned as a sink for atmospheric CH4 with a major contribution from climate change. Climatic variability dominated the inter-annual variations in terrestrial CH4 flux at both continental and country levels. Precipitation played Correspondence to: H. Q. Tian (
[email protected])
an important role in the climate-induced changes in terrestrial CH4 flux at both continental and country-levels. The relative importance of each environmental factor in determining the magnitude of CH4 flux showed substantially spatial variation across North America. This factorial attribution of CH4 flux in North America might benefit policy makers who would like to curb climate warming by reducing CH4 emission.
1
Introduction
Following carbon dioxide (CO2 ), methane (CH4 ) is the second most radiatively important anthropogenic greenhouse gas which contributes approximately 15% (Rodhe, 1990), or even higher (Shindell et al., 2005), to the increases in radiative forcing caused by anthropogenic release of greenhouse gases to the atmosphere (Lelieveld and Crutzen, 1992; Forster et al., 2007). Current regional estimates of CH4 flux, however, are far from certain not only because of the complexity of biotic and abiotic processes responsible for the production and consumption of CH4 (Bousquet et al., 2006; Conrad, 1996), but also because of the limitations and uncertainties in the approaches used for estimations (Denman et al., 2007; Tian et al., 2010a); for example, the uncertainties in the methods of up-scaling and down-scaling (Chen and Prinn, 2006; Liu, 1996), biases in observational data (Sellers et al., 1997; Song et al., 2009; Moosavi et al., 1996), and the uncertainties caused by weakened high spatial heterogeneity of ecosystem properties in the regional estimation of CH4 flux (Frolking and Crill, 1994; Mastepanov et al., 2008; Ding et al., 2004a). Process-based modeling approach has become more and more important in regional estimation of CH4 flux because it bases on the understanding of biogeochemistry of
Published by Copernicus Publications on behalf of the European Geosciences Union.
3638 CH4 production and consumption, and incorporates the effects of spatial and temporal heterogeneities of major environmental controls on CH4 processes (Tian et al., 2010a; Potter et al., 2006; Potter, 1997; Walter et al., 2001; Zhuang et al., 2004). One of the most challenging issues for process-based modeling approach, however, is the gap between reality and “virtual reality” in models for simulating all major processes and environmental factors responsible for CH4 production and consumption (Schimel, 2001; Tian et al., 2008; Conrad, 1996). The controlling factors for CH4 production and consumption have been identified as substrates including dissolved organic carbon, CO2 , and methanol, and environmental factors including soil pH, oxygen concentration, moisture, temperature, and nitrate concentration etc. (Mer and Roger, 2001; Conrad, 1996). In the globally changing environment, a number of factors may change these substrates and/or environmental factors and further alter CH4 production and consumption; for instance, elevated atmospheric CO2 may enhance CH4 emission by stimulating CH4 production (Hutchin et al., 1995) or reduce CH4 oxidation in soils (Phillips et al., 2001); O3 pollution might suppress CH4 emission (Morsky et al., 2008); climate change may increase or decrease CH4 emission (Cao et al., 1998; Frolking and Crill, 1994; Martikainen et al., 1993); N input (Ding et al., 2004b) including N deposition (Steudler et al., 1989) and N fertilization (Zou et al., 2005) might increase (B¨orjesson and Nohrstedt, 1998; Bodelier et al., 2000) or decrease (Mer and Roger, 2001; Liu and Greaver, 2009; Steudler et al., 1989) CH4 oxidation; and changes in land cover types may increase or decrease CH4 flux, depending on the direction of land conversion (Willison et al., 1995; Huang et al., 2010; Jiang et al., 2009). In the changing world to which multiple global change factors contribute individually or in combination (Heimann and Reichstein, 2008), attributing the variations in regional terrestrial CH4 flux to these global change factors is of great significance for understanding atmospheric CH4 dynamics and for policy-making to curb the increase in atmospheric CH4 concentration. Yet, most previous process-based modeling efforts did not simultaneously take into account the effects of these global change factors in the estimations of regional CH4 flux (Cao et al., 1998; Potter, 1997; Zhuang et al., 2007). For instance, Zhuang et al.’s studies only considered the effects of climate variability, rising atmospheric CO2 , and land classification; other factors including changes of land cover, N deposition, and O3 pollution, were not considered (Zhuang et al., 2004, 2007); most other studies even simulated solely the effects of climate variability (Cao et al., 1998; Potter, 1997; Walter et al., 2001). Given the complicated effects of multiple global change factors on CH4 production and oxidation (Amaral et al., 1998; B¨orjesson and Nohrstedt, 1998; Mer and Roger, 2001), and high spatial and temporal heterogeneities of global change factors (Denman et al., 2007; Heimann and Reichstein, 2008), it is urgent to siBiogeosciences, 7, 3637–3655, 2010
X. F. Xu et al.: Attribution of CH4 flux in North America multaneously incorporate multiple global change factors into the simulation of CH4 flux for evaluating the relative contributions from each factor to the spatial and temporal variations in terrestrial CH4 flux at large scale (Bousquet et al., 2006). North America, one of the extensively studied continents on CH4 budget, is still short of quantification on the relative contributions from global change factors to terrestrial CH4 flux (Bridgham et al., 2006; Potter et al., 2006). In our previous study (Tian et al., 2010a), the continental and country-level fluxes of CH4 over North America’s terrestrial ecosystems during 1979–2008 have been estimated by using a process-based ecosystem model, Dynamic Land Ecosystem Model (DLEM), driven by multiple global change factors including climate variability, rising atmospheric CO2 , O3 pollution, N deposition, land use change, and N fertilizer application. In this study, we will advance our analysis with emphasis on the attribution of the spatial and temporal variations in terrestrial CH4 flux to multiple global change factors at both continental and country levels. Specifically, the objectives of this study are (1) to examine the factorial contributions to the spatial variation of terrestrial CH4 flux over North America during 1979–2008; (2) to quantify the factorial contributions to the temporal variations in terrestrial CH4 flux over North America during 1979– 2008; (3) to quantify the factorial contributions to the 30year accumulated fluxes of CH4 over North America at both continental and country levels; and (4) to identify the major factors responsible for the spatial and temporal variations in terrestrial CH4 fluxes at both continental and country levels. The global change factors that will be evaluated in this study include climate variability, elevated atmospheric CO2 , N deposition, O3 pollution, changes in land use and land cover types, and N fertilizer application. The interactive effects among these six factors were calculated by subtracting the changes in CH4 flux resulted from the combined effects of changes in CH4 flux caused by individual effect from each factor (see Experiment design section for the detail information).
2 2.1
Materials and methods Brief description of the model used in this study
The model used in this study is called the Dynamic Land Ecosystem Model (DLEM) which couples major biogeochemical cycles, hydrological cycles, and vegetation dynamics to make daily, spatially-explicit estimates of carbon (C), nitrogen (N), and water fluxes and pool sizes in terrestrial ecosystems (Tian et al., 2008, 2010a, b; Ren et al., 2007; Liu et al., 2008; Zhang et al., 2007). The DLEM also simulates the managed ecosystems including agricultural ecosystems, plantation forests and pastures. The spatial data set of land management, such as irrigation, fertilizer www.biogeosciences.net/7/3637/2010/
X. F. Xu et al.: Attribution of CH4 flux in North America
3639
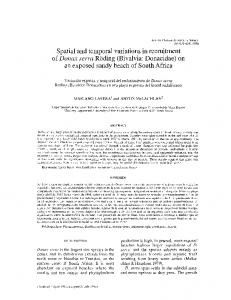
application, rotation, and harvest can be used as input information for simulating influences of land management on the structure and functioning of ecosystems. This model has been calibrated against various field data from the Chinese Ecological Research Network (CERN), US Long-Term Ecological Research (LTER) network, and AmeriFlux network which cover various ecosystems, including forests, grasslands, shrub, tundra, desert, wetland, and croplands. The simulated results have been compared with independent field data and satellite products. The DLEM operates at a daily time step and at a variety of spatial scales ranging from meters to kilometers, from regional to global. The detailed information for DLEM could be referred to our previous publications (Chen et al., 2006; Liu et al., 2008; Ren et al., 2007; Zhang et al., 2007a; Ren, 2009; Zhang, 2008; Lu, 2009; Tian Major processes: Aoxid: Atmospheric CH4 oxidation; CH4 pro : CH4 production; CH4 oxid : CH4 Oxidation during diffusion and ebullition transport; CH4 oxidp : CH4 et al., 2010b; Xu, 2010), and the CH4 module has been deoxidation during plant-mediated transport; CH4 oxidsoil : CH4 oxidation in soil; Dif: scribed in detail in Tian et al. (2010a). CH4 diffusion transport; Ebu: CH4 ebullition transport; Pmt: Plant-mediated transport of CH4 (Occur in herbaceous wetland only); GPP is the gross primary production, RA The methane module in the DLEM model mainly simis the autotrophic respiration from plant, and RH is the heterotrophic respiration; DOC ulates the production, consumption, and transport of CH4 is the dissolved organic carbon. Drivers are the multiple global change factors which yield controls on or feedback to ecosystem processes in the DLEM framework. The (Fig. 1). Due to the relatively small contribution from other effects from drivers were expressed as the line starting from drivers to ecosystem prosubstrates (Conrad, 1996; Mer and Roger, 2001), DLEM cesses or pools. Solid lines represent direct, while dash lines represent indirect impacts on CH4 processes. only considers the CH4 production from dissolved organic carbon (DOC), which is indirectly controlled by environFig. 1. Conceptual diagram showing major processes for CH4 promental factors including soil pH, temperature and soil moisduction, oxidation and transport from the soil/water to the atmoture content. The DOC was produced through three1 pathsphere in response to multiple global change factors. ways, GPP allocation, and side products from soil organic 2 Fig. 1. Conceptual diagram showing major processes for CH4 production, oxidation 3 transport from the soil/water to the atmosphere in response to multiple global change factors matter and litter-fall decomposition. CH4 oxidation, includair temperature, APAR is absorbed photosynthetically active ing the oxidation during CH4 transport to the atmosphere, 4 radiation. Vmaxoxid is the maximum rate of CH4 oxidation, CH4 oxidation in the soil/water, and atmospheric CH4 oxiwhich could be each of three oxidation processes simulated dation on the soil surface, is determined by CH4 concentrain the DLEM; f (Tsoil , WFPS) describes the direct effects of tions in the air or soil/water, as well as soil moisture, pH, soil temperature and moisture on CH4 oxidation; Tsoil is soil and temperature. Most CH4 -related biogeochemical reactemperature, WFPS is water filled pore space. It should be tions in the DLEM were described as the Michaelis-Menten noted that WFPS is directly related to precipitation. Meanequation with two coefficients: maximum reaction rate and while, soil temperature, pH and moisture directly influence half-saturated coefficient. Three pathways for CH4 transport CH4 production, while O3 pollution and N input indirectly from soil to the atmosphere including ebullition, diffusion, influence CH4 oxidation through their impacts on ecosystem and plant-mediated transport, are considered in the DLEM processes. The impacts of land conversion on CH4 flux could (Tian et al., 2010a). be caused by land-conversion-induced alterations in either Multiple global change factors yield direct and/or indisubstrate or environmental factors. It should be noted that rect impacts on CH4 processes as simulated in the DLEM the above equation solely summarizes the direct and indi(Fig. 1), which could be expressed as the following equation. rect effects of multiple global change factors on CH4 processes; some other environmental factors which might influFCH4 = Vmaxprod f (Ca , w, Tair ,APAR)f (O3 )f (N) ence CH4 processes were not included in this equation, for example, soil pH, soil texture etc. (1) −Vmaxoxid f (Tsoil, WFPS) where FCH4 is the CH4 flux; Vmaxprod is the maximum rate of CH4 production; f (Ca , w, Tair, APAR) describes the indirect effects of atmospheric CO2 concentration, soil moisture, air temperature, and absorbed photosynthetically active radiation on CH4 production through their effects on photosynthesis; f (O3 ) describes the indirect effects of O3 pollution on CH4 flux via its effects on photosynthesis; f (N) describes the indirect effects of N input on CH4 production through its impacts on photosynthesis and ecosystem respiration; Ca is atmospheric CO2 concentration, w is soil moisture; Tair is www.biogeosciences.net/7/3637/2010/
2.2
Study area and input data
North America was selected in this study. It includes United States of America (USA), Canada, and Mexico, covering a total area of approximately 24.71 million km2 , about 4.8% of the planet’s surface or 16.5% of its land area. Excluding water body and river, the North America consists of 21 237 grids, at a spatial resolution of 32 km × 32 km, which is consistent with North American Regional Reanalysis (NARR) dataset. Biogeosciences, 7, 3637–3655, 2010
and
41
3640 We developed gridded, geo-referenced, time-series input data sets of climate (including daily temperature, precipitation, humidity, and solar radiation), annual N deposition rate, annual land-cover change and land management practices (including fertilizer application, irrigation) for the entire continent. The climate dataset was generated based on NARR dataset (Mesinger et al., 2006). NARR data were provided by the NOAA/OAR/ESRL PSD, Boulder, Colorado, USA, from their Web site at http://www.esrl.noaa.gov/psd/. The maximum, minimum and average temperatures were calculated based on eight 3-h averages in one day. Precipitation, solar radiation, and relative humidity were directly derived from the NARR dataset. Land-use and land-cover change data were extracted from a global data set, History Database of the Global Environment (HYDE 3.0) (Klein and van Drecht, 2006). O3 pollution data was retrieved from a global dataset developed by Felzer et al. (2005). Annual N deposition data were retrieved from a global data set that was extrapolated from three yearly maps (Dentener et al., 2006). Soil property data, including soil texture, soil pH, soil bulk density, were extracted from a global data set, Global Soil Data Task, which is posted online in the Oak Ridge National Laboratory Distributed Active Archive Center (www.daac.ornl.gov). Fertilizer application data for North America was developed by combining several data sources, including Food and Agriculture Organization (FAO) country-level data (www.fao.org), United State county-level data (www.usda.gov), and Canada provinciallevel data (www.cfi.ca). All the datasets were transformed and re-projected to one projection system for driving the DLEM. The annual atmospheric concentration of CO2 before 1959 was estimated by The Vegetation/Ecosystem Modeling and Analysis Project (VEMAP), and the data after 1959 were provided by National Oceanic and Atmospheric Administration (NOAA) (www.esrl.noaa.gov). The spatial distribution of potential vegetation types was developed using different sources of data, including global land-cover derived from Landsat imageries (De Fries et al., 1998), National Land Cover Dataset 2000 (www.usgs.gov), and global database of lakes, reservoirs and wetland (Lehner and D¨oll, 2004). Historical data from 1901 to 2008 are prescribed as transient input data sets in this study. The transient input data include: (1) historical daily climate data from 1901 to 2008 including maximum, minimum and average temperatures, relative humidity, solar radiation, and precipitation; the data from 1901 to 1978 were randomly assigned as one year during 1979–2008; (2) historical annual N deposition from 1901 to 2008; (3) historical annual O3 pollution data from 1901 to 2008; (4) historical atmospheric CO2 concentration from 1901 to 2008; (5) historical cropland and urban distribution from 1901 to 2005; the land use since 2005 was assumed to be unchanged due to the shortage of data; and (6) historical N fertilizer application data for cropland for the time period of 1901–2008.
Biogeosciences, 7, 3637–3655, 2010
X. F. Xu et al.: Attribution of CH4 flux in North America 2.3
Experimental design
To determine the relative effects of N deposition, O3 pollution, climate variability, elevated atmospheric CO2 , land-use change, and N fertilizer application on the terrestrial CH4 flux over North America, we conducted nineteen simulations in this study (Table 1). One overall simulation was set up to simulate the terrestrial CH4 flux over North America by considering the temporal and spatial dynamics of all six global change factors. Six more simulations were set up to simulate the effects of each individual factor on CH4 flux. For example, to determine the effects of climate variability alone, we ran DLEM using the gridded historical daily data for air temperature including maximum, minimum, and average air temperature, relative humidity, solar radiation, and precipitation, but kept all other five global change factors at the level in 1900: the atmospheric CO2 concentration, N deposition, O3 pollution, and N fertilizer application for cropland were kept constant at the level in 1900 and the land cover type in the year of 1900 (potential vegetation map with cropland and urban land in 1900). To determine the effects of CO2 fertilization alone, we ran DLEM using the historical atmospheric CO2 concentrations, but kept all other five global change factors constant: a 30-year average daily climate data was used to represent the constant climatic data and the potential vegetation map with crop and urban land in 1900 was used to represent the constant land cover type, N deposition, O3 pollution, and N fertilizer application data were kept constant in the year of 1900. For each of the above seven simulations, we set up one corresponding simulation which is the same as the previous simulation except the input data in 1979 was used to drive the post-1979 simulations; this design is used to capture the internal dynamics of the system which will serve as baseline. Five more simulations were set up to separate the contributions from each single climate variable: precipitation, temperature (maximum, average, minimum), solar radiation, and relative humidity. Four simulations were set up to simulate the contribution from each of four climate variables, and one more was set up as baseline to exclude the contribution from system dynamics; i.e. the post-1979 simulations were fed by 1979 climate data (Table 1). The implementation of DLEM simulation includes the following steps: (1) equilibrium run, (2) spinning-up run and (3) transient run. In this study, we first used potential vegetation map, long-term mean climate during 1979–2008, the concentration levels of N deposition, O3 pollution, atmospheric CO2 in the year of 1900 to drive the model run to an equilibrium state (i.e. the inter-annual variations are