audio alignment between the solo audio and the full audio is ... ment requires the full audio to be decomposed into solo part ..... [3] Y. Han and C. Raphael.
2014 IEEE International Conference on Acoustic, Speech and Signal Processing (ICASSP)
AUDIO PART MIXTURE ALIGNMENT BASED ON HIERARCHICAL NONPARAMETRIC BAYESIAN MODEL OF MUSICAL AUDIO SEQUENCE COLLECTION Hiroshi G. Okuno†
Akira Maezawa⋆†
†
⋆
Yamaha Corporation R&D Division 203 Matsunokijima, Iwata, Shizuoka, Japan
Kyoto University Graduate School of Informatics Yoshida Honmachi, Sakyo-ku, Kyoto, Japan
ABSTRACT This paper proposes “audio part mixture alignment,” a method for temporally aligning multiple audio signals, each of which is a rendition of a non-disjoint subset of a common piece of music. The method decomposes each audio signal into shared components and components unique to each rendition. At the same time, it aligns each audio signal based on the shared component. Decomposition of audio signal is modeled using a hierarchical Dirichlet process (Hierarchical DP, HDP), and sequence alignment is modeled as a leftto-right hidden Markov model (HMM). Variational Bayesian inference is used to jointly infer the alignment and component decomposition. The proposed method is compared with a classic audio-to-audio alignment method, and it is found that the proposed method is more robust to the discrepancy of parts between two audio signals. Index Terms— Audio-audio alignment, Nonparametric hierarchical bayes 1. INTRODUCTION Playing with an orchestra or top-notch musicians is among the favorite musical daydreams of amateur classical musicians. One way to realize such a dream, other than becoming a world-class artist himself, is to use MIR technology: source separation techniques can be used to generate a karaoke track of the user’s favorite audio recording (henceforth referred to as “full audio”). Then, the user could play the solo part (henceforth referred to as “solo audio”), to which the karaoke track plays back in sync using alignment techniques. In this kind of problem, informed source separation is the method of choice because unsupervised source separation difficult in a highly polyphonic mixture such as music, and additional information is highly helpful. For example, source separation becomes easier if the user could provide a digital music score data [1–5]. In this case, a good temporal alignment of the musical audio and the digital music score is critical [6–9]. It is also possible to aid separation by manually annotating the spectrogram [10]. Because the target user is a musician, we believe that informed source separation should be guided by the main control input of a musician: the audio of the musician’s play-
978-1-4799-2893-4/14/$31.00 ©2014 IEEE
5249
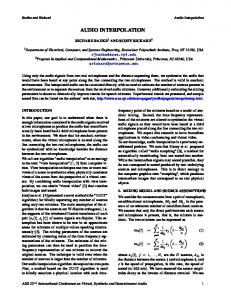
Fig. 1. Idea behind audio part mixture alignment. Assuming audio 1 and 2 play subsets of a same score, the method would align the audio signals by focusing on the notes played by both signals (shaded noteheads).
ing. Specifically, the method should take only two inputs: the solo audio played by the user, and the full audio. The method would separate from the full audio the component that corresponds to the solo audio. In this case, then, a good audio-toaudio alignment between the solo audio and the full audio is critical; users may not be necessarily skilled enough to play in sync with the full audio, as done in an existing study [11]. Solo-to-full audio alignment is a difficult task because these signals are spectrally very different. Thus, finding the alignment requires the full audio to be decomposed into solo part and the rest; however, the solo-to-full audio alignment is necessary to decompose the full audio into such components. In this paper, we present an offline alignment method that is capable of aligning a solo audio and a full audio. Specifically, we define and present an audio part mixture alignment method, which is a generalized task that encompasses solo audio-to-full audio alignment. This objective of this task is to align multiple musical audio signals, each signal of which is an audio rendition of a unique but non-disjoint subset of a common music score. That is, we are interested in aligning, for example, a rendition of the violin plus the viola part, and the viola plus the cello part of a string trio. As illustrated in Fig. 1, the method would align audio signals by looking for notes that are played by two or more renditions. Our method is similar in spirit to noise-robust alignment [12], except we allow every recording to contain an audio signal unique to each recording, and signals played by two or more recordings. Hierarchical Bayes is used to model the collection of audio part mixtures, which allows us to model the notion of subsets to a common music score. Our model estimates spec-
tral time-slices that comprise the collection. Then, the sequence of activation of atoms is modeled using a hierarchical left-to-right HMM (LRHMM). The HMM is designed to take into account that each audio emits only some of the all possible atoms that may be emitted at a given state. Then, forced alignment is used to estimate the alignment of each audio signal. 2. FORMULATION We assume that musical audio collection is comprised of a collection of symbols, each symbol of which is associated with an audio spectral time-slice. Moreover, we model music as a sequence of the set of symbols to emit, constrained such that every musical audio traverses the state sequence in the same order. Finally, we assume that for each state, each musical audio emits a subset of the set of symbols associated with the state. Then, the problem of part mixture alignment becomes that of inferring the state sequence associated with each musical audio. Let us formalize this concept. Let X(d, t, f ) be the power spectrogram of dth audio signal in a collection of D audio part mixtures, evaluated at time t of duration Td and frequency bin f of F bins. We interpret X as the number of times time-frequency bin (t, f ) was observed for the dth signal, as in [13]. Let us introduce a variable C(d, c, f, t) = 1, where c is defined for c ∈ [1, X(d, f, t)]. In other words, ∑ c C(d, c, f, t) = X(d, t, f ). We assume that each count C is generated from a spectral “atom,” which is an element from the set of all possible spectral time-slice that can be generated. An atom may resemble the spectral time-slice of, say, a note played by an instrument, or that of a percussion. Denote the kind of the distribution of atoms that can be emitted in the collection X(d, t, f ) as G0 . The number of atoms in G0 should grow with the complexity of data. To this end, G0 is modeled as a draw from the Dirichlet process (DP) with concentration parameter α and base measure H: G0 ∼ DP (α, H) (1) In other words, H defines a measure over the space of distribution of atoms, and α controls the growth of the effective number of atoms in G0 . In our case, we choose H to be a Dirichlet distribution of length F , Dir (g0 (f )), though other choices, such ones that incorporate harmonicity constraints [13], are possible as well. In effect, G0 defines a countable collection of distribution of a spectral time-slice, whose effective size is governed by α and the observation. Next, we consider the generative process of a music score. We formalize music score as a state sequence such that every signal that plays it traverses the sequence in the same order. Therefore, we model music score as a LRHMM: Z(d, 1 · · · Td ) ∼ LRHMM(π, τ ) (2) Here, LRHMM(π, τ ) denotes LRHMM with initial state pdf π, and state transition pdf τ . By definition, τ is constrained such that it either stays in the current state or moves to the next state. Note that we ignore structural discrepancies between
5250
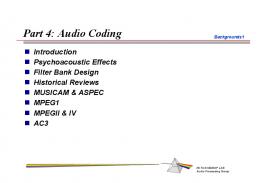
Fig. 2. Graphical model of our method. two signals, such as repeats and cuts. Each state of the music score is associated with a subset of G0 , called a “chord.” Each audio signal is allowed to emit, at each state, a subset of the chord. We denote the chord at state s as Gs , and assume it is drawn from a DP with concentration parameter β, and base measure G0 : Gs ∼ DP (β, G0 ) (3) Intuitively, chords Gs correspond to the notated notes in the music score, and is a subset of G0 , which roughly corresponds to all notes notated in the piece of music; state sequence Z corresponds to sequence of positions in the music score. Finally, we consider how each audio signal renders the music score. At each state s in the score, each audio signal chooses a subset of the chord Gs ; for example, an audio signal of a violin solo that plays a violin/piano duo chooses to emit only the atoms corresponding to the violin part. Therefore, we model the actual atoms emitted by signal d at state s, Gs,d , as a draw from a DP with concentration parameter γ and base measure Gs,d : Gs,d ∼ DP (γ, Gs )
(4)
We refer to the atoms of Gs,d as “signal-specific” atoms at state s. At time t, the state sequence Z is referenced to find the state s, and then the corresponding Gs,d generates a spectral atom ϕf (d, c, t): ϕf (d, c, t) ∼ GZ(d,t),d (f )
(5)
Finally, C(d, c, f, t) is drawn from ϕf (d, c, t): C(d, c, f, t) ∼ Mult(ϕf (d, c, t))
(6)
Here, Mult(·) denotes the multinomial distribution. Fig. 2 shows the graphical model. 2.1. Rewriting as a conjugate model Having defined the model, our goal is to determine the posterior distribution of the model. To this end, we seek to derive an inference scheme using variational Bayesian [14] (VB) method. Because VB inference is easy when the probabilistic model is conjugate, we rewrite our model to an equivalent conjugate model, based on Sethuraman’s stick-breaking construction [15].
normalization factor: First, we rewrite G0 . Let us draw I → ∞ spectral atoms from the base measure H using a stick-breaking pro∑ (A) (L) (X) cess (SBP). Specifically, we draw gf (i) ∼ Dir (gf,0 (i)) and Zi (s, j)Zj (d, s, k)Zk (d, c, f, s)Zs(S)(d, t) log gf (i) (g) i,f,j,s,k,d,c,t let w ∼ GEM (α). GEM (α) represents the SBP, which ∑ (A) ∑ (L) (g) (A) (g) (g) + Zi (s, j) log wi + Zj (d, s, k) log wj (s) draws wi by first drawing ξi ∼ Beta(1, α) and letting s,i,j d,s,j,k (g) (g) ∏i−1 (g) ∑ (X) (L) wi = ξi i′ (1 − ξi′ ). In other words, the SBP replaces + Zk (d, c, f, s)Zs(S)(d, t) log wk (d, s) the DP by an equivalent representation, where we succes∑ t,c,f,k,d,s ∑ (S) (S) sively draw from the base measure and assign to the draw + Zs(S)(d, t − 1)Zs′ (d, t) log τs,s′ + Zs (d, 0) log πs a multinomial likelihood of being chosen later on. The multit,s,d t,s,s′ ,d ( ) ∑ ( ) (g) (A) nomial is generated by iteratively breaking off a stick with + log GEM wi |α + log GEM wj (s)|β (g) proportion ξ , and setting the proportion of the broken stick s ) ( ∑ (L) relative to the original length as the likelihood. log GEM wk (d, s)|γ + log Dir (π|π0 ) + Next, we rewrite Gs by defining a DP over g for each state d,s ∑ ∑ s. We draw J → ∞ indicator variables Z (A)(s, j), jth of + log Dir (τs |τ0 ) + log Dir (gf (i)|gf,0 ) (9) which indicates to which global atom the jth atom within a s i chord in state s refers. Specifically, we draw Z (A)(s, j) ∼ Again, this model is fully conjugate, so standard variational (A) Mult(w(g) ), and w(A) (s) ∼ GEM (β), by letting ξj (s) ∼ Bayesian method [14] and truncation approximation to Sethu∏j−1 (A) (A) (A) Beta(1, β) and setting wj (s) = ξj (s) j ′ (1 − ξj ′ (s)). raman’s stick-breaking representation [15] can be used to arIn other words, atoms of Gs is realized by drawing j indices rive at an approximate posterior distribution. The derivation (g) is omitted due to space constraints. ranging from 1 to I according to wi , the length of the stick After the algorithm has converged, audio d can be aligned broken for the top-level DP, and the result of the draw is stored (S) by setting Z (A)(s, j) := i. Then, each of the J draws are asto d′ by first finding the MAP state sequence Zs (d, t) of each ′ sociated with a J-dimensional multinomial likelihood, drawn signal. Then, a mapping from d to d can be generated by by iteratively breaking a piece of stick. finding the MAP state of d, sˆ, and finding the time at signal Next, we rewrite Gs,d by drawing K → ∞ indicator varid′ such its MAP state is sˆ. (L) ables Z (d, s, k), kth of which indicates to which state-atom the kth signal-specific atom refers. Specifically, we draw 3. EVALUATION Z (L)(d, s, k) ∼ Mult(w(A) (s)), and w(L) (d, s) ∼ GEM (γ), (L) (L) by drawing ξk (d, s) ∼ Beta(1, γ) and setting wk (d, s) = We compare our method against an alignment method based ∏k−1 (L) (L) ξk (d, s) k′ (1 − ξk′ (d, s)). In other words, we draw K on dynamic time warping (DTW) that uses the cosine disindices according to w(A) (s), and associating with the draws tance, one of the popular choices for similarity measure used a multinomial likelihood generated from the SBP. in audio alignment [16] 1 . We first compare the two methods for full audio-to-full audio alignment task (i.e., typical audioNext, we model each count C(d, c, f, t) as having origiaudio alignment). Then, we compare the two methods when nated from one of k signal-specific atoms, given Z (S)(d, t). the full audio is aligned against an audio part mixture. The We introduce a latent variable Z (X), which indicates the baseline is used to see how a “symmetric” distance behaves2 . signal-specific atom that generated C(d, c, f, t): For standard MIDI files to selected pieces of music as ( ) (X) (L) (S) shown in Table 1, we synthesized each part using a software Z (d, c, f, t) ∼ Mult w (d, Z (d, t)) (7) synthesizer using FreePats patch [17]. For the piano part, the right hand (RH) and the left hand (LH) were synthesized sepThen, the observation likelihood can be modeled as follows: arately. For each music, we then prepared a time-stretched [ ( ( ( )))] version of the full audio, by adding all parts to a given song, C(d,c,f,t) ∼ Mult g Z (A) s,Z (L) d,s,Z (X)(d,c,f,t) (8) and time-stretching the resulting audio such that it is 20% slower than the original. Then, the alignment to the full audio was computed for stretched audio of the the melodic part where s = Z (S)(d, t). Notice that variable ϕf introand the stretched full audio. Finally, for each alignment comduced in the previous section has) been replaced with ( ( ( )) puted, we computed the cumulative distribution of the abso. This means that ϕf g Z (A) s, Z (L) d, s, Z (X)(d, c, f, t) lute alignment error. is constrained to be one of draws from G0 , and the hierarchy X(d, t, f )s were computed by evaluating the spectrogram of DP’s used to arrive at ϕf is realized by traversing the index of each audio signal using sampling frequency of 44.1kHz, associated with an element of each layer’s DP. 1 We found cosine distance to be robust in a typical audio-score formulaWe shall now represent the latent variables as binary, 1tion, and is hence used as the baseline, instead of other possible distributions (S) ′ of-K variables. For example, Z (d, t) = s is denoted as such as l1 or l2 norm. 2 Note that the baseline is not intended to make claims about the perfor(S) Zs (d, t) = 1 for s = s′ and 0 otherwise. Then, the commance of our method in comparison to current audio alignment methods, which incorporate features more sophisticated than simple power spectrum. plete log-joint likelihood is given as follows, up to a constant
5251
Table 1. Comparison of alignment error percentages with audio alignment based on cosine-distance DTW (“Cos.”) and the proposed method (“Prop.”), for alignment between full and full audio (“Full-Full”), and alignment between full and a melodic part audio (“Solo-Full”), average over pairs of audio parts (“Part-Part”), and average over parts pairs and full audio (“Part-Full”).
J.S. Bach, BWV847 Fugue F. Chopin, Op.22 Bars 1-16 of Polonaise J. Brahms, Op.40 Bars 1-32 of Mvt. 1 P. Tchaikovsky, Op.35 Bars 8-34 of Mvt. 2
Part composition Piano RH+LH Piano RH+LH French Horn + Violin + Piano RH+LH Violin solo + Orchestra
Condition Full-Full Part-Full Full-Full Solo-Full Full-Full Part-Full Part-Part Full-Full Solo-Full
err